. 2019 Mar 28;2(2):e201800257.
doi: 10.26508/lsa.201800257. Print 2019 Apr.

The PI3K and MAPK/p38 pathways control stress granule assembly in a hierarchical manner

Affiliations

The PI3K and MAPK/p38 pathways control stress granule assembly in a hierarchical manner

Alexander Martin Heberle et al. Life Sci Alliance. .

Abstract

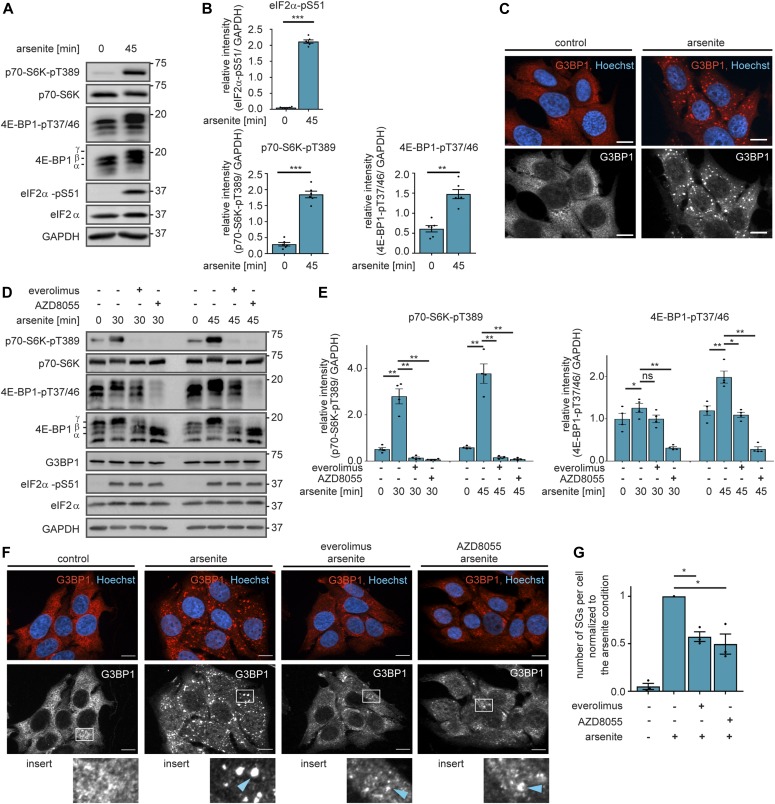
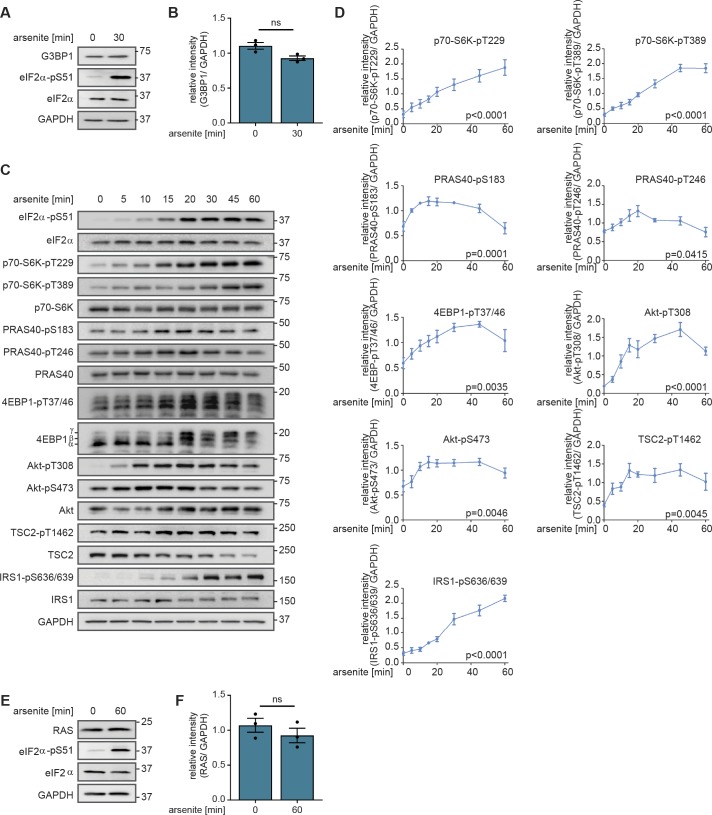
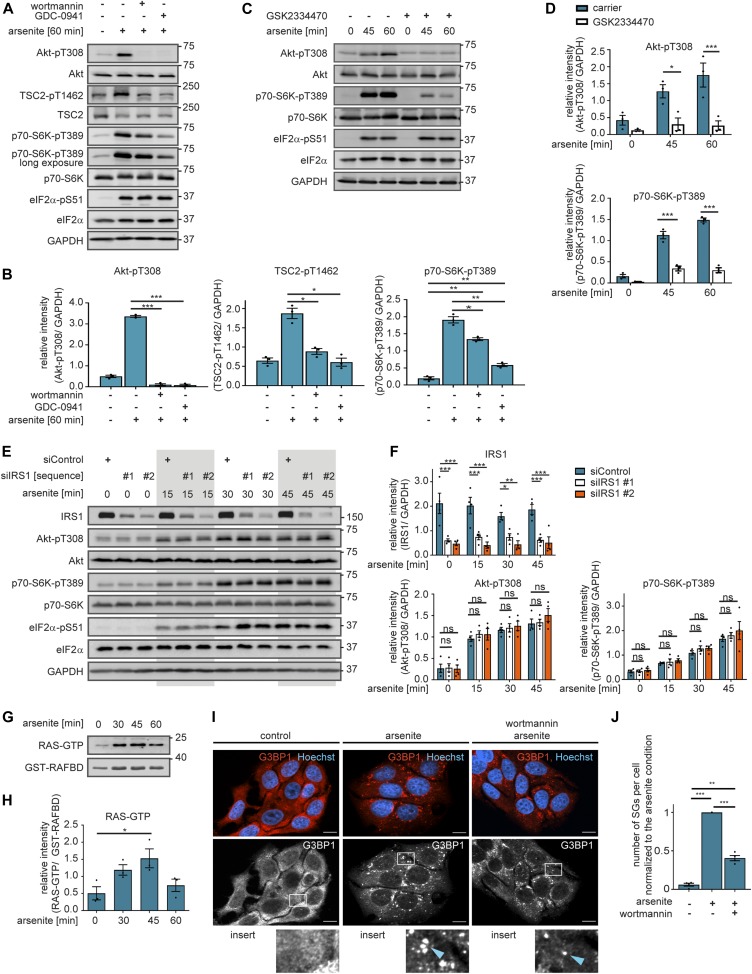
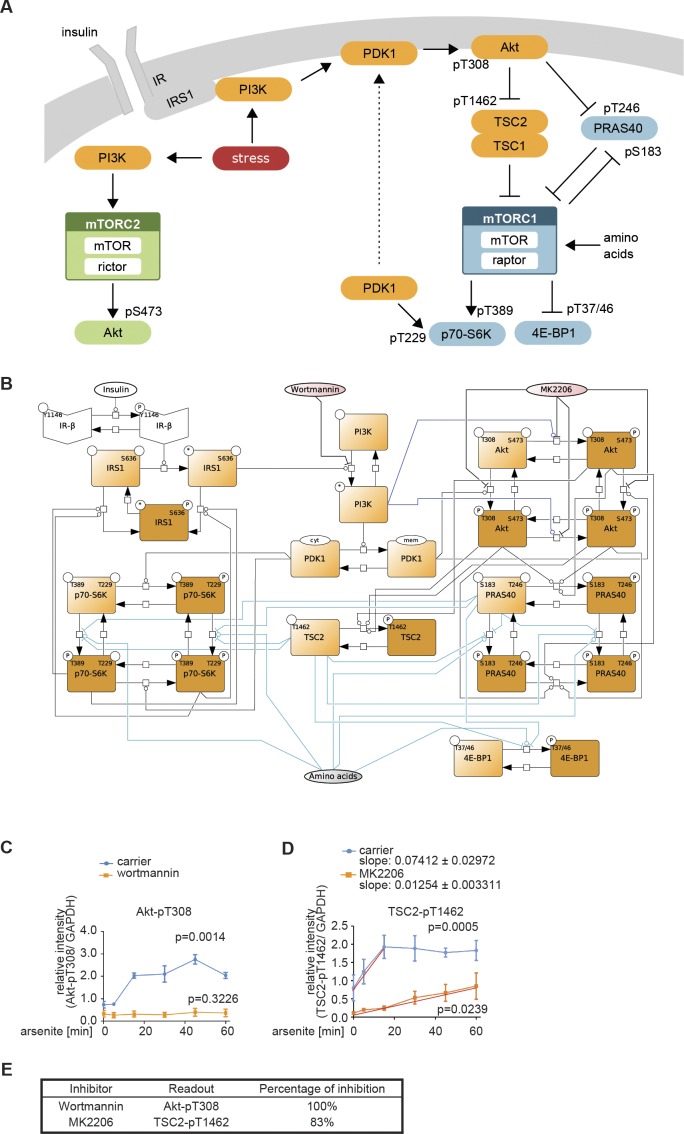
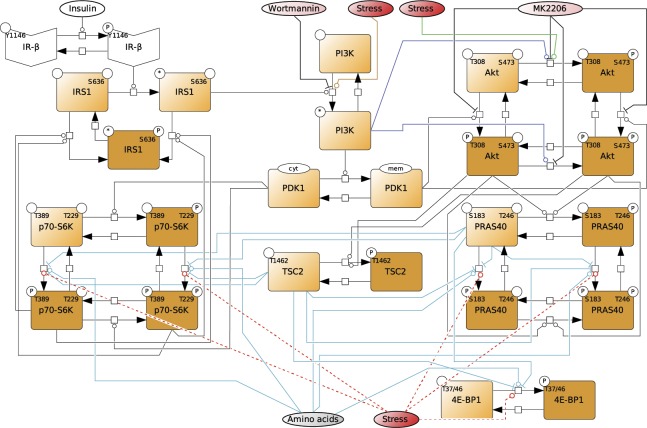
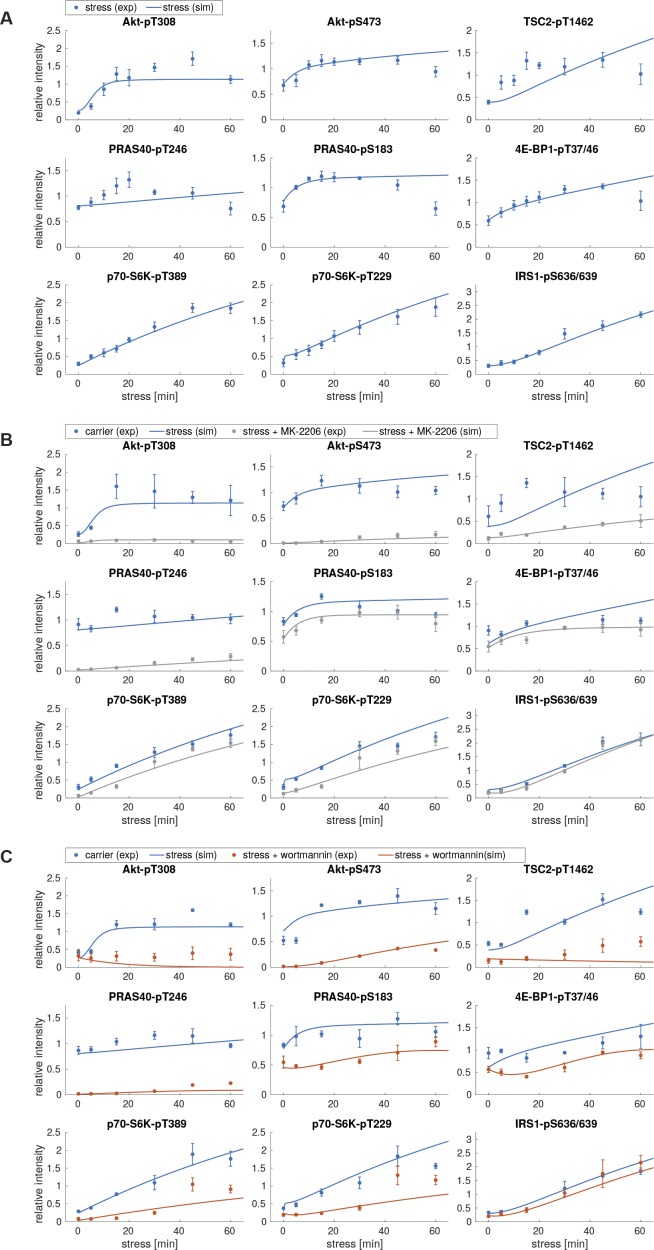
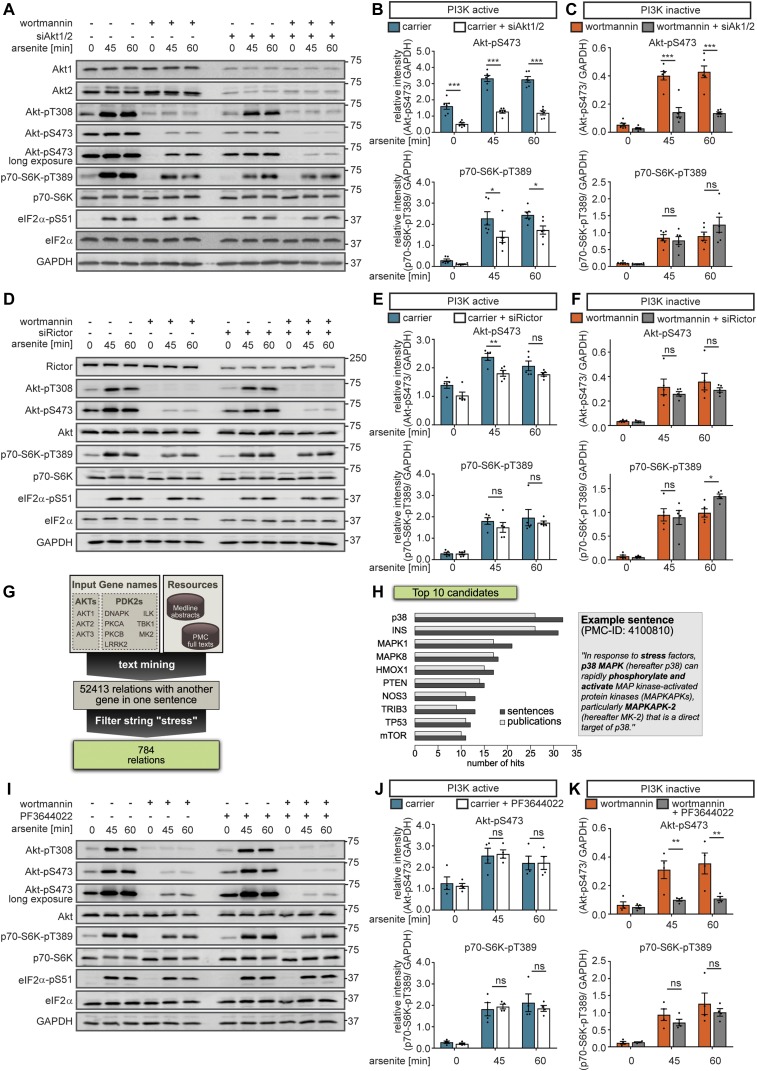
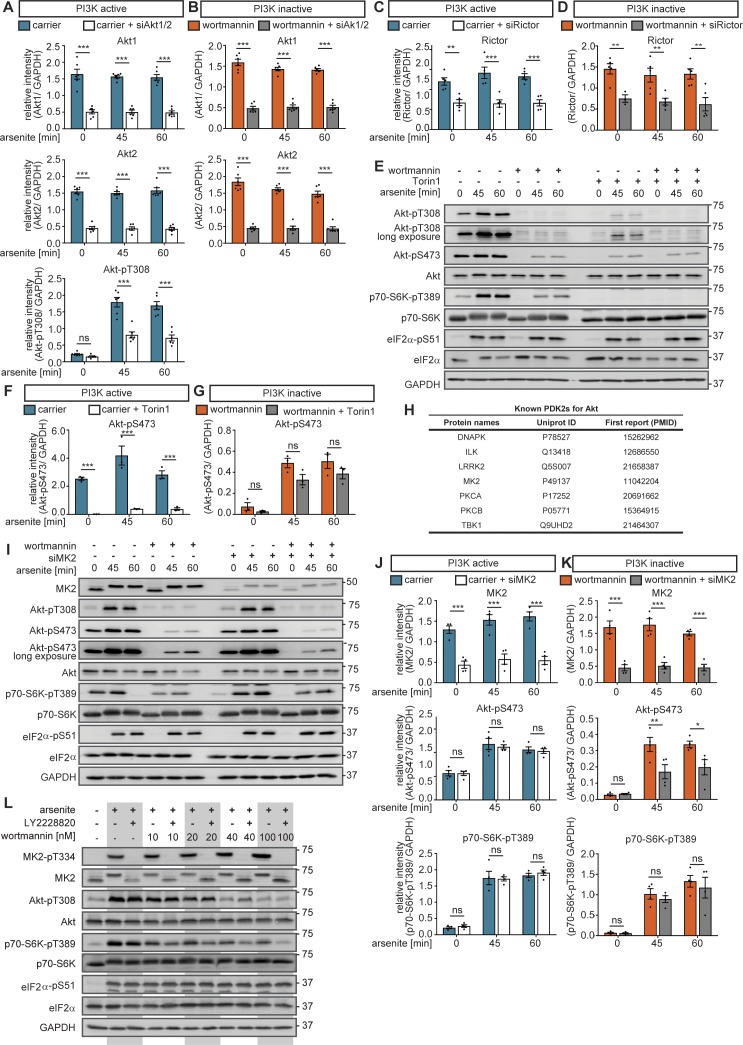
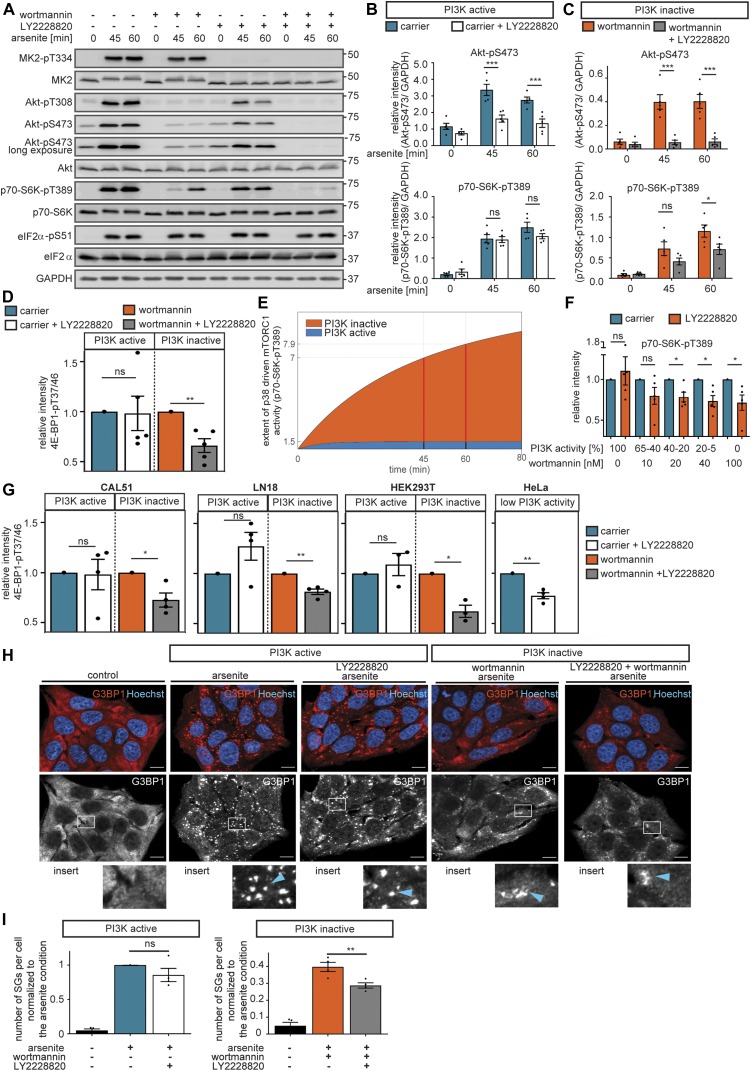
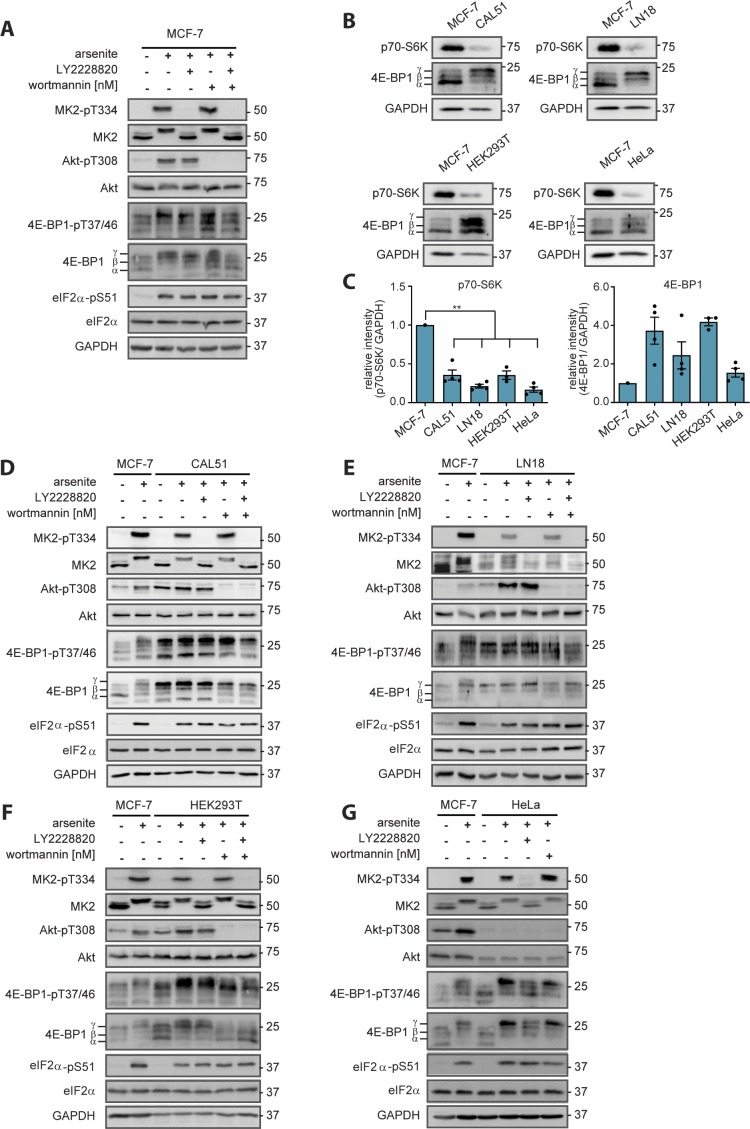
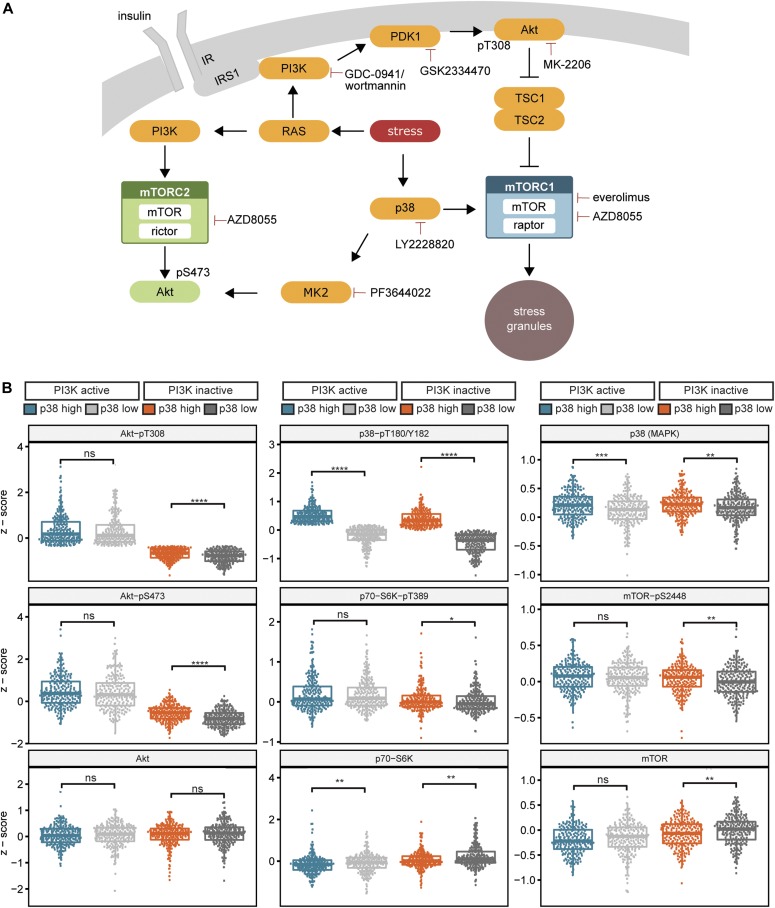
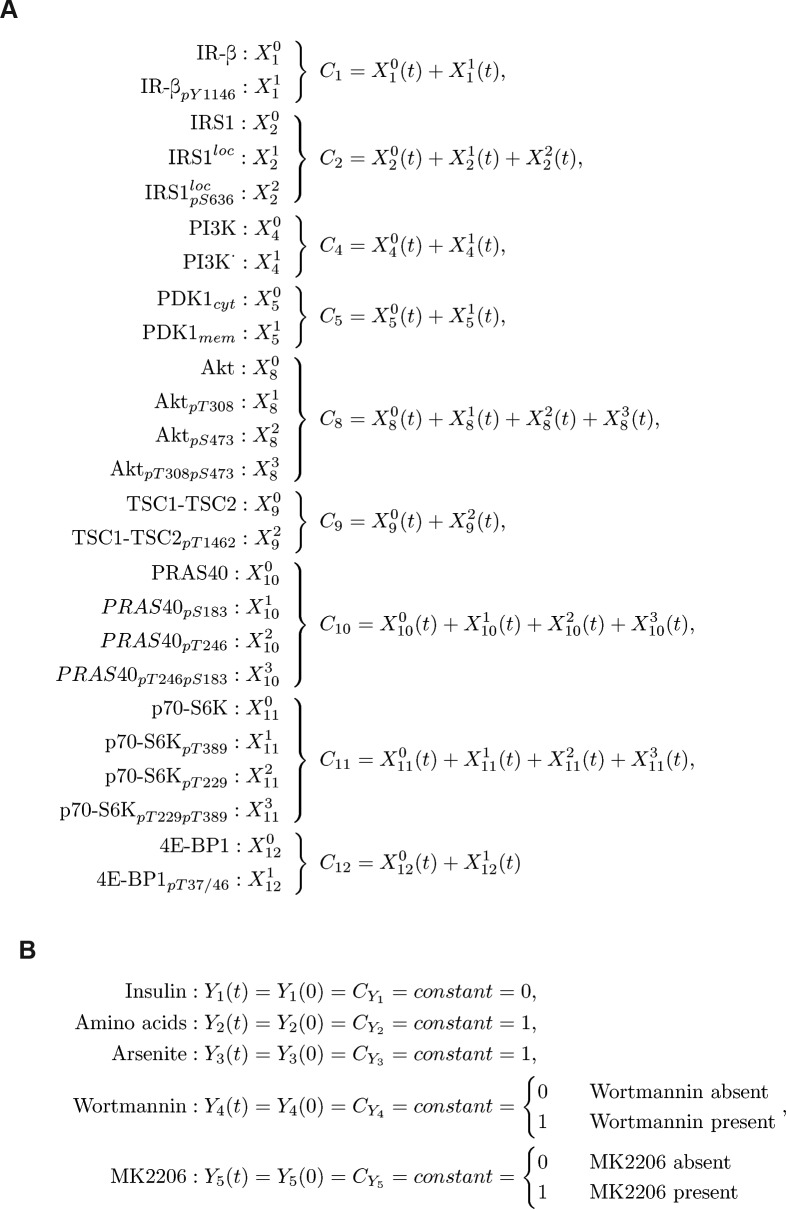
All cells and organisms exhibit stress-coping mechanisms to ensure survival. Cytoplasmic protein-RNA assemblies termed stress granules are increasingly recognized to promote cellular survival under stress. Thus, they might represent tumor vulnerabilities that are currently poorly explored. The translation-inhibitory eIF2α kinases are established as main drivers of stress granule assembly. Using a systems approach, we identify the translation enhancers PI3K and MAPK/p38 as pro-stress-granule-kinases. They act through the metabolic master regulator mammalian target of rapamycin complex 1 (mTORC1) to promote stress granule assembly. When highly active, PI3K is the main driver of stress granules; however, the impact of p38 becomes apparent as PI3K activity declines. PI3K and p38 thus act in a hierarchical manner to drive mTORC1 activity and stress granule assembly. Of note, this signaling hierarchy is also present in human breast cancer tissue. Importantly, only the recognition of the PI3K-p38 hierarchy under stress enabled the discovery of p38's role in stress granule formation. In summary, we assign a new pro-survival function to the key oncogenic kinases PI3K and p38, as they hierarchically promote stress granule formation.


Conflict of interest statement

The authors declare that they have no conflict of interest.

Figures

Figure 1.
Figure 1.. Stress activates mTORC1 to promote stress granule formation.
(A) Arsenite stress enhances phosphorylation of eIF2α-S51 and mTORC1 substrates. MCF-7 cells were serum-starved and treated with arsenite. p70-S6K-pT389, 4EBP1-pT37/46, and eIF2α-pS51 were monitored by immunoblot. Data represent six biological replicates. (B) Quantification of data shown in (A). eIF2α-pS51, p70-S6K-pT389, and 4E-BP1-pT37/46 levels were compared between control and arsenite-treated cells using a two-tailed t test across six biological replicates. Data represent the mean ± SEM. **P ≤ 0.01; ***P ≤ 0.001. (C) Arsenite induces stress granules. MCF-7 cells were serum-starved and exposed to arsenite for 30 min. Stress granules were visualized by immunofluorescence staining of G3BP1. Data represent three biological replicates. Nuclei were visualized using Hoechst 33342. Scale bar: 10 μm. (D) mTOR mediates induction of p70-S6K-pT389 and 4EBP1-pT37/46 by stress. MCF-7 cells were serum-starved and treated with arsenite in the presence of carrier (DMSO), everolimus (100 nM, mTORC1 inhibitor), or AZD8055 (100 nM, mTOR inhibitor). p70-S6K-pT389, 4E-BP1-pT37/46, G3BP1, and eIF2α-pS51 were monitored by immunoblot. Data represent four biological replicates. (E) Quantification of data shown in (D). p70-S6K-pT389 and 4E-BP1-pT37/46 levels were compared between the different treatments using a two-tailed t test across four biological replicates. Data represent the mean ± SEM. ns, not significant; *P ≤ 0.05; **P ≤ 0.01. (F) mTOR inhibition reduces stress granule numbers. MCF-7 cells were serum-starved and treated with arsenite for 30 min in the presence of carrier (DMSO), everolimus (100 nM, mTORC1 inhibitor), or AZD8055 (100 nM, mTOR inhibitor). Stress granules were visualized by immunofluorescence staining of G3BP1. Nuclei were visualized with Hoechst 33342. Data represent three biological replicates. White squares indicate region of insert and blue arrows highlight stress granules; scale bar 10 μm. (G) Quantification of data shown in (F): number of stress granules (SGs) per cell (normalized to the arsenite condition) across three biological replicates. Stress granule numbers were compared between the carrier and everolimus, or carrier and AZD8055-treated cells, using a two-tailed t test across three biological replicates. Data represent the mean ± SEM. *P ≤ 0.05.
Figure S1.
Figure S1.. The mTOR network upon arsenite treatment.
(A) G3BP1 levels are not affected by arsenite. MCF-7 cells were serum-starved and treated with arsenite. G3BP1 levels were monitored by immunoblot. Data represent three biological replicates. (B) Quantification of data shown in (A). G3BP1 levels were analysed using a two-tailed t test across three biological replicates. Data represent the mean ± SEM. (C) The mTOR network is activated by arsenite. MCF-7 cells were serum-starved and treated with arsenite for the indicated durations. Readouts across the mTOR network were monitored by immunoblot. Data represent four to six biological replicates. The number of biological replicates per readout is detailed in Supplemental Data 7. (D) Quantification of data shown in (C). Data represent the mean ± SEM. The indicated phosphorylation sites were analysed using a one-way ANOVA across four to six biological replicates. The number of biological replicates per readout is detailed in Supplemental Data 7. P-values of the ANOVA are depicted below the curve. (E) RAS levels are not affected by arsenite. MCF-7 cells were serum-starved and treated with arsenite. RAS levels were monitored by immunoblot. Data represent three biological replicates. (F) Quantification of data shown in (E). RAS levels were analysed using a two-tailed t test across three biological replicates. Data represent the mean ± SEM. ns, not significant.
Figure 2.
Figure 2.. PI3K enhances stress granule formation through mTORC1 activation.
(A) mTORC1 is activated by arsenite in a PI3K-dependent manner. MCF-7 cells were serum-starved and treated with arsenite in the presence of carrier (DMSO), wortmannin (100 nM, PI3K inhibitor), or GDC-0941 (1 μM, PI3K inhibitor). Akt-pT308, TSC2-pT1462, p70-S6K-pT389, and eIF2α-pS51 were monitored by immunoblot. Data represent three biological replicates. (B) Quantification of data shown in (A). Akt-pT308, TSC2-pT1462, and p70-S6K-pT389 levels were compared between carrier and wortmannin as well as carrier and GDC-0941-treated cells using a two-tailed t test across three biological replicates. Data represent the mean ± SEM. *P ≤ 0.05; **P ≤ 0.01; ***P ≤ 0.001. (C) PDK1 mediates stress activation of mTORC1. MCF-7 cells were serum-starved and treated with arsenite in the presence of carrier (DMSO) or GSK2334470 (1 μM, PDK1 inhibitor). Akt-pT308, p70-S6K-pT389, and eIF2α-pS51 were monitored by immunoblot. Data represent three biological replicates. (D) Quantification of data shown in (C). Akt-pT308 and p70-S6K-pT389 levels were compared between carrier and GSK2334470-treated cells using a two-way ANOVA followed by a Bonferroni multiple comparison test across three biological replicates. Data represent the mean ± SEM. P-values for the Bonferroni multiple comparison tests are shown above the columns. *P ≤ 0.05; ***P ≤ 0.001. (E) Stress activation of mTORC1 is IRS1 independent. MCF-7 cells treated with non-targeting scramble siRNA (siControl) or with two different siRNA sequences targeting IRS1 (siIRS1 #1 and #2) were serum-starved and treated with arsenite. Akt-pT308, p70-S6K-pT389, and eIF2α-pS51 were monitored by immunoblot. Data represent four biological replicates. (F) Quantification of data shown in (E). IRS1, Akt-pT308, and p70-S6K-pT389 levels were compared between siControl, siIRS1 #1–, and siIRS2 #2–treated cells using a two-way ANOVA followed by a Bonferroni multiple comparison test across four biological replicates. Data represent the mean ± SEM. P-values for the Bonferroni multiple comparison tests are depicted above the corresponding time point. ns, not significant; *P ≤ 0.05; **P ≤ 0.01; ***P ≤ 0.001. (G) Stress activates RAS. MCF-7 cells were serum-starved and treated with arsenite. RAS activity was measured using GST-coupled RAF-RAS–binding domain pull down experiments. Data represent three biological replicates. (H) Quantification of data shown in (G). RAS-GTP levels were compared over an arsenite time course using a one-way ANOVA followed by a Bonferroni multiple comparison test across three biological replicates. Data represent the mean ± SEM. The significances for the Bonferroni multiple comparison tests between time points is shown above the column, the P-value for the ANOVA is P = 0.0318. *P ≤ 0.05. (I) PI3K inhibition reduces stress granule numbers. MCF-7 cells were serum-starved and treated with arsenite for 30 min in the presence of carrier (DMSO) or wortmannin (100 nM, PI3K inhibitor). Stress granules were visualized by immunofluorescence staining of G3BP1. Nuclei were visualized with Hoechst 33342. Data represent four biological replicates. White square indicates region of insert and blue arrow highlights stress granules; scale bar 10 μm. (J) Quantification of data shown in (I): number of stress granules (SGs) per cell (normalized to the arsenite condition) across four biological replicates. A two-tailed t test across four biological replicates was applied. Data represent the mean ± SEM. **P ≤ 0.01; ***P ≤ 0.001.
Figure S2.
Figure S2.. Dynamic mTOR model.
(A) Scheme summarizing the mTOR pathway. Amino acids directly activate mTORC1, which targets PRAS40-pS183, p70-S6K-pT389, and 4E-BP1-pT37/46. The insulin signal is transduced via the IR. The IR phosphorylates and recruits IRS1 which in turn recruits and activates PI3K. PI3K promotes the translocation of PDK1 to the membrane, where PDK1 phosphorylates Akt-pT308. Akt phosphorylates and inhibits the endogenous mTORC1 inhibitors PRAS40 at T246 and TSC2 at T1462. Thus, Akt activates mTORC1. p70-S6K inhibits IRS1 by direct phosphorylation at S636/639. PI3K also activates mTORC2, which targets Akt-pS473. In this study, we show that upon stress, mTORC1 is activated via the PI3K axis to promote stress granule assembly. (B) Topology of model I without stress input (Supplemental Data 1). Brown squares = species included in the model, circles = species variants (P, phosphorylation at the indicated site; cyt, cytosolic localization; mem, cell membrane localization; and *, active state), dark brown = observable species, species in ellipses = possible inputs to the model (insulin and amino acids) and inhibitory agents (MK-2206 and wortmannin), dark blue lines = mTORC2 activity, and light blue lines = mTORC1 activity. (C) Wortmannin fully inhibits PI3K (100%) in MCF-7 cells upon arsenite treatment. Akt-T308 phosphorylation (data shown in Fig S3A) was used to calculate the extent of PI3K inhibition upon wortmannin treatment. A one-way ANOVA was used to calculate P-values of Akt-T308 phosphorylation upon arsenite and arsenite + wortmannin treatment. As under wortmannin treatment, there was no significant induction of Akt-pT308 (P = 0.3226); the extent of inhibition for wortmannin was set to 100%. (D) MK-2206 partially inhibits Akt (83%) in MCF-7 cells upon arsenite treatment. TSC2-T1462 phosphorylation (data shown in Fig S3C) was used as to calculate the extent of Akt inhibition upon MK-2206 treatment. A one-way ANOVA was used to calculate P-values of TSC2-1462 phosphorylation upon arsenite treatment and arsenite + MK-2206 treatment. As under MK-2206 treatment, there was still a significant induction of TSC2-pT1462 (P = 0.0239), the extent of inhibition for MK-2206 was calculated by comparing the slopes of induction curves (83%) between carrier and MK-2206 treatment (indicated as red lines). (E) Summary of the extent of inhibition for wortmannin and MK-2206 in MCF-7 cells under arsenite treatment.
Figure S3.
Figure S3.. Perturbation datasets used for model parameterization.
(A) Arsenite time course in the presence of wortmannin. MCF-7 cells were serum-starved and treated with arsenite in the presence of carrier (DMSO) or wortmannin (100 nM, PI3K inhibitor). The mTOR network was monitored by immunoblot. All data represent three biological replicates, except for IRS1-pS636/639 (two biological replicates). (B) Quantification of data shown in (A). Data represent the mean ± SEM. The indicated phosphorylation time courses were compared between carrier (DMSO) and wortmannin treated cells using a two-way ANOVA. P-values of the ANOVA are depicted above the curves. (C) Arsenite time course in the presence of MK-2206. MCF-7 cells were serum-starved and treated with arsenite in the presence of carrier (DMSO) or MK-2206 (1 μM, Akt inhibitor). The mTOR network was monitored by immunoblot. Data represent three to four biological replicates. The number of biological replicates per readout is detailed in Supplemental Data 7. (D) Quantification of data shown in (C). Data represent the mean ± SEM. The indicated phosphorylation time courses were compared between carrier (DMSO) and MK-2206-treated cells using a two-way ANOVA P-values of the ANOVA are depicted above the curves.
Figure S4.
Figure S4.. Model simulations using model I with no additional stress input.
(A) Simulations of stress induction using model I. Dots represent the experimental data (Fig S1C and D), shown as mean ± SEM. Lines correspond to simulated time courses. (B) Simulations of stress induction and MK-2206 perturbation using model I. Dots represent the experimental data (Fig S3C and D), shown as mean ± SEM. Lines represent simulated time courses. The simulation of arsenite stress only (blue) is calibrated on the experimental data shown in Fig S1C and D and identical to lines shown in (A). The simulation of arsenite + MK-2206 (gray) is calibrated on the experimental data shown in Fig S3C and D. (C) Simulations of stress induction and wortmannin perturbation using model I. Dots represent the experimental data (Fig S3A and B), shown as mean ± SEM. Lines represent simulated time courses. The simulation of arsenite stress only (blue) is calibrated on the experimental data shown in Fig S1C and D and identical to lines shown in (A). The simulation of arsenite + wortmannin (orange) is calibrated on the experimental data shown in Fig S3A and B.
Figure 3.
Figure 3.. Computational model predicts three stress inputs on PI3K, Akt, and mTORC1.
(A) Scheme of model II, with only one stress input on PI3K (Fig S5). The corresponding AIC value is indicated at the top. (B) Simulated response of Akt-pT308, Akt-pS473, and p70-S6K-pT389 to arsenite stress in a system without (blue) or with (orange) wortmannin (PI3K perturbation) using model II, with one stress input on PI3K. Blue dots represent experimental data from arsenite time course (Fig S1C and D) and orange dots represent experimental data from arsenite time course + PI3K perturbation (Fig S3A and B). Lines represent computational simulation. Data represent the mean ± SEM. Simulations of all used observables are shown in Fig S6. (C) Scheme of model III, with two stress inputs on PI3K and Akt-pS473 (Fig S7). The corresponding AIC value is indicated at the top. (D) Simulated response of Akt-pT308, Akt-pS473, and p70-S6K-pT389 to arsenite stress in a system without (blue) or with (orange) wortmannin (PI3K perturbation) using model III, with two stress inputs on PI3K and Akt-pS473. Dots represent experimental data and lines represent computational simulation as described in (B). Data represent the mean ± SEM. Simulations of all used observables are shown in Fig S8. (E) Scheme of model V, with three stress inputs on PI3K, Akt-pS473, and mTORC1 (Fig S11). The corresponding AIC value is indicated at the top. (F) Simulated response of Akt-pT308, Akt-pS473, and p70-S6K-pT389 to arsenite stress in a system without (blue) or with (orange) wortmannin (PI3K perturbation) using model V, with three stress inputs on PI3K, Akt-pS473, and mTORC1. Dots represent experimental data and lines represent computational simulation as described in (B). Data represent the mean ± SEM. Simulations of all used observables are shown in Fig S12.
Figure S5.
Figure S5.. Topology of model II, with a stress input on PI3K.
Topology of model II having a stress input on PI3K (Supplemental Data 2). Brown squares = species included in the model, circles = species variants (P, phosphorylation at the indicated site; cyt, cytosolic localization; mem, cell membrane localization; and *, active state), dark brown = observable species, species in ellipses = possible inputs to the model (insulin and amino acids) and inhibitory agents (MK-2206 and wortmannin), dark blue lines = mTORC2 activity, and light blue lines = mTORC1 activity.
Figure S6.
Figure S6.. Model simulations using model II, with a stress input on PI3K.
(A) Simulations of stress induction using model II. Dots represent the experimental data (Fig S1C and D), shown as mean ± SEM. Lines correspond to simulated time courses. (B) Simulations of stress induction and MK-2206 perturbation using model II. Dots represent the experimental data (Fig S3C and D), shown as mean ± SEM. Lines represent simulated time courses. The simulation of arsenite stress only (blue) is calibrated on the experimental data shown in Fig S1C and D and identical to lines shown in (A). The simulation of arsenite + MK-2206 (gray) is calibrated on the experimental data shown in Fig S3C and D. (C) Simulations of stress induction and wortmannin perturbation using model II. Dots represent the experimental data (Fig S3A and B), shown as mean ± SEM. Lines represent simulated time courses. The simulation of arsenite stress only (blue) is calibrated on the experimental data shown in Fig S1C and D and identical to lines shown in (A). The simulation of arsenite + wortmannin (orange) is calibrated on the experimental data shown in Fig S3A and B.
Figure S7.
Figure S7.. Topology of model III, with stress inputs on PI3K and Akt-pS473.
Topology of the model III, having stress inputs on PI3K and Akt-pS473 (Supplemental Data 3). Brown squares = species included in the model, circles = species variants (P, phosphorylation at the indicated site; cyt, cytosolic localization; mem, cell membrane localization; and *, active state), dark brown = observable species, species in ellipses = possible inputs to the model (insulin and amino acids) and inhibitory agents (MK-2206 and wortmannin), dark blue lines = mTORC2 activity, and light blue lines = mTORC1 activity.
Figure S8.
Figure S8.. Model simulations using model III, with stress inputs on PI3K and Akt-pS473.
(A) Simulations of stress induction using model III. Dots represent the experimental data (Fig S1C and D), shown as mean ± SEM. Lines correspond to simulated time courses. (B) Simulations of stress induction and MK-2206 perturbation using model III. Dots represent the experimental data (Fig S3C and D), shown as mean ± SEM. Lines represent simulated time courses. The simulation of arsenite stress only (blue) is calibrated on the experimental data shown in Fig S1C and D and identical to lines shown in (A). The simulation of arsenite + MK-2206 (gray) is calibrated on the experimental data shown in Fig S3C and D. (C) Simulations of stress induction and wortmannin perturbation using model III. Dots represent the experimental data (Fig S3A and B), shown as mean ± SEM. Lines represent simulated time courses. The simulation of arsenite stress only (blue) is calibrated on the experimental data shown in Fig S1C and D and identical to lines shown in (A). The simulation of arsenite + wortmannin (orange) is calibrated on the experimental data shown in Fig S3A and B.
Figure S9.
Figure S9.. Topology of model IV, with stress inputs on PI3K and Akt-pS473, but Akt-pS473 alone cannot activate mTORC1.
Topology of model IV, having stress inputs on PI3K and Akt-pS473, but Akt-pS473 alone cannot activate mTORC1 (Supplemental Data 4). Only Akt-pT308 and Akt-pT308 + Akt-pS473 can activate mTORC1. Brown squares = species included in the model, circles = species variants (P, phosphorylation at the indicated site; cyt, cytosolic localization; mem, cell membrane localization; and *, active state), dark brown = observable species, species in ellipses = possible inputs to the model (insulin and amino acids) and inhibitory agents (MK-2206 and wortmannin), dark blue lines = mTORC2 activity, and light blue lines = mTORC1 activity.
Figure S10.
Figure S10.. Model simulations using model IV, with stress inputs on PI3K and Akt-pS473, but Akt-pS473 alone cannot active mTORC1.
(A) Simulations of stress induction using model IV. Dots represent the experimental data (Fig S1C and D), shown as mean ± SEM. Lines correspond to simulated time courses. (B) Simulations of stress induction and MK-2206 perturbation using model IV. Dots represent the experimental data (Fig S3C and D), shown as mean ± SEM. Lines represent simulated time courses. The simulation of arsenite stress only (blue) is calibrated on the experimental data shown in Fig S1C and D and identical to lines shown in (A). The simulation of arsenite + MK-2206 (gray) is calibrated on the experimental data shown in Fig S3C and D. (C) Simulations of stress induction and wortmannin perturbation using model IV. Dots represent the experimental data (Fig S3A and B), shown as mean ± SEM. Lines represent simulated time courses. The simulation of arsenite stress only (blue) is calibrated on the experimental data shown in Fig S1C and D and identical to lines shown in (A). The simulation of arsenite + wortmannin (orange) is calibrated on the experimental data shown in Fig S3A and B.
Figure S11.
Figure S11.. Topology of model V with stress inputs on PI3K, Akt-pS473, and mTORC1.
Topology of model V, having stress inputs on PI3K, Akt-pS473, and mTORC1 (Supplemental Data 5). Brown squares = species included in the model, circles = species variants (P, phosphorylation at the indicated site; cyt, cytosolic localization; mem, cell membrane localization; and *, active state), dark brown = observable species, species in ellipses = possible inputs to the model (insulin and amino acids) and inhibitory agents (MK-2206 and wortmannin), dark blue lines = mTORC2 activity, and light blue lines = mTORC1 activity.
Figure S12.
Figure S12.. Model simulations using model V, with stress inputs on PI3K, Akt-pS473 and mTORC1.
(A) Simulations of stress induction using model V. Dots represent the experimental data (Fig S1C and D), shown as mean ± SEM. Lines correspond to simulated time courses. (B) Simulations of stress induction and MK-2206 perturbation using model V. Dots represent the experimental data (Fig S3C and D), shown as mean ± SEM. Lines represent simulated time courses. The simulation of arsenite stress only (blue) is calibrated on the experimental data shown in Fig S1C and D and identical to lines shown in (A). The simulation of arsenite + MK-2206 (gray) is calibrated on the experimental data shown in Fig S3C and D. (C) Simulations of stress induction and wortmannin perturbation using model V. Dots represent the experimental data (Fig S3A and B), shown as mean ± SEM. Lines represent simulated time courses. The simulation of arsenite stress only (blue) is calibrated on the experimental data shown in Fig S1C and D and identical to lines shown in (A). The simulation of arsenite + wortmannin (orange) is calibrated on the experimental data shown in Fig S3A and B.
Figure 4.
Figure 4.. Stress promotes Akt-S473 phosphorylation via the p38-MK2 axis when PI3K is inactive.
(A) mTORC1 stress activation is not mediated via Akt when PI3K is inactive. MCF-7 cells were serum-starved and treated with arsenite in the presence of carrier (DMSO) or wortmannin (100 nM, PI3K inhibitor) in cells treated with non-targeting scramble siRNA (siControl) or with siRNA-pools targeting Akt1 and Akt2. Akt1, Akt2, Akt-pT308, Akt-pS473, p70-S6K-pT389, and eIF2α-pS51 were monitored by immunoblot. Data represent six biological replicates. (B) Quantification of data shown in (A) when PI3K is active. Akt-pS473 and p70-S6K-pT389 levels were compared between siControl and siAkt1/2-treated cells using a two-way ANOVA followed by a Bonferroni multiple comparison test across six biological replicates. Data represent the mean ± SEM. P-values for the Bonferroni multiple comparison tests are shown above the columns. *P ≤ 0.05; ***P ≤ 0.001. (C) Quantification of data shown in (A) when PI3K is inactive. Akt-pS473 and p70-S6K-pT389 levels were compared between siControl and siAkt1/2-treated cells in the presence of wortmannin using a two-way ANOVA followed by a Bonferroni multiple comparison test across six biological replicates. Data represent the mean ± SEM. P-values for the Bonferroni multiple comparison tests are shown above the columns. ns, not significant; ***P ≤ 0.001. (D) Akt-pS473 is not mediated by mTORC2 when PI3K is inactive. MCF-7 cells were serum-starved and treated with arsenite in the presence of carrier (DMSO) or wortmannin (100 nM, PI3K inhibitor) in siControl versus siRictor-treated cells. Rictor, Akt-pT308, Akt-pS473 p70-S6K-pT389, and eIF2α-pS51 were monitored by immunoblot. Data represent five biological replicates. (E) Quantification of data shown in (D) when PI3K is active. Akt-pS473 and p70-S6K-pT389 were compared between siControl and siRictor using a two-way ANOVA followed by a Bonferroni multiple comparison test across five biological replicates. Data represent the mean ± SEM. The P-values for the Bonferroni multiple comparison tests are shown. **P ≤ 0.01. (F) Quantification of data shown in (D) when PI3K is inactive. Akt-pS473 and p70-S6K-pT389 were compared between siControl and siRictor-treated cells in the presence of wortmannin using a two-way ANOVA followed by a Bonferroni multiple comparison test across five biological replicates. Data represent the mean ± SEM. The P-values for the Bonferroni multiple comparison tests are shown. *P ≤ 0.05. (G) Workflow of text mining approach. (H) List of top 10 identified interaction partners using the text mining approach, including an example sentence (Borodkina et al, 2014). (I) MK2 phosphorylates Akt-S473 when PI3K is inactive. MCF-7 cells were serum-starved and treated with arsenite in the presence of carrier (DMSO) or wortmannin (100 nM, PI3K inhibitor). In addition, the cells were treated with carrier (DMSO) or PF3644022 (1 μM, MK2 inhibitor). Akt-pT308, Akt-pS473, p70-S6K-pT389, and eIF2α-pS51 were monitored by immunoblot. Data represent four biological replicates. (J) Quantification of data shown in (I) when PI3K is active. Akt-pS473 and p70-S6K-pT389 levels were compared between carrier (DMSO) and PF3644022-treated cells using a two-way ANOVA followed by a Bonferroni multiple comparison test across four biological replicates. Data represent the mean ± SEM. The P-values for the Bonferroni multiple comparison tests are shown. (K) Quantification of data shown in (I) when PI3K is inactive. Akt-pS473 and p70-S6K-pT389 levels were compared between wortmannin- and wortmannin + PF3644022–treated cells using a two-way ANOVA followed by a Bonferroni multiple comparison test across four biological replicates. Data represent the mean ± SEM. The P-values for the Bonferroni multiple comparison tests are shown. **P ≤ 0.01. ns, not significant.
Figure S13.
Figure S13.. MK2 phosphorylates Akt at Serine 473 when PI3K is inactive.
(A) Quantification of data shown in Fig 4A when PI3K is active. Akt1, Akt2, and Akt-pT308 levels were compared between siControl and siAkt1/2-treated cells using a two-way ANOVA followed by a Bonferroni multiple comparison test across six biological replicates. Data represent the mean ± SEM. P-values for the Bonferroni multiple comparison tests are shown above the columns. ***P ≤ 0.001. (B) Quantification of data shown in Fig 4A when PI3K is inactive. Akt1 and Akt2 levels were compared between siControl and siAkt1/2-treated cells in the presence of wortmannin using a two-way ANOVA followed by a Bonferroni multiple comparison test across six biological replicates. Data represent the mean ± SEM. P-values for the Bonferroni multiple comparison tests are shown above the columns. ***P ≤ 0.001. (C) Quantification of data shown in Fig 4D when PI3K is active. Rictor levels were compared between siControl and siRictor using a two-way ANOVA followed by a Bonferroni multiple comparison test across five biological replicates. Data represent the mean ± SEM. The P-values for the Bonferroni multiple comparison tests are shown. **P ≤ 0.01; ***P ≤ 0.001. (D) Quantitation of data shown in Fig 4D when PI3K is inactive. Rictor levels were compared between siControl and siRictor in the presence of wortmannin using a two-way ANOVA followed by a Bonferroni multiple comparison test across five biological replicates. Data represent the mean ± SEM. The P-values for the Bonferroni multiple comparison tests are shown. **P ≤ 0.01. (E) Akt-S473 stress phosphorylation is mTOR independent when PI3K is inactive. MCF-7 cells were serum-starved and treated with arsenite in the presence of carrier (DMSO) or wortmannin (100 nM, PI3K inhibitor). In addition, the cells were treated with carrier (DMSO) or with Torin1 (100 nM, mTOR inhibitor). Akt-pT308, Akt-pS473, p70-S6K-pT389, and eIF2a-pS51 were monitored by immunoblot. Data represent three biological replicates. (F) Quantification of data shown in (E) when PI3K is active. Akt-pS473 levels were compared between carrier (DMSO) and Torin1-treated cells using a two-way ANOVA followed by a Bonferroni multiple comparison test across three biological replicates. Data represent the mean ± SEM. The P-values for the Bonferroni multiple comparison tests are shown. ***P ≤ 0.001. (G) Quantification of data shown in (E) when PI3K is inactive. Akt-pS473 levels were compared between wortmannin- and wortmannin + Torin1–treated cells using a two-way ANOVA followed by a Bonferroni multiple comparison test across three biological replicates. Data represent the mean ± SEM. The P-values for the Bonferroni multiple comparison tests are shown. (H) List of all the PDK2s for Akt used in the text mining approach (Fig 4G), including their protein name and human Uniprot ID. The PubMed IDs of the studies where these candidates were shown to phosphorylate Akt-S473 are included. (I) MK2 phosphorylates Akt-S473 upon stress. MCF-7 cells were serum-starved and treated with arsenite in the presence of carrier (DMSO) or wortmannin (100 nM, PI3K inhibitor) in cells treated with non-targeting scramble siRNA (siControl) or with a siRNA-pool targeting MK2 (siMK2). MK2, Akt-pT308, Akt-pS473, p70-S6K-pT389, and eIF2a-pS51 were monitored by immunoblot. Data represent four biological replicates. (J) Quantification of data shown in (I) when PI3K is active. MK2, Akt-pS473, and p70-S6K-pT389 levels were compared between siControl and siMK2-treated cells using a two-way ANOVA followed by a Bonferroni multiple comparison test across four biological replicates. Data represent the mean ± SEM. The P-values for the Bonferroni multiple comparison tests are shown. ***P ≤ 0.001. (K) Quantification of data shown in (I) when PI3K is inactive. MK2, Akt-pS473, and p70-S6K-pT389 levels were compared between wortmannin- and wortmannin + siMK2–treated cells using a two-way ANOVA followed by a Bonferroni multiple comparison test across four biological replicates. Data represent the mean ± SEM. The P-values for the Bonferroni multiple comparison tests are shown. *P ≤ 0.05; **P ≤ 0.01; ***P ≤ 0.001. (L) When PI3K activity declines, p38 drives mTORC1 activity. MCF-7 cells were serum-starved and treated with arsenite for 60 min upon different concentrations of wortmannin (as indicated, PI3K inhibitor) in carrier (DMSO) versus LY2228820 (1 mM, p38 inhibitor)-treated cells. The relative effects of LY2228820 treatment on p70-S6K-pT389 levels were calculated separately for each wortmannin concentration. Data represent five biological replicates. ns, not significant.
Figure 5.
Figure 5.. p38 promotes mTORC1 activation and stress granule formation when PI3K is inactive.
(A) p38 mediates mTORC1 activation when PI3K is inactive. MCF-7 cells were serum-starved and treated with arsenite in the presence of carrier (DMSO) or wortmannin (100 nM, PI3K inhibitor). In addition, the cells were treated with carrier (DMSO) versus LY2228820 (1 μM, p38 inhibitor). MK2-pT334, Akt-pT308, Akt-pS473, p70-S6K-pT389, and eIF2α-pS51 were monitored by immunoblot. Data represent five biological replicates. (B) Quantification of data shown in (A) when PI3K is active. Akt-pS473 and p70-S6K-pT389 were compared between carrier (DMSO) and LY2228820-treated cells using a two-way ANOVA followed by a Bonferroni multiple comparison test across five biological replicates. Data represent the mean ± SEM. The P-values for the Bonferroni multiple comparison tests are shown. ***P ≤ 0.001. (C) Quantification of data shown in (A) when PI3K is inactive. Akt-pS473 and p70-S6K-pT389 were compared between wortmannin- and wortmannin + LY2228820–treated cells using a two-way ANOVA followed by a Bonferroni multiple comparison test across five biological replicates. Data represent the mean ± SEM. The P-values for the Bonferroni multiple comparison tests are shown. *P ≤ 0.05; ***P ≤ 0.001. (D) p38 drives mTORC1 activity when PI3K is inactive. Quantification of data shown in Fig S14A. 4E-BP1-pT37/46 relative intensity was normalized separately for conditions without or with wortmannin. Significance of 4E-BP1-pT37/46 inhibition by LY2228820 was tested using a two-tailed t test across five biological replicates. Data represent the mean ± SEM. *P ≤ 0.05. (E) Prediction on the extent of mTORC1 inhibition upon LY2228820 treatment when PI3K is active or inactive. Prediction was performed with model V. The red lines depict the time points measured experimentally (Fig 5A–C). (F) When PI3K activity declines, p38 drives mTORC1 activity. Quantification of data shown in Fig S13L. MCF-7 cells were serum-starved and treated with arsenite for 60 min in the presence of different concentrations of wortmannin (as indicated, PI3K inhibitor) in carrier (DMSO) versus LY2228820 (1 μM, p38 inhibitor)-treated cells. p70-S6K-pT389 relative intensity was normalized separately for each wortmannin concentration. Significance of p70-S6K-pT389 inhibition by LY2228820 was tested using a two-tailed t test across five biological replicates. Data represent the mean ± SEM. *P ≤ 0.05. (G) p38 drives mTORC1 activity in several cell lines, as PI3K activity declines. Quantification of data shown in Fig S14D–G. MCF-7, CAL51, LN18, HEK293T, and HeLa cells were serum-starved and exposed to arsenite for 60 min in combination with wortmannin (100 nM, PI3K inhibitor) and/or LY2228820 (1 mM, p38 inhibitor). Data represent 3–4 biological replicates (see Fig S14D–G). 4E-BP1-pT37/46 relative intensity was normalized separately for conditions without or with wortmannin. Significance of 4E-BP1-pT37/46 inhibition by LY2228820 was tested using a two-tailed t test across three biological replicates. Data represent the mean ± SEM. *P ≤ 0.05; **P ≤ 0.01. (H) Stress granule numbers upon PI3K and p38 inhibition. MCF-7 cells were serum-starved and treated with arsenite for 30 min in the presence of carrier (DMSO), wortmannin (100 nM, PI3K inhibitor), LY2228820 (1 μM, p38 inhibitor), or wortmannin + LY2228820. Stress granules were visualized by immunofluorescence staining of G3BP1. Nuclei were visualized with Hoechst 33342. Data represent four biological replicates. White square indicates region of insert and blue arrow highlights stress granules; scale bar 10 μm. (I) Quantification of data shown in (H). The number of stress granules (SGs) per cell (normalized to the arsenite condition) across four biological replicates. Stress granule formation between carrier and LY2228820 as well as wortmannin- and wortmannin + LY2228820–treated cells was compared using a two-tailed t test across four biological replicates. Data represent the mean ± SEM. *P ≤ 0.01. ns, not significant.
Figure S14.
Figure S14.. PI3K and p38 control mTORC1 in a hierarchical manner in several cell lines.
(A) When PI3K activity declines, p38 drives 4E-BP1-pT37/46 in MCF-7 cells. MCF-7 cells were serum-starved and treated with arsenite for 60 min upon wortmannin (100 nM, PI3K inhibitor) and/or LY2228820 (1 mM, p38 inhibitor). Data represent five biological replicates. (B) Comparison of the expression of mTORC1 targets. MCF-7, CAL51, LN18, HEK293T, and HeLa cells were serum-starved. p70-S6K and 4E-BP1 were monitored by immunoblot. Data represent three to four biological replicates. (C) Quantification of data shown in (B). p70-S6K and 4E-BP1 levels were compared between cell lines using a two-tailed t test across three to four biological replicates. Data represent the mean ± SEM. (D) When PI3K activity declines, p38 drives 4E-BP1-pT37/46 in CAL51 cells. MCF-7 and CAL51 cells were serum-starved and treated with arsenite for 60 min. For CAL51, the treatment was combined with wortmannin (100 nM, PI3K inhibitor) and/or LY2228820 (1 mM, p38 inhibitor). Data represent four biological replicates. (E) When PI3K activity declines, p38 drives 4E-BP1-pT37/46 in LN18 cells. MCF-7 and LN18 cells were treated as described in (D). Data represent four biological replicates. (F) When PI3K activity declines, p38 drives 4E-BP1-pT37/46 in HEK293T cells. MCF-7 and HEK293T cells were treated as described in (D). Data represent three biological replicates. (G) p38 drives 4E-BP1-pT37/46 in HeLa cells. MCF-7 and HeLa cells were serum-starved and exposed to arsenite for 60 min. For HeLa, the treatment was combined with wortmannin (100 nM, PI3K inhibitor) or LY2228820 (1 mM, p38 inhibitor). Note that in HeLa cells, Akt-pT308 is not arsenite inducible, indicative of low PI3K activity. Data represent three biological replicates.
Figure 6.
Figure 6.. PI3K, p38, and MK2 transduce stress signals to the mTOR network.
(A) Scheme summarizing the stress response of the mTOR network. Three distinct cues mediate stress signals to the mTOR network. (1) Stress activates the RAS-PI3K-PDK1-Akt axis, which in turn activates mTORC1. (2) The p38-MK2 axis signals to Akt-pS473. This stress input does not activate mTORC1. (3) p38 activates mTORC1, independently of PI3K. Stress signaling to mTORC1 is required for stress granule assembly. The inhibitors used in this study are depicted. (B) p38 and mTORC1 activity specifically correlate in breast cancer tissues with low PI3K activity. Analysis of RPPA from breast cancer patients obtained from TCPA. Patients were initially divided by the median of Akt-T308 phosphorylation into two groups of (i) PI3K active and (ii) PI3K inactive. The PI3K active and PI3K inactive groups were further divided by the median of the p38-pT180/Y182 phosphorylation into high p38 and low p38 activity groups. This separated the patients into four groups, namely, (1) PI3K active and p38 high, (2) PI3K active and p38 low, (3) PI3K inactive and p38 high, and (4) PI3K inactive and p38 low. Data represent single measurements. *P ≤ 0.05; **P ≤ 0.01; ***P ≤ 0.001; ****P ≤ 0.0001. ns, not significant.
Figure S15.
Figure S15.. Mathematical details of the mTOR model V.
(A) Species depicted in model V. The sum of different states (e.g., phosphorylation) for each species has been kept constant as indicated by CIndex. (B) Model inputs in model V.
Figure S16.
Figure S16.. Model equations of model V.
The model was set up as a system of ODEs. The substitutions of species are indicated in Fig S15. Specific model and initial concentration parameter values are described in Tables S2 and S3.

References

    1. Alessi DR, James SR, Downes CP, Holmes AB, Gaffney PR, Reese CB, Cohen P (1997) Characterization of a 3-phosphoinositide-dependent protein kinase which phosphorylates and activates protein kinase Balpha. Curr Biol 7: 261–269. 10.1016/s0960-9822(06)00122-9 - DOI - PubMed
    1. Anderson P, Kedersha N, Ivanov P (2015) Stress granules, P-bodies and cancer. Biochim Biophys Acta 1849: 861–870. 10.1016/j.bbagrm.2014.11.009 - DOI - PMC - PubMed
    1. Arcaro A, Wymann MP (1993) Wortmannin is a potent phosphatidylinositol 3-kinase inhibitor: The role of phosphatidylinositol 3,4,5-trisphosphate in neutrophil responses. Biochem J 296: 297–301. 10.1042/bj2960297 - DOI - PMC - PubMed
    1. Arimoto K, Fukuda H, Imajoh-Ohmi S, Saito H, Takekawa M (2008) Formation of stress granules inhibits apoptosis by suppressing stress-responsive MAPK pathways. Nat Cell Biol 10: 1324–1332. 10.1038/ncb1791 - DOI - PubMed
    1. Ben-Levy R, Leighton IA, Doza YN, Attwood P, Morrice N, Marshall CJ, Cohen P (1995) Identification of novel phosphorylation sites required for activation of MAPKAP kinase-2. EMBO J 14: 5920–5930. 10.1002/j.1460-2075.1995.tb00280.x - DOI - PMC - PubMed

Publication types

MeSH terms