. 2019 Mar 29;363(6434):eaau0135.
doi: 10.1126/science.aau0135.

T cell stemness and dysfunction in tumors are triggered by a common mechanism

Affiliations

T cell stemness and dysfunction in tumors are triggered by a common mechanism

Suman Kumar Vodnala et al. Science. .

Abstract

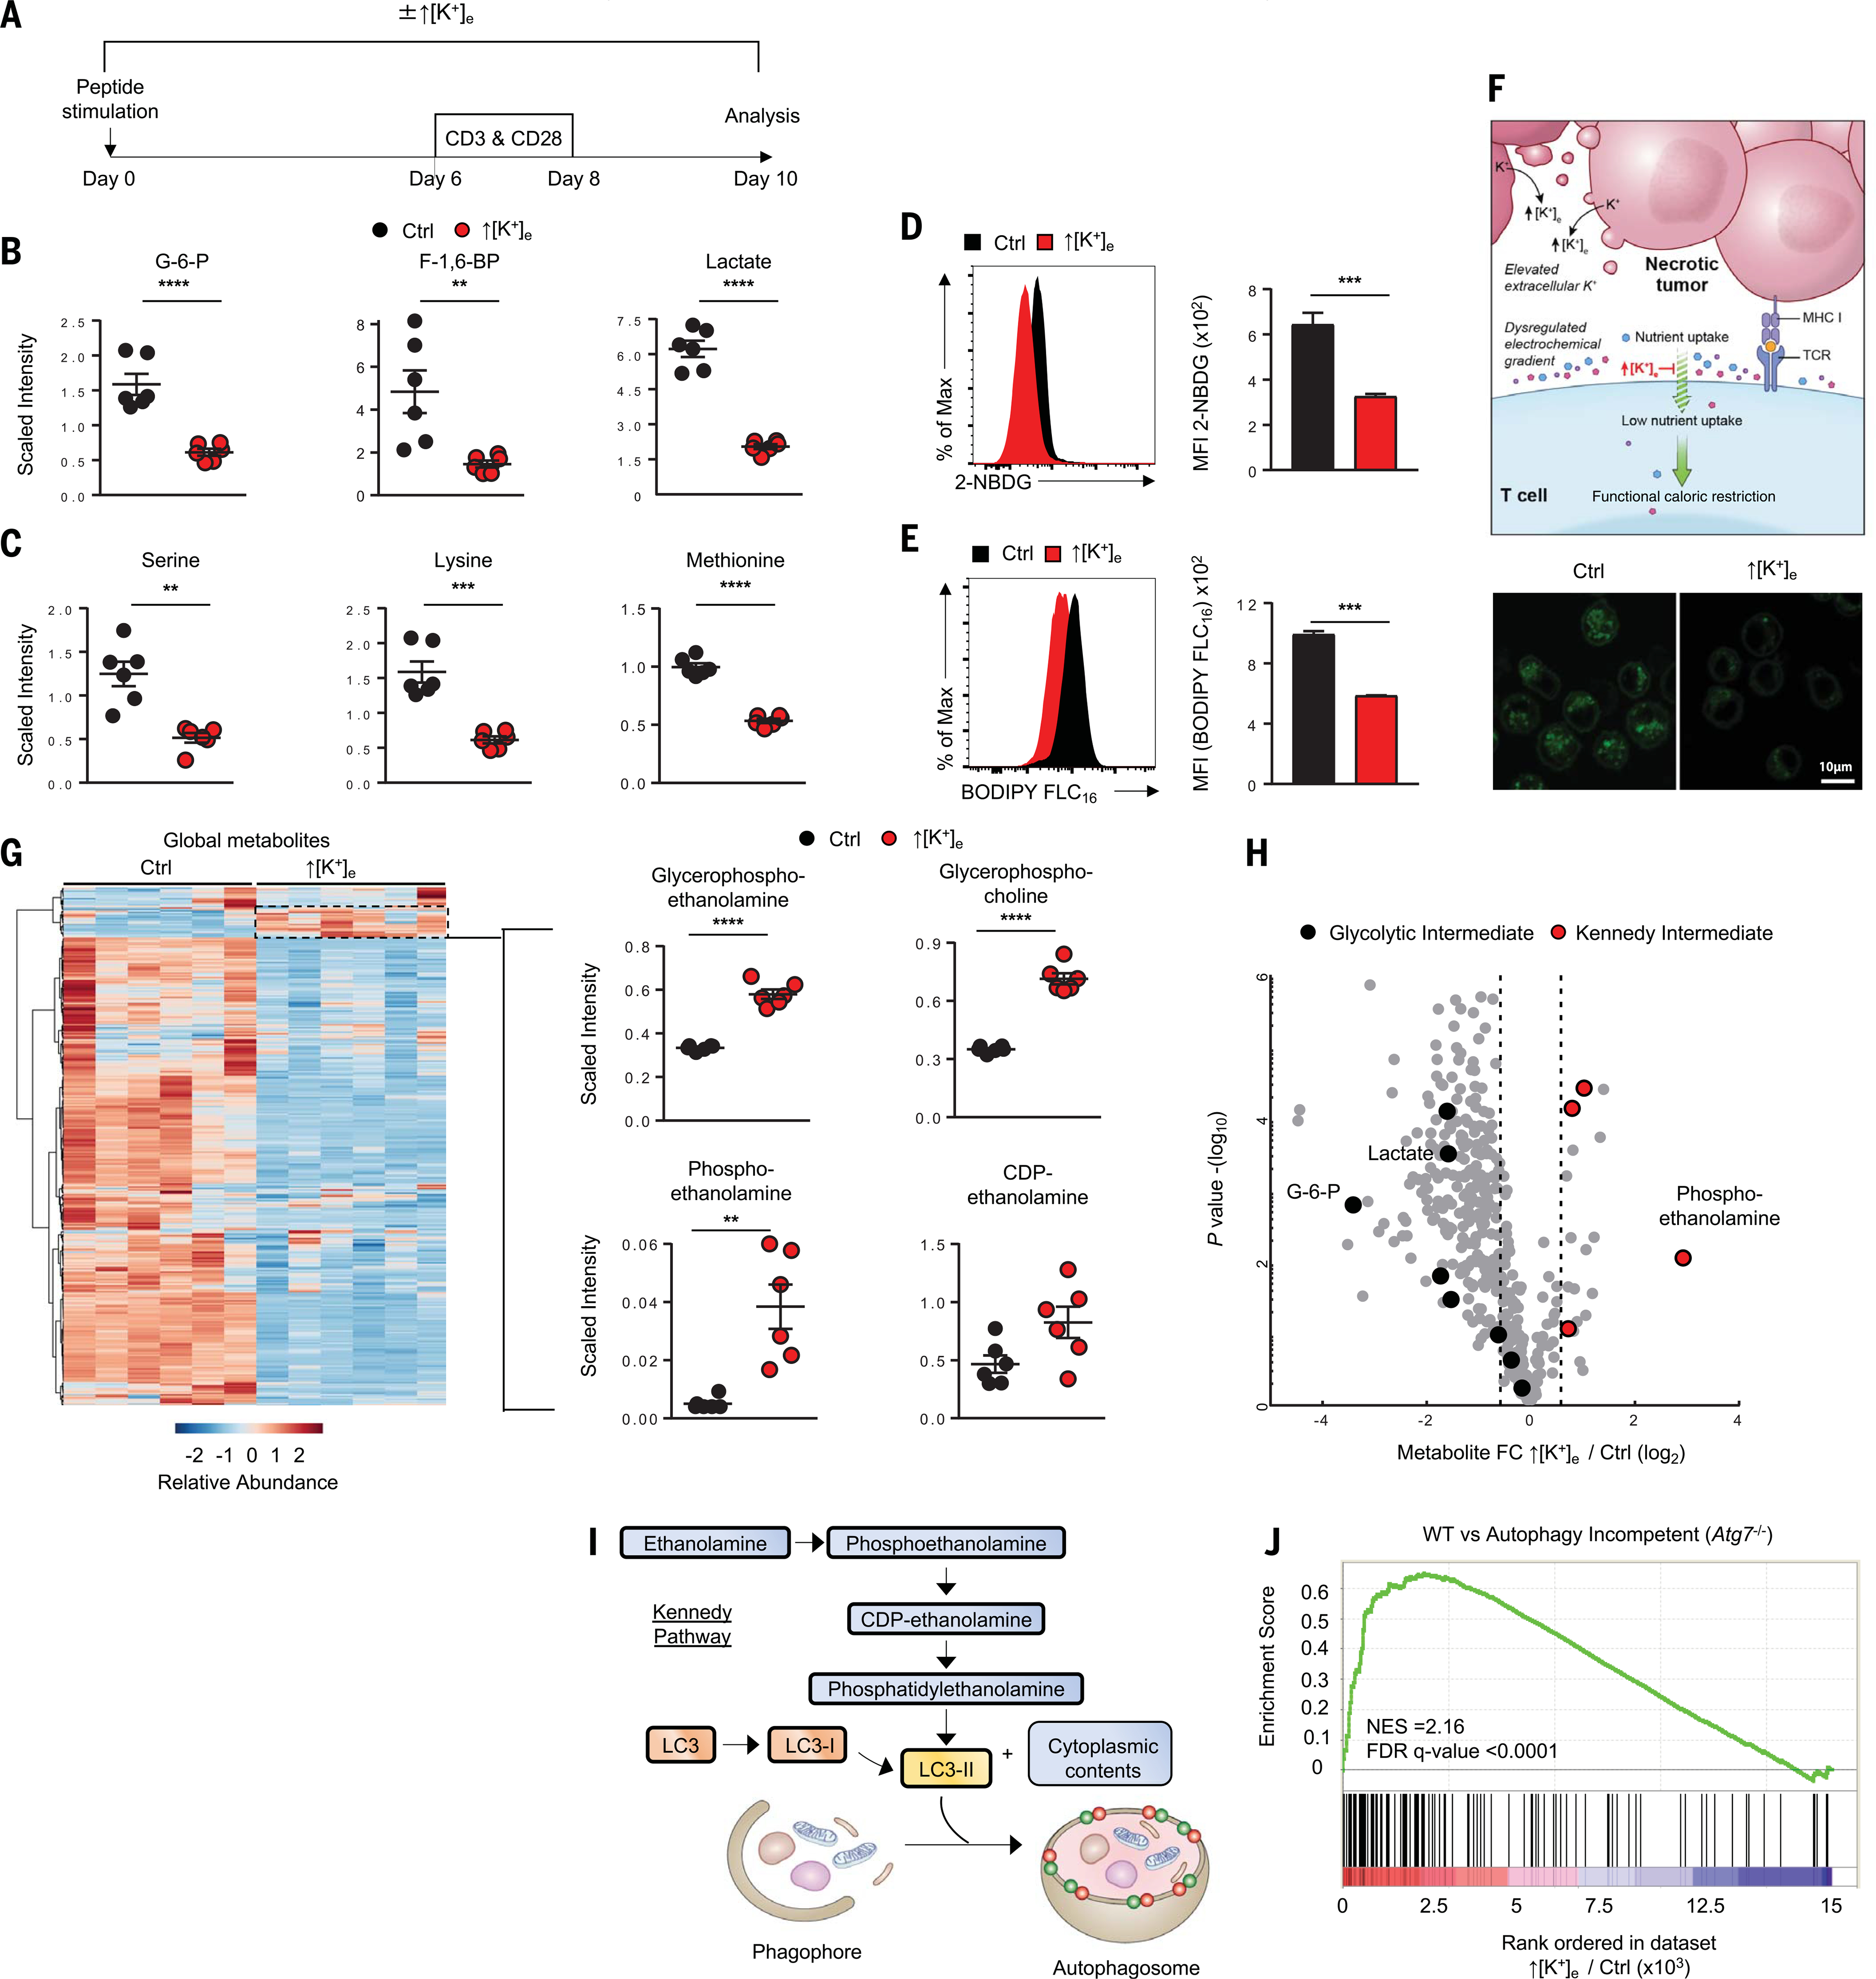
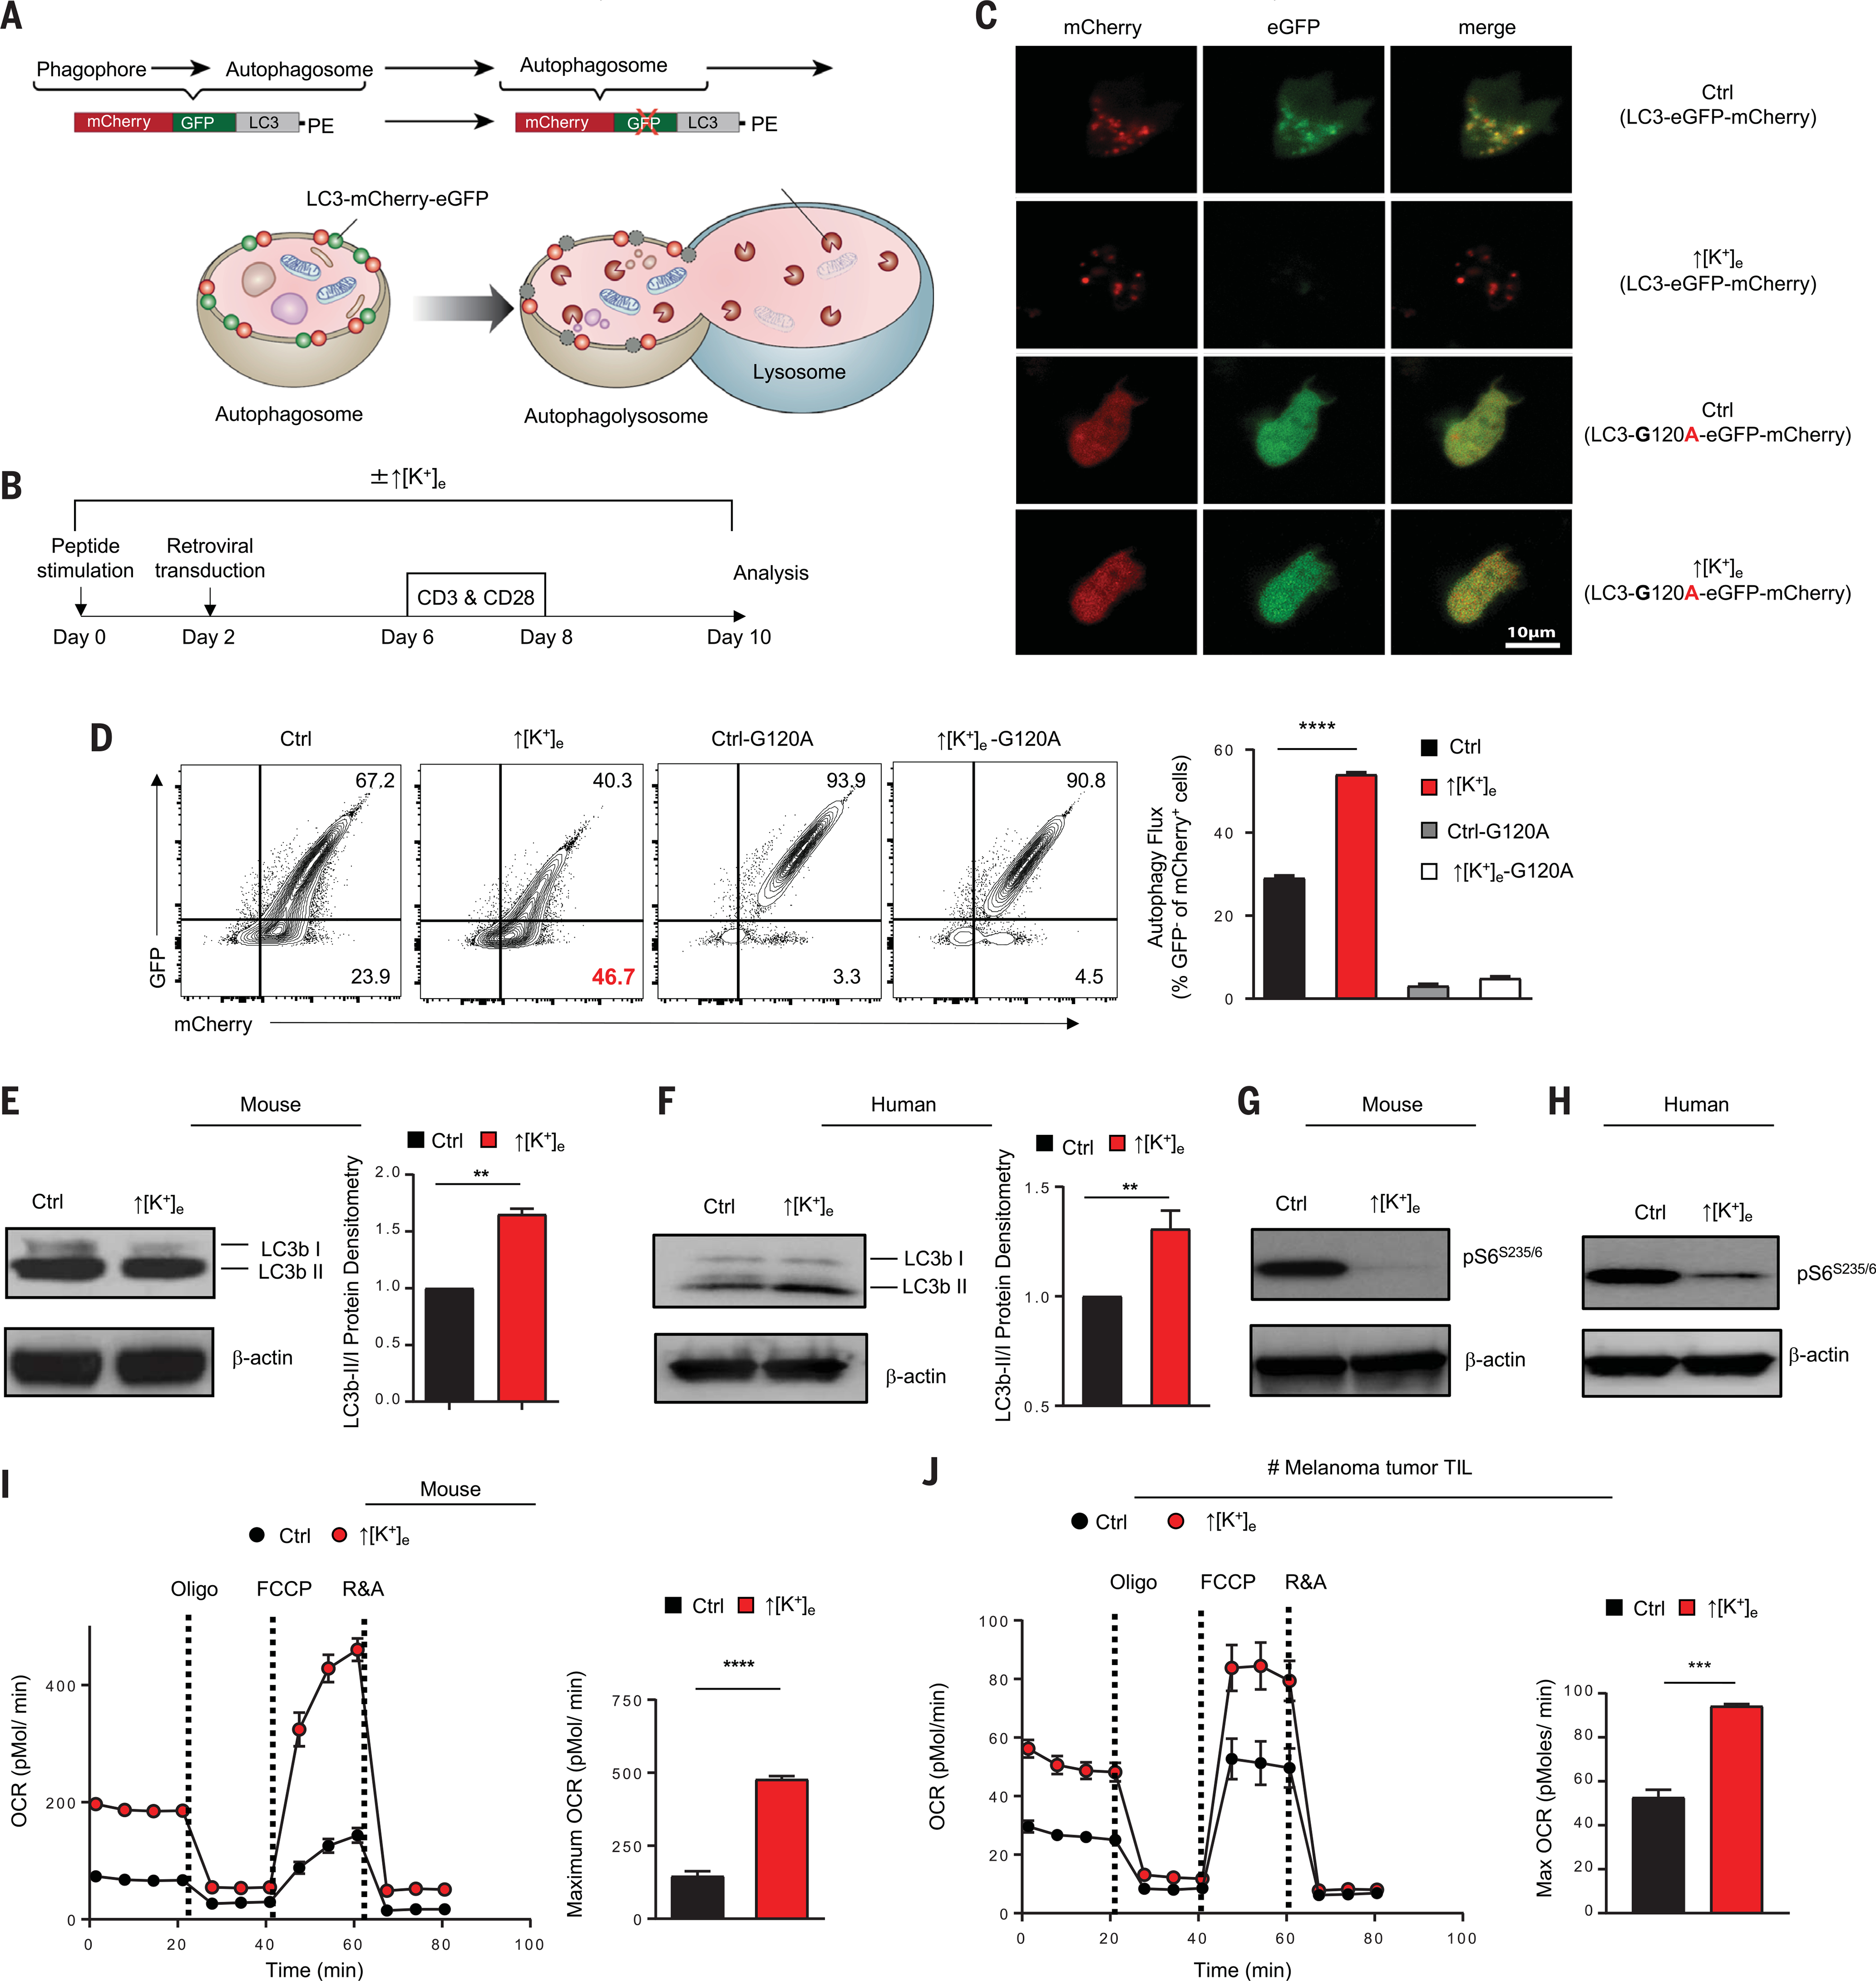
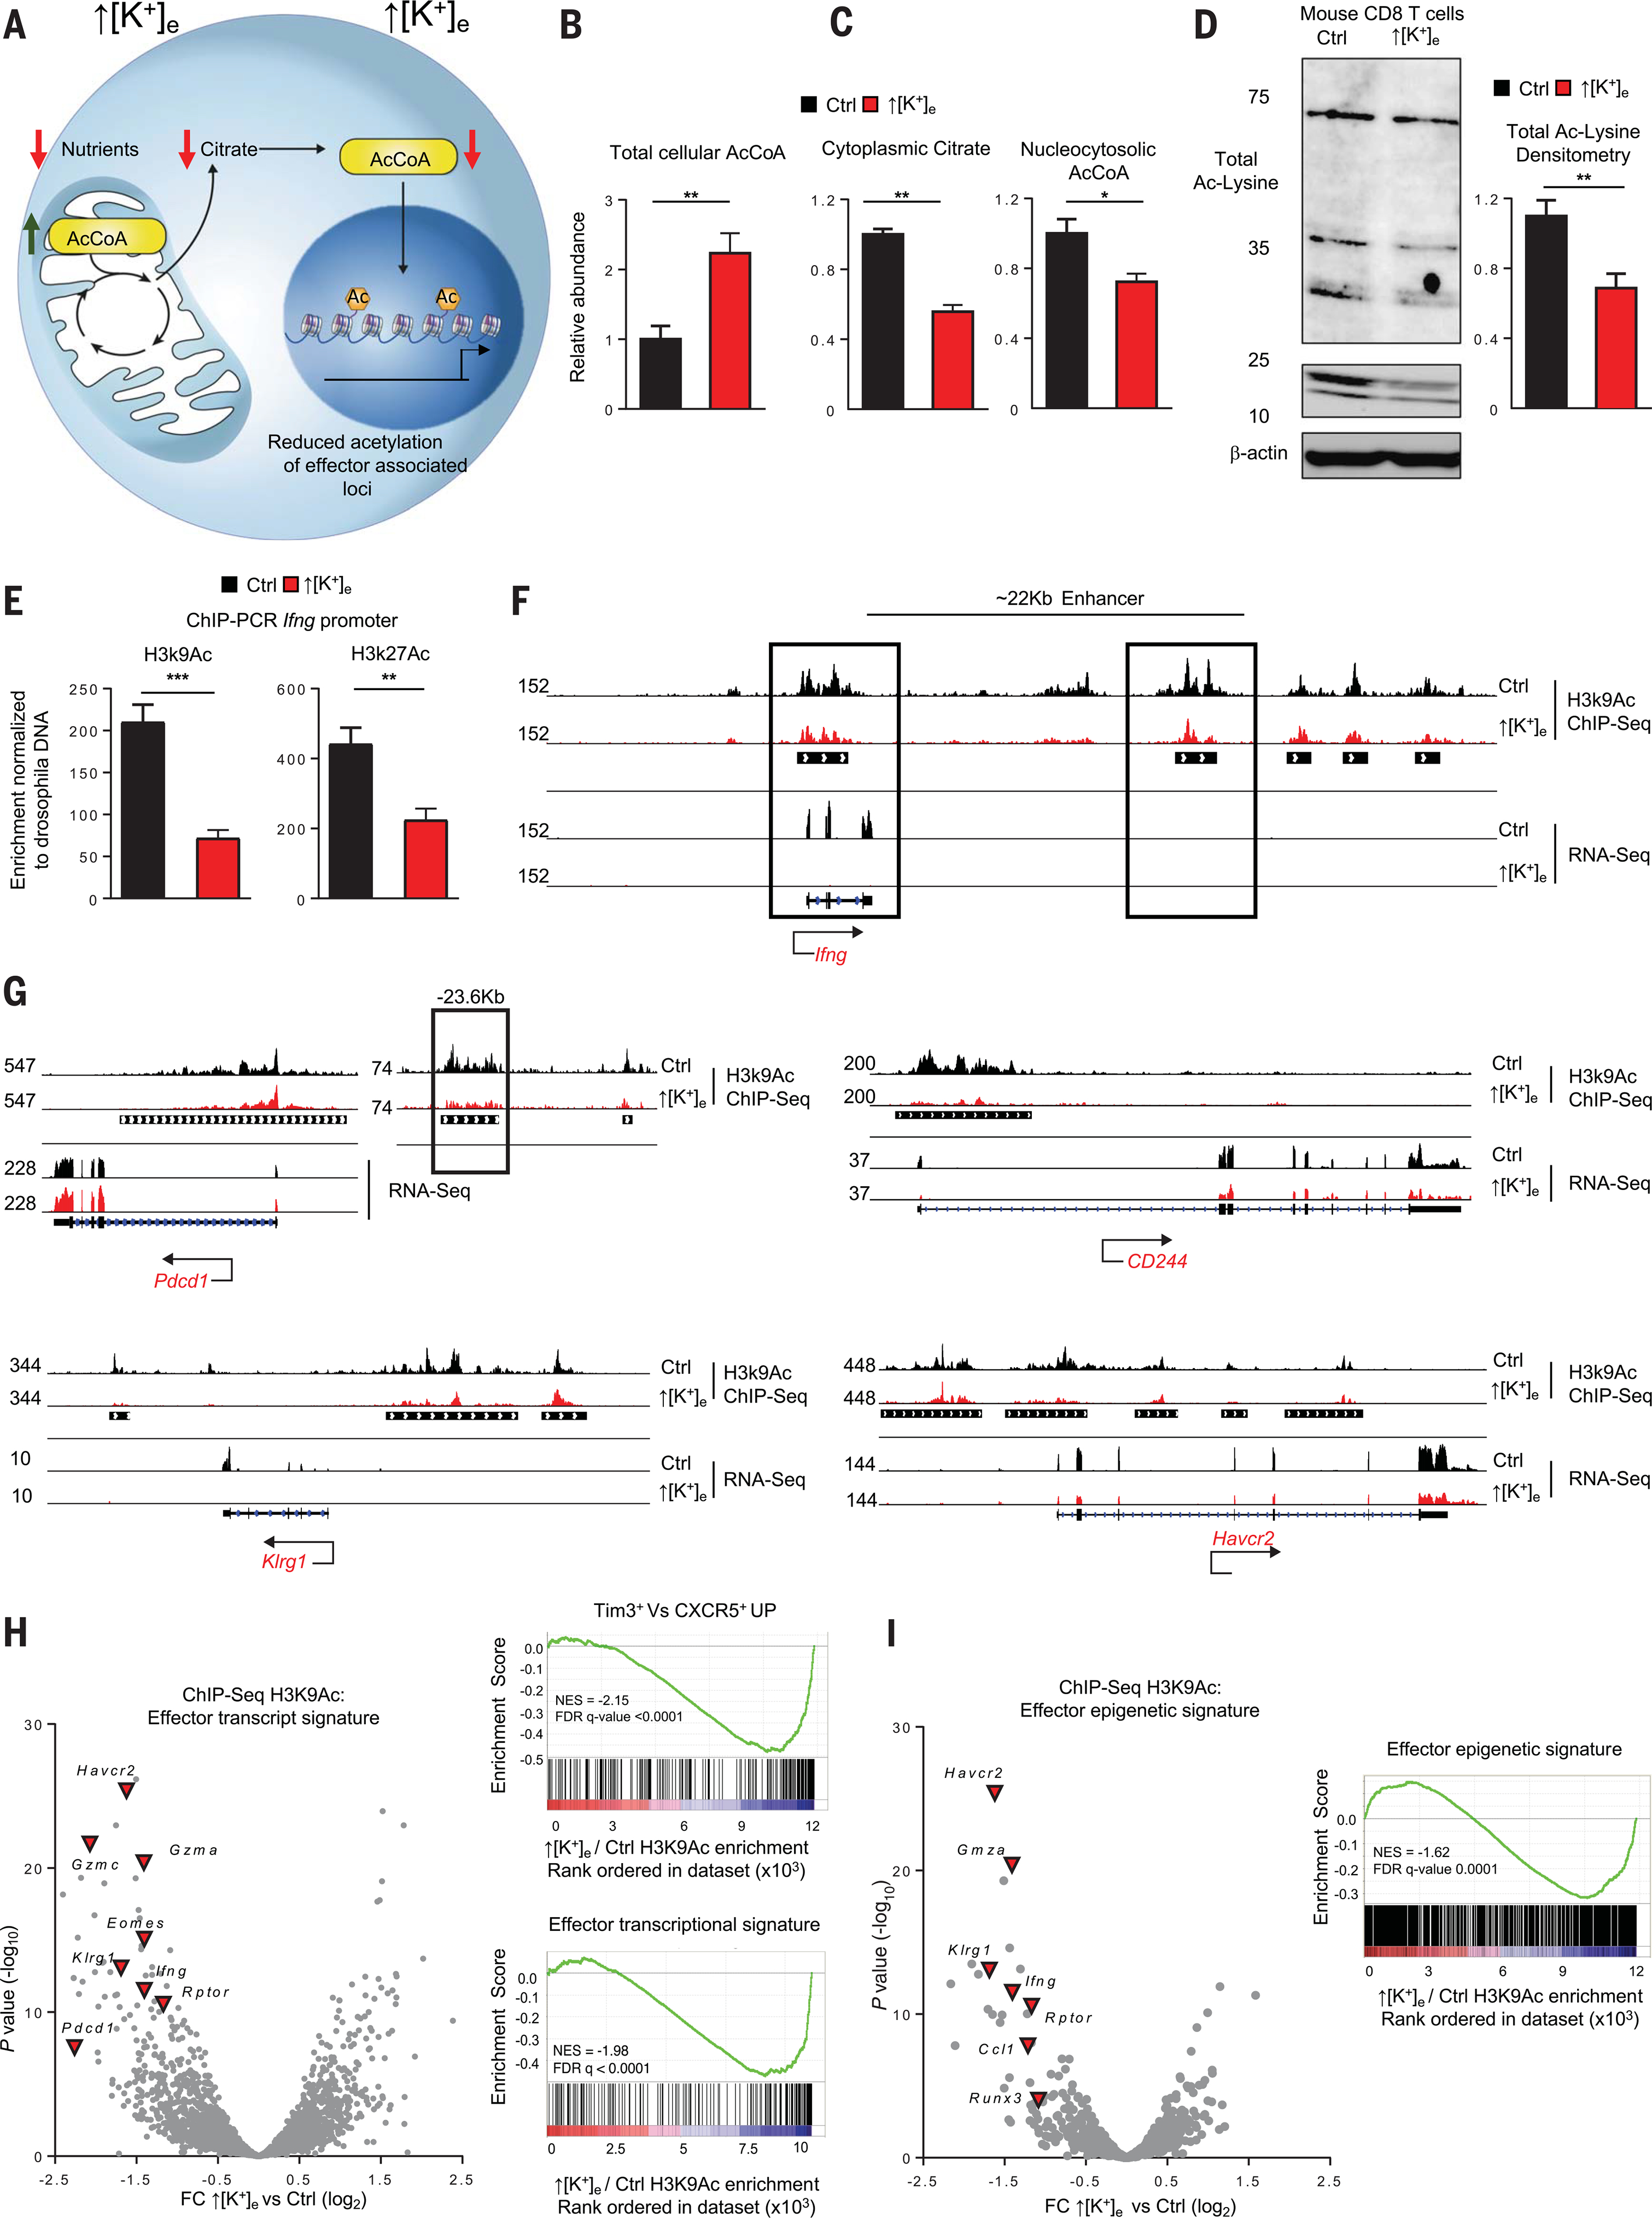
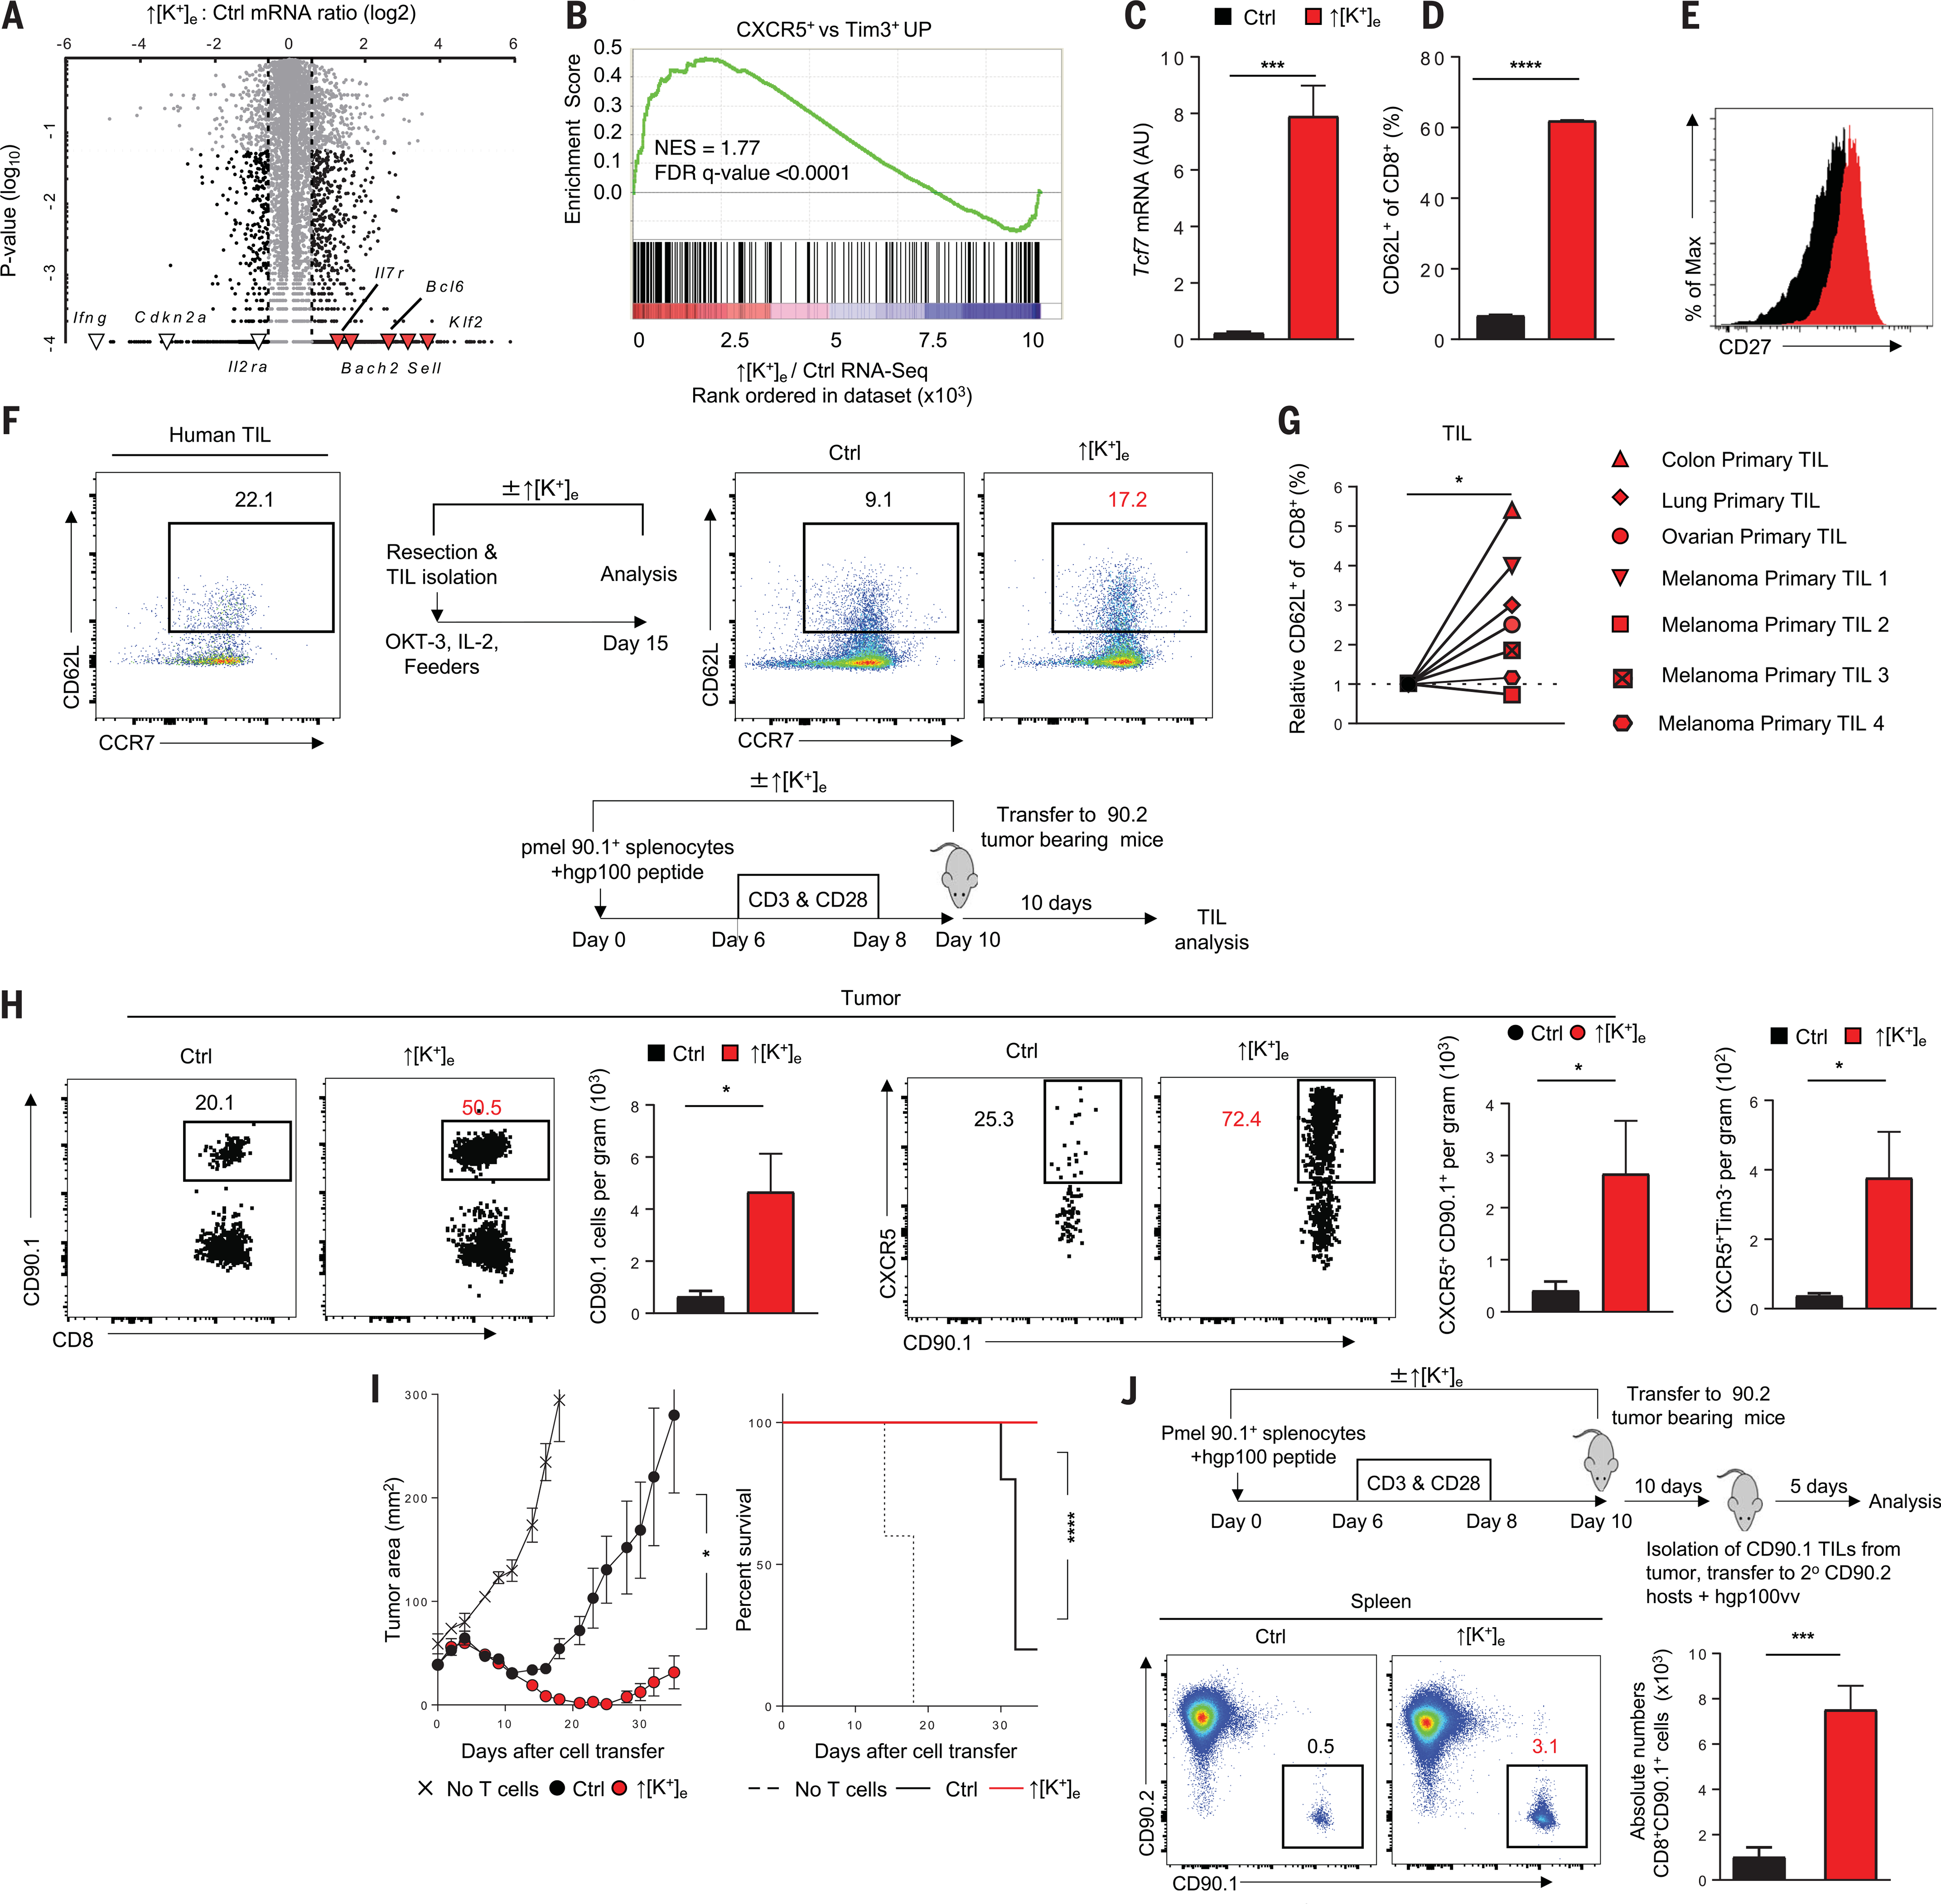
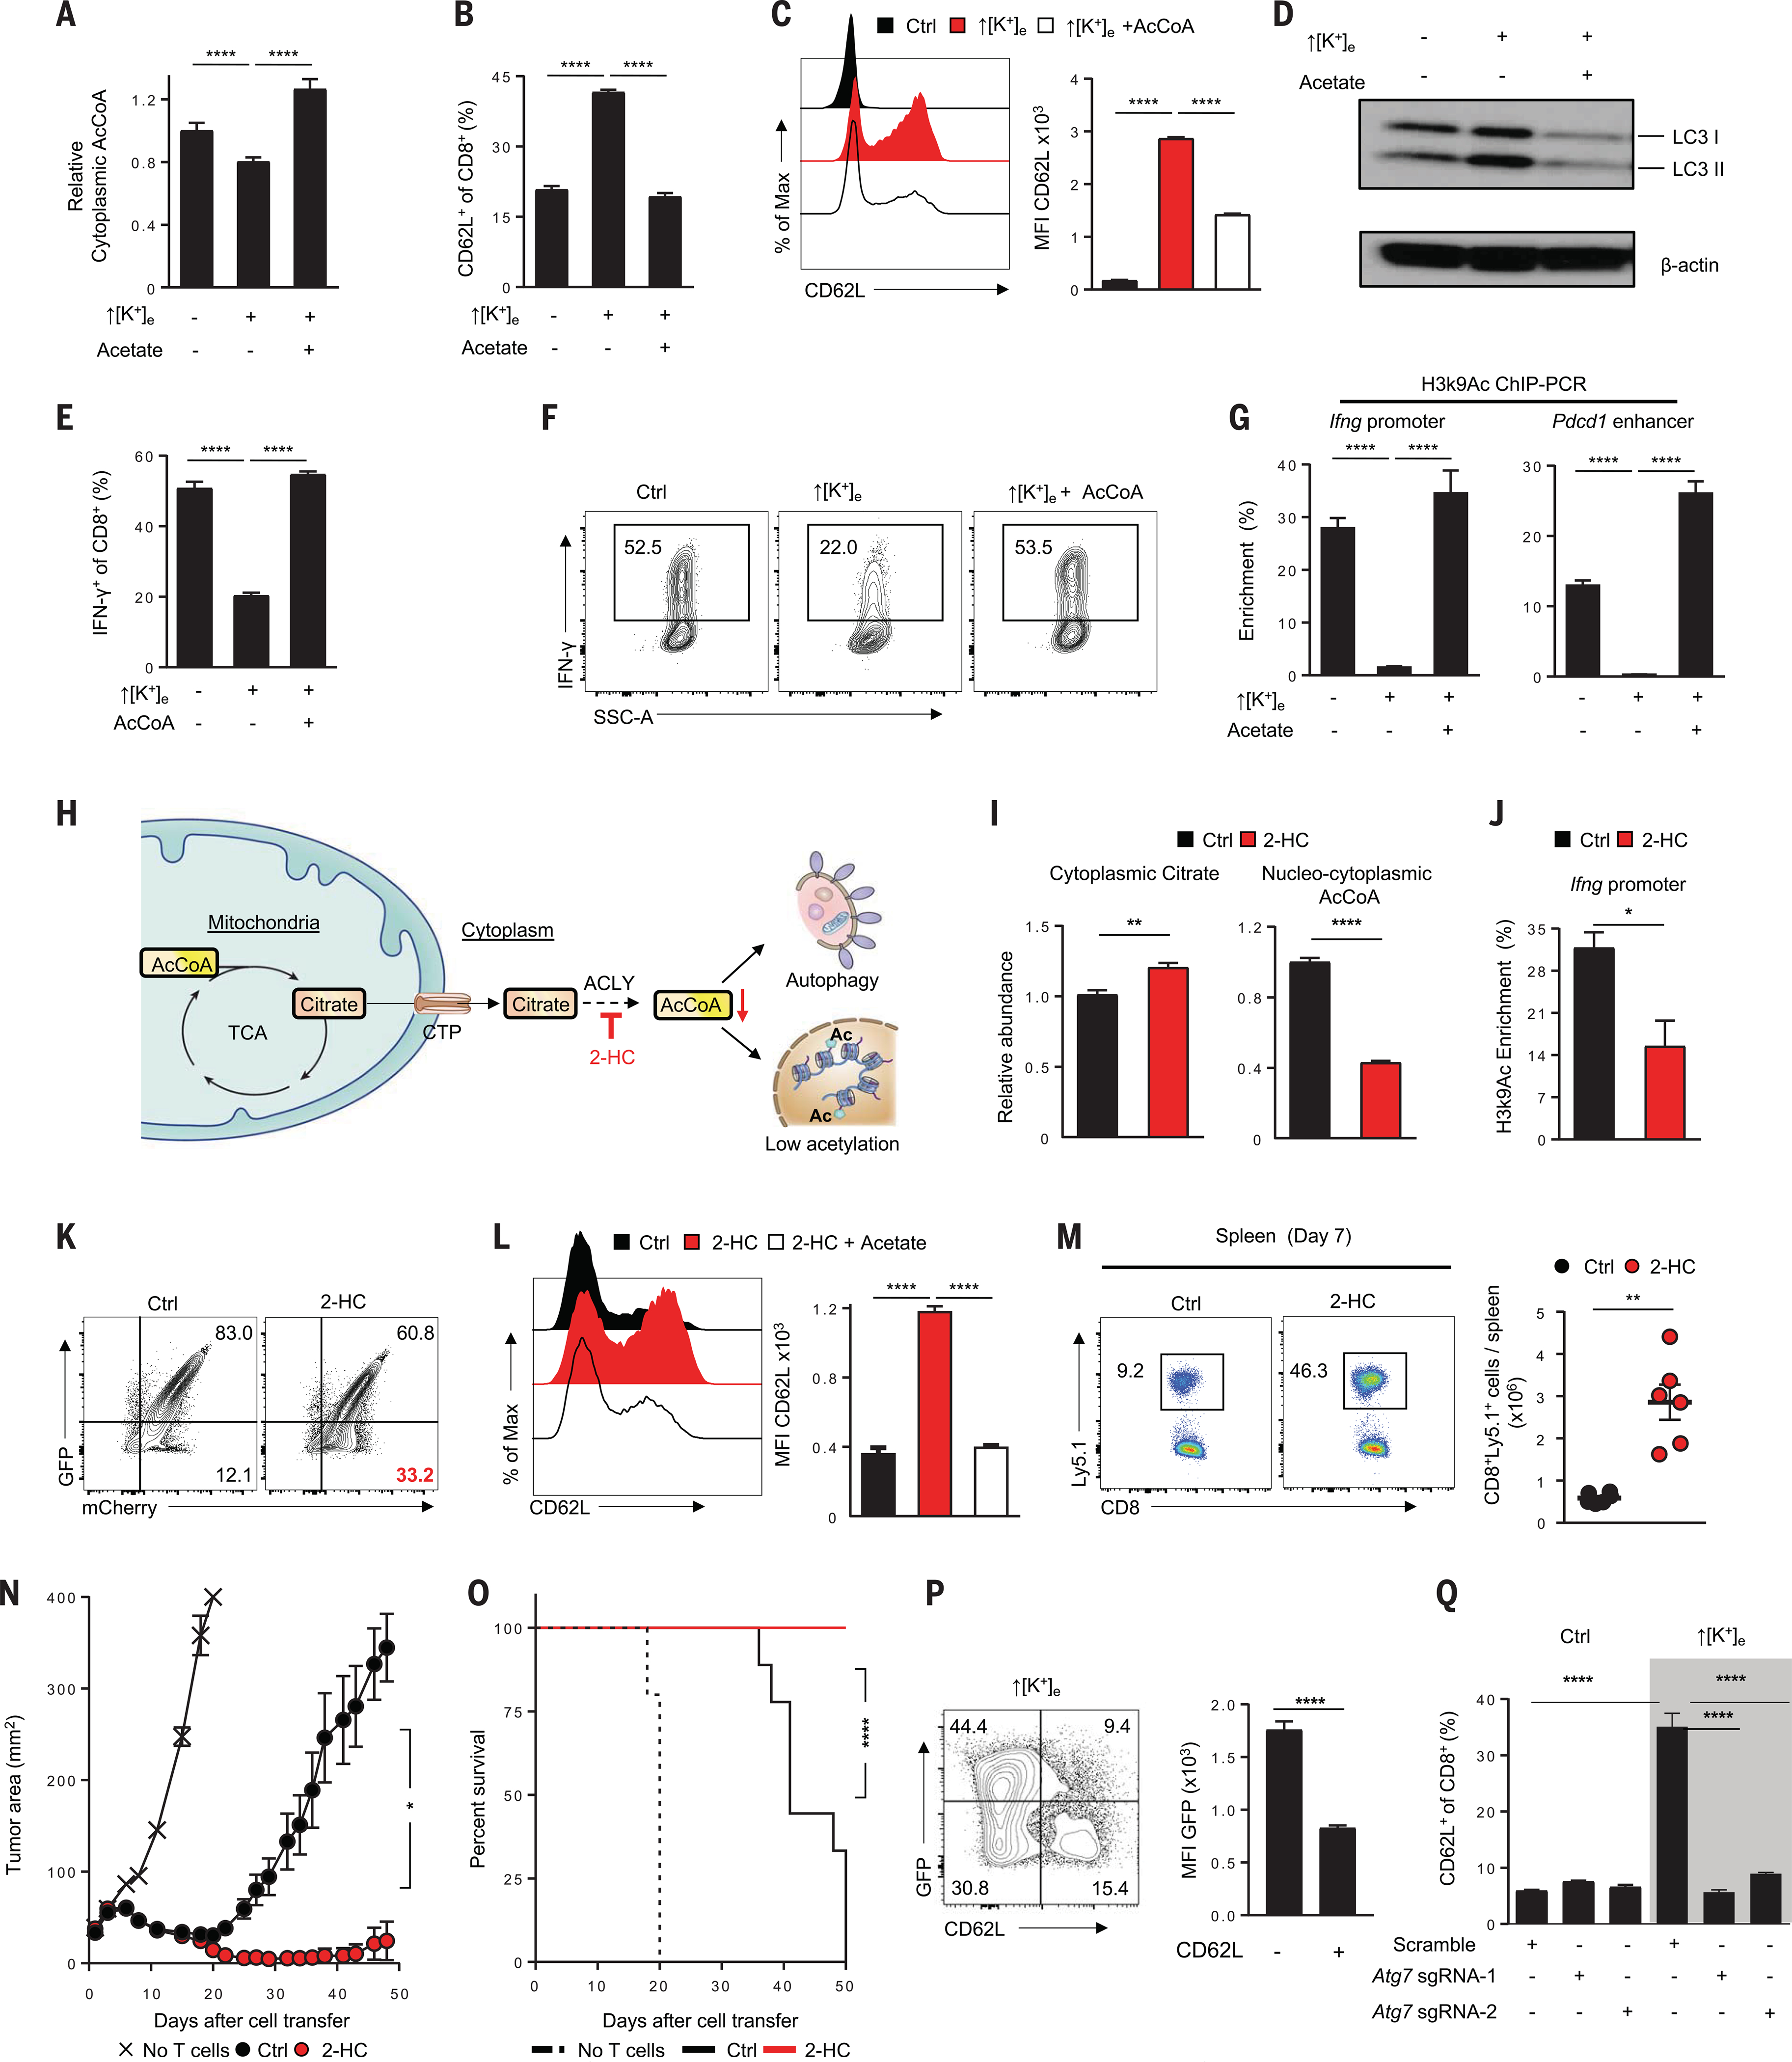
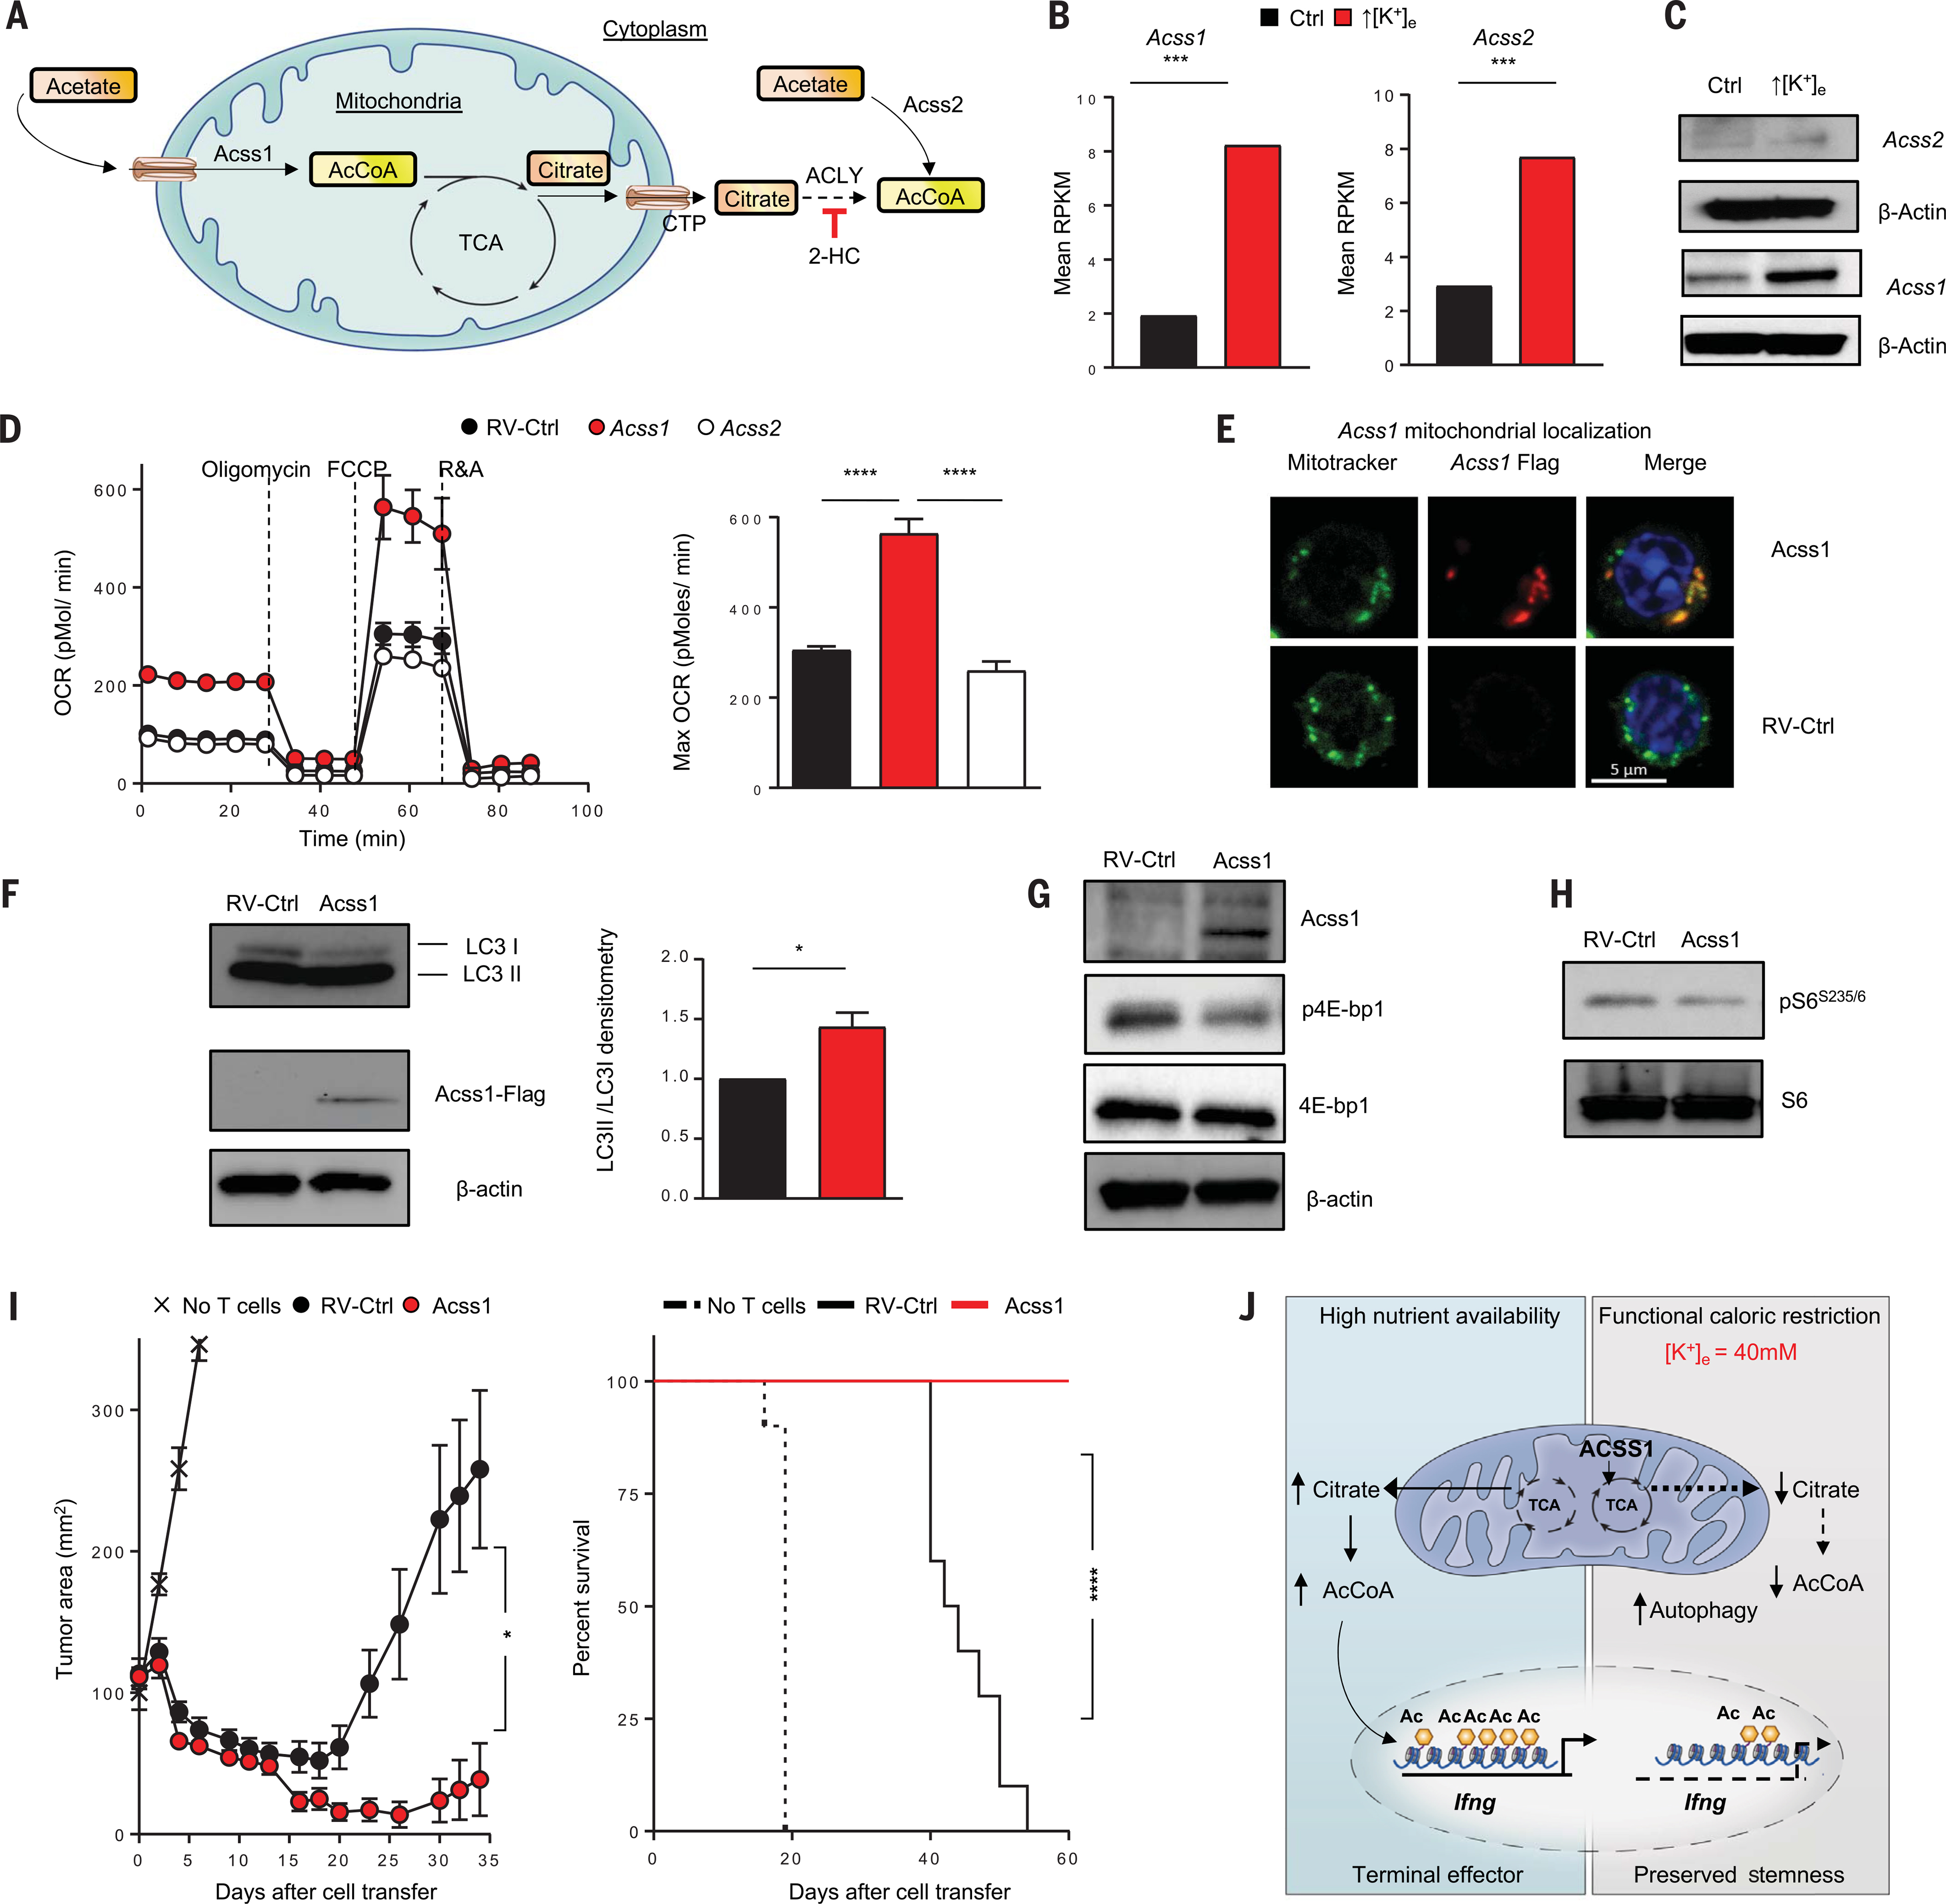
A paradox of tumor immunology is that tumor-infiltrating lymphocytes are dysfunctional in situ, yet are capable of stem cell-like behavior including self-renewal, expansion, and multipotency, resulting in the eradication of large metastatic tumors. We find that the overabundance of potassium in the tumor microenvironment underlies this dichotomy, triggering suppression of T cell effector function while preserving stemness. High levels of extracellular potassium constrain T cell effector programs by limiting nutrient uptake, thereby inducing autophagy and reduction of histone acetylation at effector and exhaustion loci, which in turn produces CD8+ T cells with improved in vivo persistence, multipotency, and tumor clearance. This mechanistic knowledge advances our understanding of T cell dysfunction and may lead to novel approaches that enable the development of enhanced T cell strategies for cancer immunotherapy.


Conflict of interest statement

Competing interests: Authors declare no competing interests.

Figures

Fig. 1.
Fig. 1.. Increased [K+]e limits nutrient uptake and triggers functional caloric restriction in T cells.
(A) Experimental setup for activation of CD8+ T cells in the indicated conditions: control (regular media; 5 mM K+) or ↑[K+]e (an additional 40 mM K+). (B and C) Quantification of glycolysis metabolites (B) and amino acids (C) by liquid chromatography and mass spectrometry in the indicated conditions (data shown are means ± SEM of six replicates per condition). (D) 2-NBDG uptake in the indicated conditions with representative histograms and quantification. (E) Representative fluorescence-activated cell sorting (FACS) histogram, quantification, and confocal images showing reduced BODIPY FLC16 uptake in ↑[K+]e versus control T cells. In (D) and (E), values indicate average geometric mean fluorescence intensity; data are means ± SEM and are representative of two independent experiments. See fig. S1B for confocal quantifications. (F) Schematic of necrotic tumors (pink) liberating intracellular potassium into the tumor interstitial fluid. This disrupts the electrochemical gradient and limits the ability of T cells to take up nutrients (blue, purple, and red symbols), resulting in functional caloric restriction. (G) Left: Heat map shows relative abundance of profiled metabolites in T cells under control and ↑[K+]e conditions. Right: Quantifications highlight the subset of lipid species enriched involving autophagy flux. Data are means ± SEM of six replicates per conditionper condition. (H) Volcano plot representing decreased glycolysis metabolites (black) and enrichment of Kennedy intermediates (red). Metabolite abundance is represented as relative change (x axis) versus significance ( y axis). (I) Schematic of the molecular pathways involved in autophagy and the role of Kennedy pathway components in LC3 lipidation for phagophore formation. (J) GSEA of ↑[K+]e versus control transcriptional profile compared with wild-type versus Atg7 KO datasets (GSE57047). NES, normalized enrichment score. All metabolomic data are means ± SEM of six replicates per condition. **P < 0.01, ***P < 0.001, ****P < 0.0001 (two-tailed t tests).
Fig. 2.
Fig. 2.. T cells exposed to increased [K+]e recycle nutrients via autophagy during functional caloric restriction.
(A) Schematic for monitoring autophagy flux using retroviral mCherry-eGFP-LC3 construct. (B) Experimental setup of in vitro culture conditions for activation of pmel CD8+ T cells with gp100, followed by retroviral transduction with mCherry-GFP-LC3 construct at indicated time points. (C) Representative live-cell confocal images defining the GFP and mCherry puncta in cells treated under the indicated conditions. See fig. S2B for quantification of confocal images. (D) Representative flow cytometry plot and quantification of autophagy flux in the indicated conditions by measuring the loss of GFP in mCherry populations. Data are means ± SEM and are representative of two independent experiments. (E and F) Immunoblot densitometries and quantification of mouse or human CD8+ Tcells for LC3b-I and LC3b-II in control or ↑[K+]e conditions. Quantification of autophagy flux is represented by ratio of LCb3-II/LC3b-I intensities. Data are means ± SEM of three independent Western blots. (G and H) Immunoblot densitometry of CD8+ Tcells obtained from mouse or human for phosphor-S6 (Ser235/236) in control or ↑[K+]e conditions. (I and J) Representative O2 consumption rates (OCR) of CD8+ pmel transgenic Tcells and CD8+ T cells obtained from fresh tumor digest of a melanoma patient cultured in control or ↑[K+]e measured in real time under basal conditions in response to the mitochondrial inhibitors oligomycin, FCCP [carbonyl cyanide 4-(trifluoromethoxy)phenylhydrazone], and R&A (rotenone and antimycin). For all relevant panels here and in later figures, center values and error bars represent means ± SEM. **P < 0.01, ***P < 0.001, ****P < 0.0001 (two-tailed t tests).
Fig. 3.
Fig. 3.. Elevated [K+]e-mediated metabolic programming depletes cytoplasmic AcCoA to preserve epigenetic stemness.
(A) Schematic of the molecular pathways involving compartmentalization of mitochondrial and cytoplasmic AcCoA. Model depicts how reduction in cytoplasmic AcCoA inhibits acquisition of effector functions through epigenetic changes. (B and C) Quantifications of total cellular AcCoA, cytoplasmic citrate, and nucleocytosolic AcCoA from cells treated in the indicated conditions. Data are means ± SEM and are representative of two independent experiments with at least three culture replicates. (D) Representative immunoblot showing reduced protein acetylation on Lys residues in the indicated conditions, with quantification at right. Data are means ± SEM and are representative of two independent experiments. (E) Drosophila DNA spike-in normalized quantifications of H3K9Ac and H3K27Ac enrichment by ChIP-PCR at the Ifng locus. Data are means ± SEM and are representative of two independent experiments with at least three culture replicates. (F) Representative genomic alignments of H3K9Ac ChIP-seq and RNA-seq measurements showing reduced deposition of acetylation or transcripts at the Ifng locus of CD8+ Tcells treated in the indicated conditions. Black bars under the tracks represent the called common peaks in ↑[K+]e and control. Black boxes are sites of acetylation at transcription start site (TSS) and enhancer loci. (G) Representative genomic alignments of H3K9Ac deposition on the inhibitory receptor gene loci Pdcd1 (CD279), CD244 (2B4), Havcr2 (Tim-3), and Klrg1. (H) Left: Volcano plot depicting a subset of effector genes and inhibitory receptors with reduced H3K9Ac deposition in ↑[K+]e relative to control T cells. Right: GSEA with statistical analysis of effector genes and gene set associated with loss of stemness (Tim3+ versus CXCR5+ UP). Abundance is represented as relative change (x axis, calculated from normalized read counts of the peaks annotated to nearest TSS) versus significance (y axis). (I) Volcano plots representing reduced H3K9Ac deposition of effector genes that showed differential chromatin accessibility in ATAC-seq datasets (GSE86797) of the indicated conditions. Abundance is represented as relative change (x axis) versus significance (y axis). ChIP-seq experiments for each condition were performed with two independent cultures. *P < 0.05, **P < 0.01, ***P < 0.001 (two-tailed t tests).
Fig. 4.
Fig. 4.. Exposure to increased [K+]e limits terminal effector differentiation in murine and human Tcells, enhancing persistence and antitumor function.
(A) Volcano plot representing differentially expressed genes analyzed by RNA-seq of CD8+ T cells cultured in ↑[K+]e versus control. Genes highlighted on the positive axis show enrichment of memory gene signature in ↑[K+]e; effector genes with decreased expression are shown on the negative axis. Abundance is represented as relative change (x axis) versus significance (y axis). (B) GSEA of ↑[K+]e versus control comparing with genes enriched in CXCR5+ versus Tim3+high dataset. (C) Quantification (left) of Tcf7 mRNA transcripts relative to actin as determined by reverse transcription PCR. (D) Quantification of CD62L+. (E) CD27+ cells in pmel CD8+ T cells cultured in the indicated conditions. Data are means ± SEM and are representative of two (C) or three [(D) and (E)] independent experiments. (F) Representative FACS plots showing the starting population phenotype of CD8+ TILs obtained from a fresh tumor digest of a melanoma patient, with schematic of in vitro culture conditions. (G) Quantifications of relative CD8+ CD62L+ yields of neoantigen-specific and CD8+ TILs from various tumor types by culturing in ↑[K+]e conditions. Data are means of culture replicates per patient sample. (H) Schematic of control or ↑[K+]e T cell culture conditions and adoptive T cell transfer into mice bearing established B16 melanoma tumors. Representative FACS plots show percentages and absolute numbers of pmel (CD90.1), CXCR5+, and CXCR5+ Tim3 T cells present in tumors 10 days after adoptive transfer. Data are means ± SEM and are representative of two independent experiments with at least five mice per group. (I) Tumor growth curves (left) and survival rates (right) of mice bearing B16 tumors treated with pmel T cells cultured in control or ↑[K+]e. In vivo data shown are representative of three independent experiments with n = 5 to 10 mice per group. Tumor measurements were plotted as mean ± SEM for each data point; tumor treatment curves were compared by Wilcoxon rank sum test; animal survival was assessed by log-rank test. (J) Schematic of adoptively transferred CD90.1 TIL isolation from B16 tumors and secondary transfer to CD90.2 mice. Recall response of transferred TILs in CD90.2 host was assessed by challenging with recombinant vaccinia virus expressing gp100. Absolute numbers are from day 5 after viral challenge. Data are means ± SEM with n ≥ 5 mice per group. *P < 0.05, ***P < 0.001, ****P < 0.0001 (two-tailed t tests).
Fig. 5.
Fig. 5.. Increased [K+]e-mediated metabolic reprogramming is mediated by AcCoA subcellular abundance and autophagy.
(A) Rescue of ↑[K+]e effects on cytoplasmic AcCoA by external acetate (5 mM) supplementation. (B and C) Representative FACS plot quantifications of effects of external acetate (B) and electroporated AcCoA(50 μM) (C) on CD62L cell surface expression in CD8+ T cells in the indicated conditions. Data are means ± SEM and are representative of two (A) or three [(B) and (C)] independent experiments. (D) Immunoblot showing reduction of autophagy in ↑[K+]e by provision of external acetate. (E and F) Representative FACS plots and quantification showing augmentation of IFN-γ cytokine expression by electroporation of external AcCoA (50 mM). Data are means ± SEM and are representative of two independent experiments. (G) Quantifications of H3K9Ac enrichment by ChIP-PCR at the Ifng and Pdcd1 enhancer locus in the indicated conditions. Data are means ± SEM from at least three culture replicates. (H) Schematic of the molecular pathways, substrates, and associated enzymes involved in the generation of cytoplasmic AcCoA pools. CTP, citrate transporter; 2-HC, ACLY inhibitor (5 mM hydroxycitrate). (I) Quantification of cytoplasmic citrate and cytoplasmic AcCoA from the cells treated in the indicated conditions. (J) ChIP-PCR quantification showing reduced H3K9Ac deposition at the Ifng locus in 2-HC–treated cells. Data are means ± SEM and are representative of three (I) or two (J) independent experiments with n = 3 culture replicates per experiment. (K) Representative FACS plots of autophagy flux in the indicated conditions by measuring the loss of GFP in mCherry+ populations. (L) Representative FACS plots showing effect of external acetate supplementation on CD62L expression in 2-HC–treated cells. Data are means ± SEM and are representative of two independent experiments with n = 3 culture replicates per experiment. (M) Representative flow cytometry analysis (left) and absolute number quantification (right) of transferred Ly5.1+ CD8+ T cells in the spleen of tumor-bearing mice on day 7 in the indicated conditions. Data are representative of two independent experiments with at least n = 5 mice per group. (N and O) Antitumor efficacy (left) and survival rates in mice (right) bearing B16 tumors treated with pmel T cells cultured in control (n = 10) or 2-HC (n = 10). Tumor measurements were plotted as mean ± SEM for each data point; tumor treatment curves were compared by Wilcoxon rank sum test; animal survival was assessed by log-rank test. Data are representative of two independent experiments. (P) Representative flow cytometry analysis and quantifications showing reduced autophagic flux in CD62L populations. Data are means ± SEM and are representative of two independent experiments with n = 3 culture replicates per experiment. (Q) Representative flow cytometry quantification showing abrogation of increased CD62L expression driven by ↑[K+]e upon genetic perturbation of Atg7 (highlighted in gray). *P < 0.05, **P < 0.01, ****P < 0.0001 (two-tailed t tests).
Fig. 6.
Fig. 6.. Acss1 promotes mitochondrial metabolism to augment T cell persistence and antitumor activity.
(A) Schematic of the molecular pathways, substrates, and associated enzymes involved in the generation of mitochondrial and cytoplasmic AcCoA pools. (B) Quantifications showing the normalized mRNA transcripts of AcCoA synthetase (Acss1 and Acss2). RPKM, reads per kilobase per million mapped reads. (C) Immunoblot showing protein expression of Acss1 and Acss2 in control or ↑[K+]e T cells. (D) OCRs of control or Acss1- or Acss2-transduced CD8+ pmel T cells were measured in real time under basal conditions in response to the indicated mitochondrial inhibitors. Data are means ± SEM and are representative of two independent experiments. (E) Representative confocal images defining the localization of Acss1 in mitochondria. (F) Immunoblot densitometry of LC3b-I and LC3b-II in RV-control or Acss1 overexpression conditions. Data are means ± SEM of three independent immunoblots. (G and H) Immunoblot showing reduced phosphorylation of the nutrient-sensing kinase mTOR substrates p-4EBP and phosphor-S6 (S235/236) in Acss1-overexpressing CD8+ T cells. (I) Tumor growth (left) and animal survival curves (right) of sublethally irradiated mice bearing B16 tumors treated with T cells transduced with retrovirus control (n = 10) or Acss1-transduced T cells (n = 10). Tumor measurements were plotted as mean ± SEM for each data point; tumor treatment curves were compared by Wilcoxon rank sum test; animal survival was assessed by log-rank test. In vivo data shown are representative of two independent experiments. (J) Illustration showing dual role of potassium in limiting the acquisition of effector functions and preserving the stemness of T cells. *P < 0.05, ***P < 0.001, ****P < 0.0001 (two-tailed t tests).

Comment in

  • Potassium shapes antitumor immunity.
    Baixauli F, Villa M, Pearce EL. Baixauli F, et al. Science. 2019 Mar 29;363(6434):1395-1396. doi: 10.1126/science.aaw8800. Science. 2019. PMID: 30923211 No abstract available.
  • Putting the K+ in K+aloric Restriction.
    Lien EC, Lau AN, Vander Heiden MG. Lien EC, et al. Immunity. 2019 May 21;50(5):1129-1131. doi: 10.1016/j.immuni.2019.04.016. Immunity. 2019. PMID: 31117009

References

    1. Rosenberg SA, Restifo NP, Adoptive cell transfer as personalized immunotherapy for human cancer. Science 348, 62–68 (2015). doi: 10.1126/science.aaa4967; pmid: 25838374 - DOI - PMC - PubMed
    1. Dudley ME et al., Cancer regression and autoimmunity in patients after clonal repopulation with antitumor lymphocytes. Science 298, 850–854 (2002). doi: 10.1126/science.1076514; pmid: 12242449 - DOI - PMC - PubMed
    1. Rosenberg SA et al., Durable complete responses in heavily pretreated patients with metastatic melanoma using T-cell transfer immunotherapy. Clin. Cancer Res 17, 4550–4557 (2011). doi: 10.1158/1078-0432.CCR-11-0116; pmid: 21498393 - DOI - PMC - PubMed
    1. Zacharakis N et al., Immune recognition of somatic mutations leading to complete durable regression in metastatic breast cancer. Nat. Med 24, 724–730 (2018). doi: 10.1038/s41591-018-0040-8; pmid: 29867227 - DOI - PMC - PubMed
    1. Ribas A, Wolchok JD, Cancer immunotherapy using checkpoint blockade. Science 359, 1350–1355 (2018). doi: 10.1126/science.aar4060; pmid: 29567705 - DOI - PMC - PubMed

Publication types