. 2019 Mar 29;363(6434):1447-1452.
doi: 10.1126/science.aav5297.

Remembered reward locations restructure entorhinal spatial maps

Affiliations

Remembered reward locations restructure entorhinal spatial maps

William N Butler et al. Science. .

Abstract

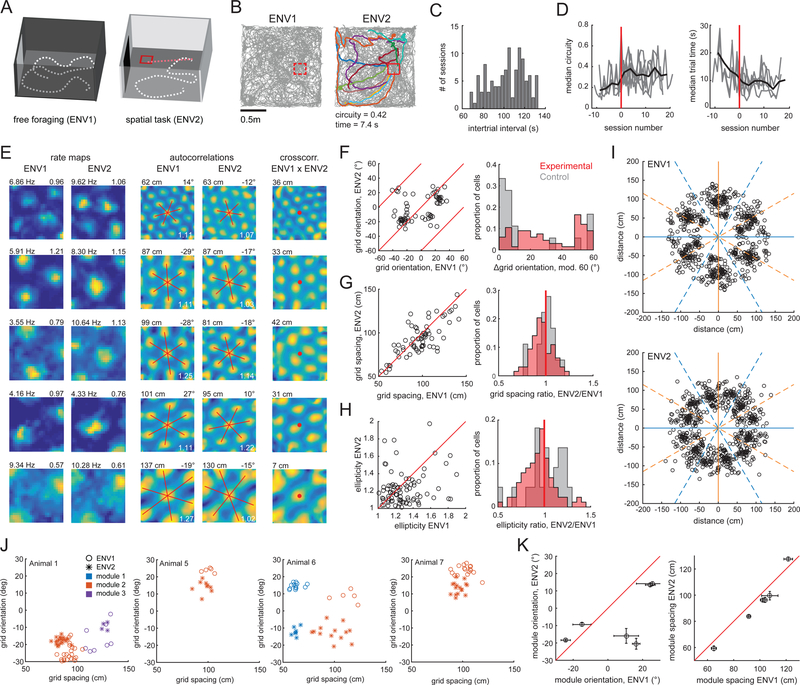
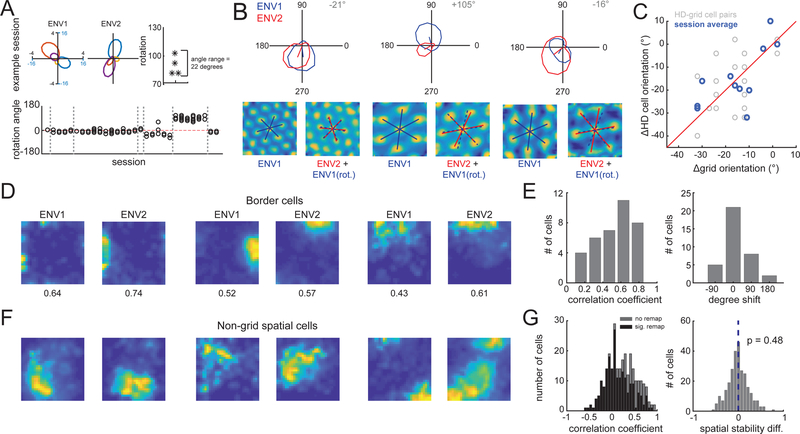
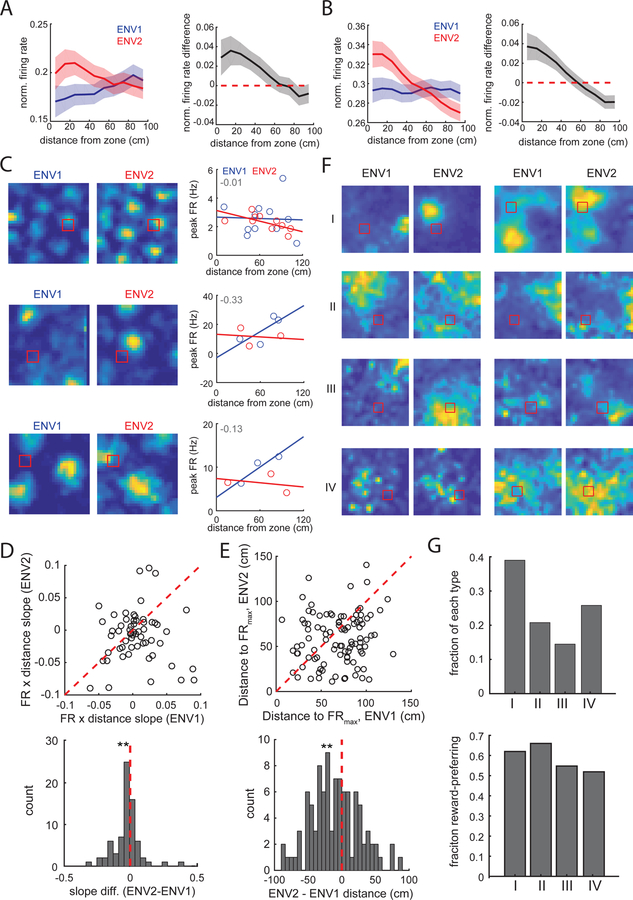
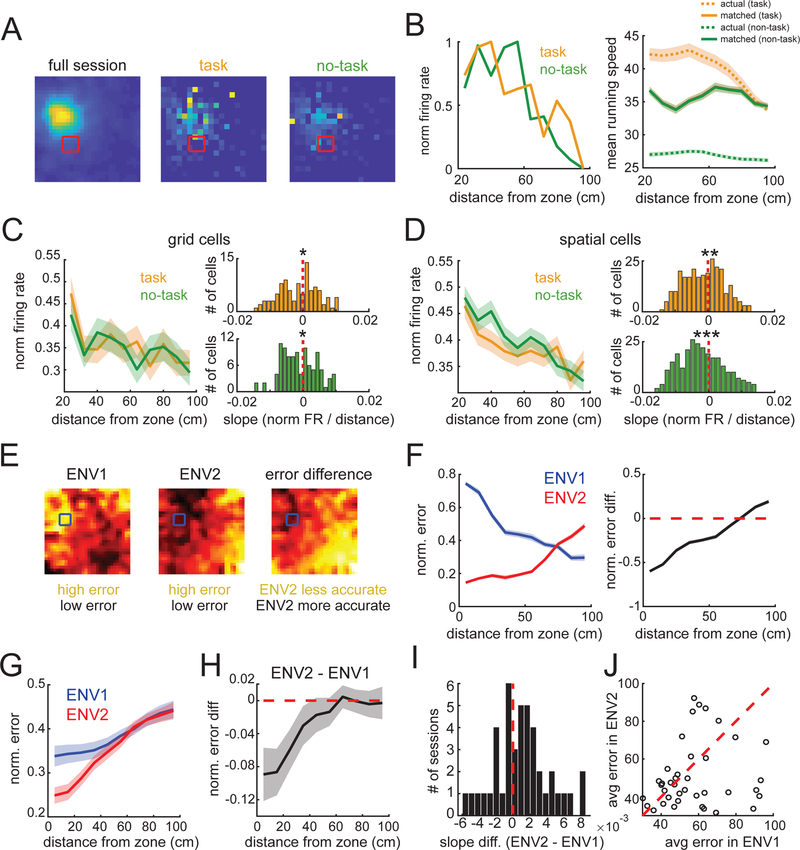
Ethologically relevant navigational strategies often incorporate remembered reward locations. Although neurons in the medial entorhinal cortex provide a maplike representation of the external spatial world, whether this map integrates information regarding learned reward locations remains unknown. We compared entorhinal coding in rats during a free-foraging task and a spatial memory task. Entorhinal spatial maps restructured to incorporate a learned reward location, which in turn improved positional decoding near this location. This finding indicates that different navigational strategies drive the emergence of discrete entorhinal maps of space and points to a role for entorhinal codes in a diverse range of navigational behaviors.


Conflict of interest statement

Competing interests: Authors declare no competing interests;

Figures

Fig. 1
Fig. 1. Performance of a task induces grid rotation and rescaling.
(A). Schematic of environments. (B) Trajectories (gray) from a paired session. Trial trajectories are highlighted. Mean trial circuity and trial time noted below ENV2. Reward zone in red. (C) Histogram of inter-trial intervals. (D) Circuity and trial time improved with training in individual animals (gray lines). Data aligned to each animal’s first post-trained session (red line). (E) (Left) Grid cell rate maps in both environments; peak firing rate and grid score noted on top. (Middle) Corresponding autocorrelations; spacing and orientation noted on top. Red lines indicate grid axes; white text indicates ellipticity. (Right) Corresponding ENV1-ENV2 cross-correlations. Distance from the cross-correlation’s center to the nearest peak noted on top. (F) (Left) Grid cell orientations, red lines indicate rotations equivalent to modulo 60. (Right) Histogram of grid orientation differences for experimental and control animals. (G) (Left) Grid cell spacing, red line indicates identical spacing. (Right) Histograms of grid spacing ratio. (H) (Left) Grid cell ellipticities, red line indicates identical ellipticity. (Right) Histograms of ellipticity ratio. (I) Scatter plots of the innermost six fields in each grid cell’s autocorrelation. Orange lines represent north-south aligned axes; blue lines represent east-west aligned axes. (J) Unpaired grid cell recordings from four animals, clustered into modules according to spacing and orientation. (K) Mean orientations (Left) and spacings (Right) in each environment for each of the six modules in (J). Error bars indicate SEM.
Fig. 2
Fig. 2. Performance of a task induces remapping in head direction, border and non-grid spatial cells.
(A) Top row: Four co-recorded HD cells in each environment. Rightmost panel indicates each cell’s rotation between environments. Bottom row: rotation angles observed across sessions. Gray lines indicate boundaries between animals. (B) Co-recorded grid and HD cells. (Top) HD tuning curves. (Bottom) Grid cell autocorrelations with grid axes. Co-rotation of grid and HD signals shown by rotating the ENV1 grid axes by the rotation observed in co-recorded HD cell (blue dashed lines). (C) (Grey) HD cell orientation change (between environments) versus grid cell orientation change for all possible pairs of co-recorded HD and grid cells. (Blue) Same data, with all HD or grid cells recorded within the same session averaged together. (D) Border cell rate maps in ENV1 and ENV2. (E) Histograms of border cell rate map ENV1 versus ENV2 correlation coefficients (left) and rotation values (right). (F) Non-grid spatial cell rate maps in ENV1 and ENV2. (G) (Left) Histogram of non-grid spatial cell rate map ENV1 versus ENV2 correlation coefficients (black = cells with significant re-mapping, grey = non-significant re-mapping). (Right) Histogram of the difference in spatial stability between ENV1 and ENV2.
Fig. 3
Fig. 3. Grid and non-grid spatial cells have localized firing rate changes near the reward.
(A) (Left) Mean normalized grid cell firing rate as a function of distance from the reward zone. Ribbon indicates SEM. (Right) Difference in grid cell firing rate (ENV2-ENV1). (B) (Left) Mean normalized non-grid spatial cell firing rate as a function of distance from the reward zone. (Right) Difference in firing rate (ENV2-ENV1). (C) (Left) Rate maps for three grid cells recorded in both environments. (Right) Corresponding field peak firing rates, plotted as a function of the field’s distance from the reward zone. Best-fit lines shown; difference between the best-fit lines (slope ENV2 - slope ENV1) indicated in upper left. (D) (Top) Best fit slope values for each cell in ENV1 and ENV2. (Bottom) Histogram of slope differences for grid cells. (E) (Top) Distance from the reward zone to the highest FR field in each environment for each cell. (Bottom) Histogram of distance differences. (F) Non-grid spatial cells that show reward preference in ENV2 correspond to four categories of remapping; two examples/group are shown. (G) (Top) Fraction of reward-preferring cells in each remapping category (of 159 total reward-preferring cells). (Bottom) Fraction of cells in each remapping category that show reward-preference.
Fig. 4
Fig. 4. Long-term changes in the spatial map support spatial decoding near the reward.
(A) Rate maps of the full ENV2 session (left), task (middle), and no-task trajectories (right) speed-matched for each position bin. (B) (Left) The cell in (A)’s average normalized firing rate as a function of distance from the reward zone for task (orange) and no-task trajectories (green). (Right) Mean running speed during task and no-task trajectories as a function of distance from the center of the reward zone, before and after speed-matching. (C-D) (Left panels) Average normalized firing rate for grid (C) and non-grid position (D) cells as a function of distance from the reward zone. (Right panels) The slopes of both task and no-task trajectories were significantly negatively distributed for grid (C) and non-grid position (D) cells. (E) Example decoding error maps for ENV1 (left), ENV2 (middle), and the normalized difference (ENV2-ENV1, right) from a single session (ENV1 n = 6 P-encoding cells, ENV2 n = 5 cells). (F) Normalized error (Left) and ENV2-ENV1 error difference (Right) as a function of distance from the reward zone for the example in (E). (G) Normalized error versus distance from reward zone for each environment, averaged over all decoding sessions (n = 43). (H) Average difference in error (ENV2-ENV1) for all sessions. (I) Distribution of slopes of ENV2-ENV1 tuning curves across sessions. (J) Across all sessions, decoding error within 30 cm of reward zone is lower in ENV2 than ENV1 (median difference in error = −4.3 cm, signed-rank p = 0.028).

Comment in

  • Neural representations across species.
    Quiroga RQ. Quiroga RQ. Science. 2019 Mar 29;363(6434):1388-1389. doi: 10.1126/science.aaw8829. Science. 2019. PMID: 30923208 No abstract available.
  • Grids cells go for a goal.
    Bray N. Bray N. Nat Rev Neurosci. 2019 Jun;20(6):316-317. doi: 10.1038/s41583-019-0170-0. Nat Rev Neurosci. 2019. PMID: 30992559 No abstract available.

References

    1. O’Keefe J, Dostrovsky J, The hippocampus as a spatial map. Preliminary evidence from unit activity in the freely-moving rat. Brain Res 34, 171–175 (1971). - PubMed
    1. Hafting T, Fyhn M, Molden S, Moser MB, Moser EI, Microstructure of a spatial map in the entorhinal cortex. Nature 436, 801–806 (2005). - PubMed
    1. Kropff E, Carmichael JE, Moser MB, Moser EI, Speed cells in the medial entorhinal cortex. Nature 523, 419–424 (2015). - PubMed
    1. Solstad T, Boccara CN, Kropff E, Moser MB, Moser EI, Representation of geometric borders in the entorhinal cortex. Science 322, 1865–1868 (2008). - PubMed
    1. Sargolini F et al., Conjunctive representation of position, direction, and velocity in entorhinal cortex. Science 312, 758–762 (2006). - PubMed

Publication types