. 2019 May;31(5):993-1011.
doi: 10.1105/tpc.18.00785. Epub 2019 Mar 28.

Dynamics of Gene Expression in Single Root Cells of Arabidopsis thaliana

Affiliations

Dynamics of Gene Expression in Single Root Cells of Arabidopsis thaliana

Ken Jean-Baptiste et al. Plant Cell. 2019 May.

Abstract

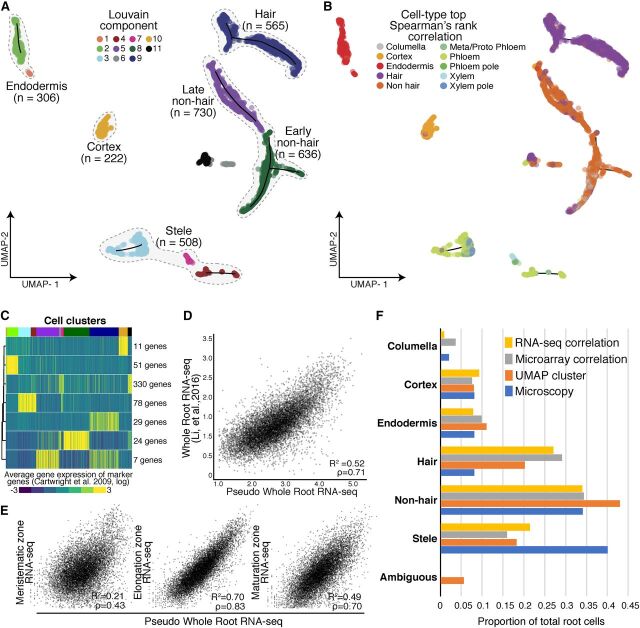
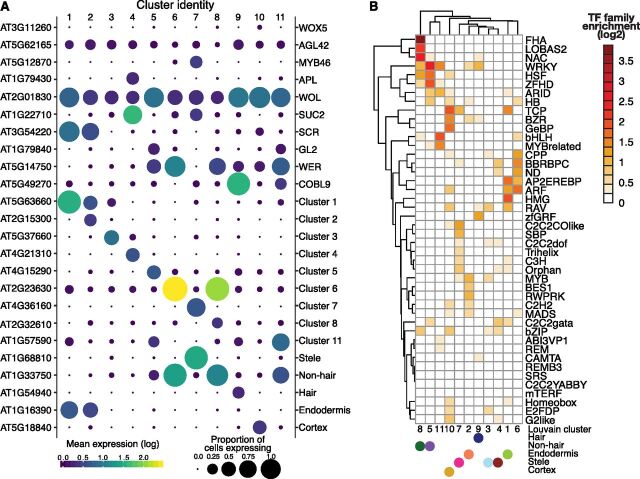
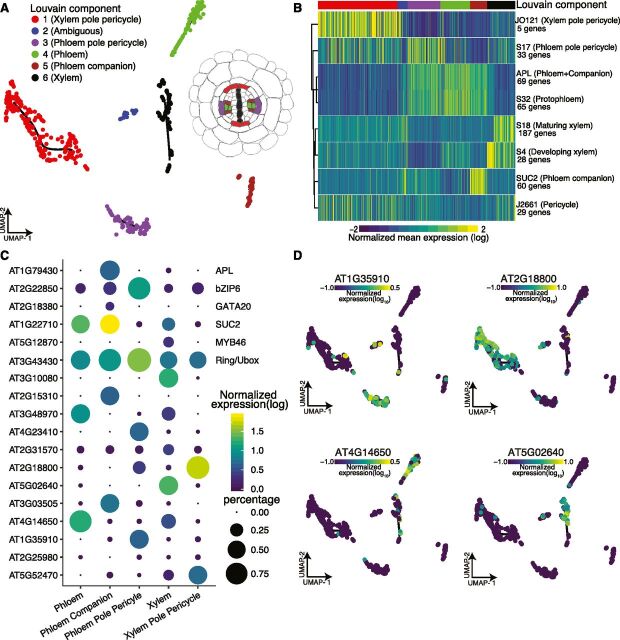
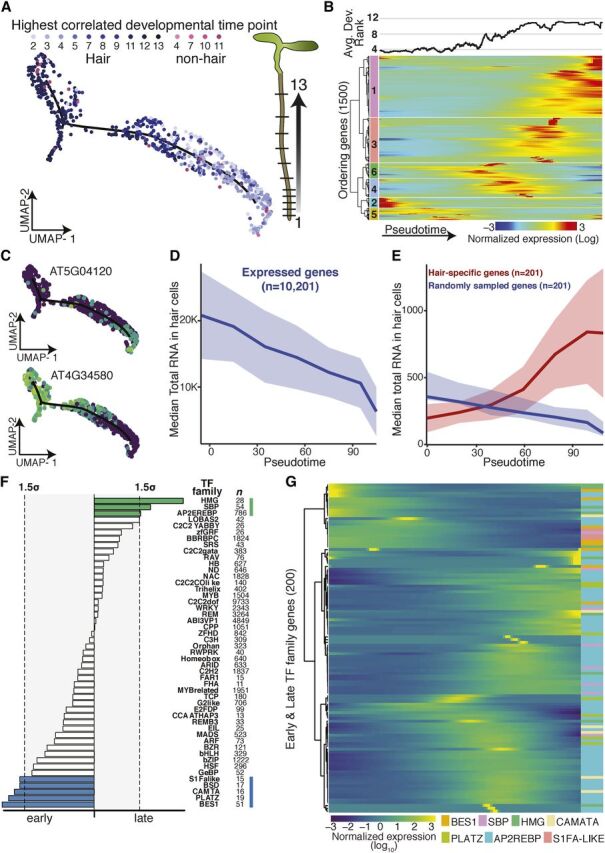
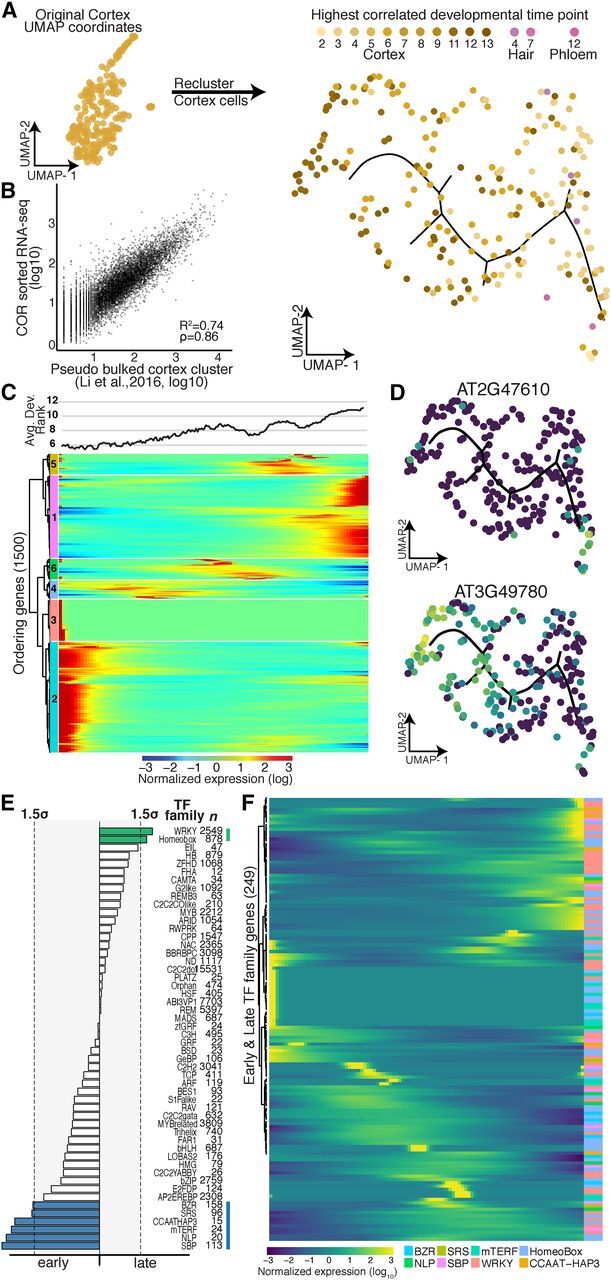
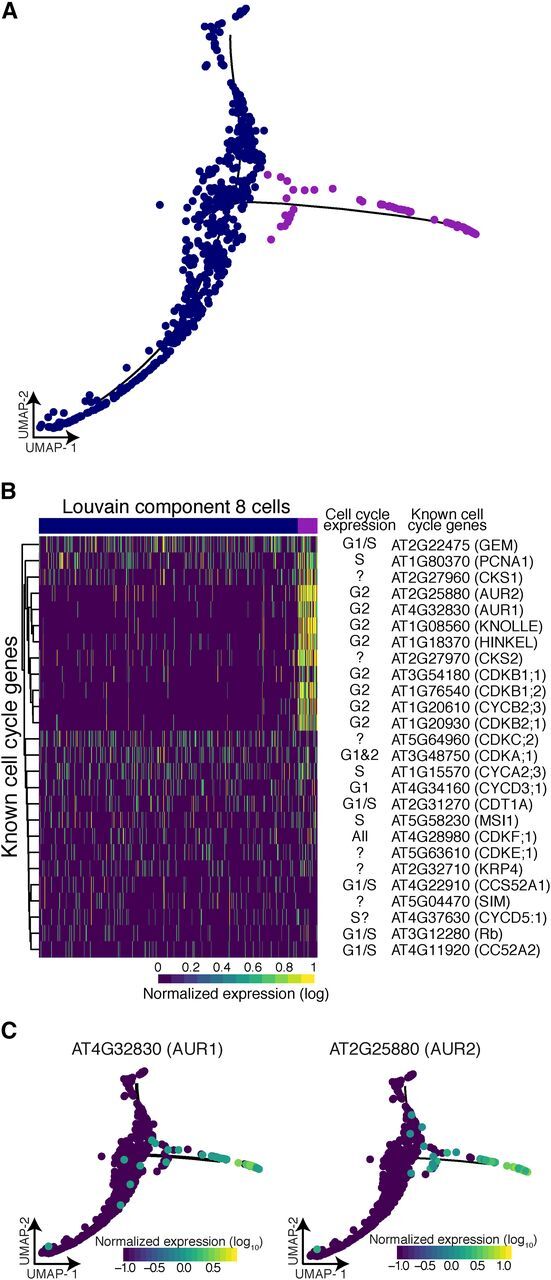
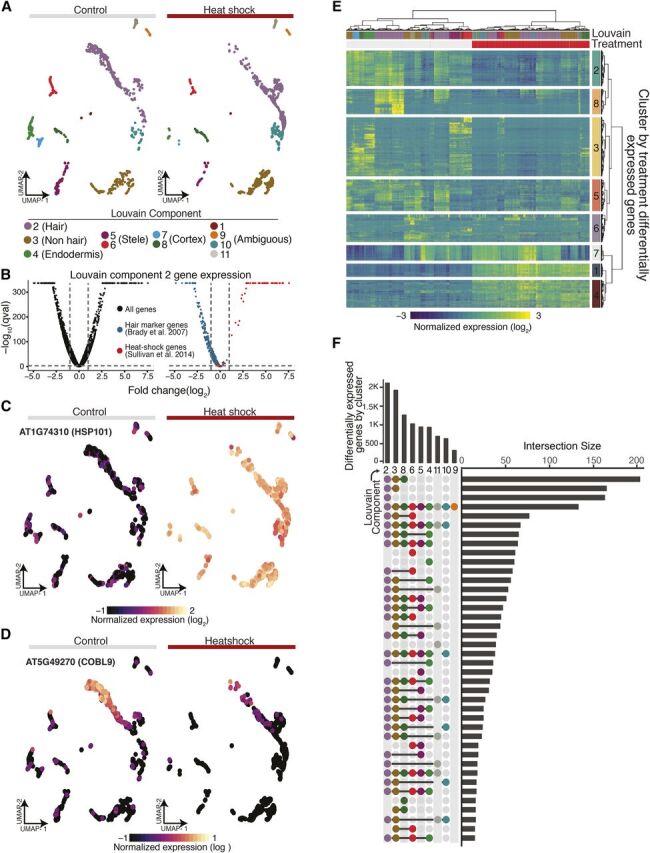
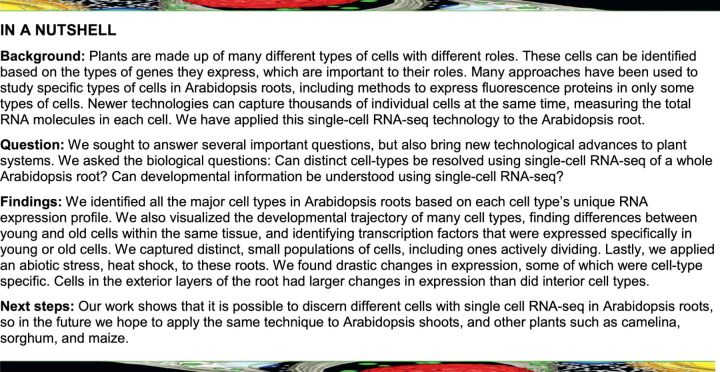
Single cell RNA sequencing can yield high-resolution cell-type-specific expression signatures that reveal new cell types and the developmental trajectories of cell lineages. Here, we apply this approach to Arabidopsis (Arabidopsis thaliana) root cells to capture gene expression in 3,121 root cells. We analyze these data with Monocle 3, which orders single cell transcriptomes in an unsupervised manner and uses machine learning to reconstruct single cell developmental trajectories along pseudotime. We identify hundreds of genes with cell-type-specific expression, with pseudotime analysis of several cell lineages revealing both known and novel genes that are expressed along a developmental trajectory. We identify transcription factor motifs that are enriched in early and late cells, together with the corresponding candidate transcription factors that likely drive the observed expression patterns. We assess and interpret changes in total RNA expression along developmental trajectories and show that trajectory branch points mark developmental decisions. Finally, by applying heat stress to whole seedlings, we address the longstanding question of possible heterogeneity among cell types in the response to an abiotic stress. Although the response of canonical heat-shock genes dominates expression across cell types, subtle but significant differences in other genes can be detected among cell types. Taken together, our results demonstrate that single cell transcriptomics holds promise for studying plant development and plant physiology with unprecedented resolution.


Figures

Figure 1.
Figure 1.
Annotation of Cell and Tissue Types for Single Cell RNA-Seq of Whole Arabidopsis Roots. (A) Root cells were clustered and projected onto two-dimensional space with UMAP (McInnes and Healy, 2018). Solid circles represent individual cells; colors represent their respective Louvain component. Monocle 3 trajectories (black lines) are shown for clusters in which a trajectory could be identified. (B) Solid circles represent individual cells; colors indicate cell and tissue type based on highest Spearman’s rank correlation with sorted tissue-specific bulk expression data (Brady et al., 2007; Cartwright et al., 2009). (C) Known marker genes (Brady et al., 2007; Cartwright et al., 2009) were used to cluster single cell gene expression profiles based on similarity. The expression of 530 known marker genes was grouped into seven clusters, using k-means clustering. Mean expression for each cluster (rows) is presented for each cell (columns). Cells were ordered by their respective Louvain component indicated above by color (see (A), starting at component 1 at left). Number of genes in each cluster is denoted at right. (D) Single cell RNA-Seq pseudo-bulked expression data are compared with bulk expression data of whole roots (Li et al., 2016). (E) Single cell pseudo-bulk expression data are compared with bulk-expression data of the three developmental regions of the Arabidopsis root (Li et al., 2016). (F) Proportions of cells as annotated by either UMAP (A), Spearman’s rank correlation (B), or Pearson’s rank (in Supplemental Figure 2), are compared with proportions determined by microscopy (Brady et al., 2007; Cartwright et al., 2009).
Figure 2.
Figure 2.
Novel Cluster-Specific and Tissue-Specific Genes and Enriched Transcription Factor Motifs. (A) The proportion of cells (circle size) and the mean expression (circle color) of genes with cluster-specific and tissue-specific expression are shown, beginning with known marker genes labeled with their common name (right) and their systematic name (left). For novel genes, the top significant cluster-specific genes are shown, followed by the top significant tissue-specific genes; both were identified by principal graph tests (Moran’s I) as implemented in Monocle 3. Note the correspondence between Louvain components and cell and tissue types. For all novel cluster-specific and tissue-specific genes, see Supplemental Table 3. (B) Enrichments of known transcription factor motifs (O’Malley et al., 2016) 500 bp upstream of genes with cluster-specific expression compared with genome background. Motifs are specific to transcription factor gene families rather than individual genes. The plot is clustered based on similarity in enrichments with Louvain components and the cell and tissue types (solid circles) indicated.
Figure 3.
Figure 3.
Reclustering of Stele Cells Yields Distinct Subclusters of Vasculature Cell Types. (A) Cells initially annotated as stele tissue were reclustered, resulting in six distinct subclusters cells, five of which contained >40 cells. (B) Mean expression for previously identified cell-type–specific genes (Cartwright et al., 2009) in each cell is shown, allowing annotation of stele subcluster identities as shown in (A). (C) Proportion of cells (circle size) and mean expression (circle color) of genes with cluster-specific and tissue-specific expression are shown, starting with known marker genes at the top, labeled with their common name (right) and their systematic name (left). Below, novel significant tissue-specific genes are shown with their systematic names, identified by principal graph tests (Moran’s I) as implemented in Monocle 3. (D) Example expression overlays for cluster-specific genes identified by the principal graph test in (C).
Figure 4.
Figure 4.
Developmental Trajectory of Hair Cells. (A) UMAP-clustered hair cells were assigned a developmental time point based on highest Spearman’s rank correlation with bulk expression data of staged tissue (13 developmental stages; Brady et al., 2007; Cartwright et al., 2009). Cell type and developmental time points are indicated in shades of blue (and pink). Graphic illustrates developmental stages in Arabidopsis root (plant illustrations). (B) Cells were ordered in pseudotime; columns represent cells, rows represent expression of the 1,500 ordering genes. Rows were grouped based on similarity in gene expression, resulting in six clusters (indicated left), with genes in clusters 2 and 5 expressed early in pseudotime, and genes in cluster 1 expressed late. Hair cells with the earliest developmental signal (Brady et al., 2007; Cartwright et al., 2009) were designated as the root of the trajectory. The graph above represents the average best-correlation of developmental stage (Brady et al., 2007; Cartwright et al., 2009) in a scrolling window of 20 cells with pseudotime, showing the expected increase in developmental age with increasing pseudotime. (C) Examples of an early and a late expressed hair-cell–specific gene. Gene expression in each cell is superimposed onto the UMAP cluster and trajectory, with lighter colors indicating higher gene expression. (D) Median total RNA captured in cells decreases across pseudotime. Number of genes included is indicated. (E) Comparison of median total RNA for hair-cell–specific genes (in red) to a comparable random set of genes (in blue). Number of genes is indicated (Permutation test P value ≈10−4). (F) Different transcription factor motifs reside in the 500-bp upstream regions of genes expressed early (clusters 2 and 5) compared with genes expressed late (cluster 1). Transcription factor motifs specific to early hair cells are denoted with blue bars, those for late hair cells with green bars; bar length indicates motif frequency. Thresholds on either side (gray box, dotted lines) refer to 1.5 sd above mean motif frequency. (G) Expression of individual members of transcription factors families highlighted in (D) across pseudotime identifies candidate factors driving early or late gene expression.
Figure 5.
Figure 5.
Developmental Trajectory of Cortex Cells. (A) Cortex cells were reclustered to create a trajectory, in which each cell was assigned a developmental time point and identity (shades of yellow, brown, and pink) based on the highest Spearman’s rank correlation of a cell’s gene expression with prior sorted bulk data (Brady et al., 2007; Cartwright et al., 2009). (B) Comparison of pseudo-bulk expression data from cells annotated as cortex cells with bulk expression data from protoplasts sorted for expression of the cortex marker gene COR (Li et al., 2016). (C) Cells were ordered in pseudotime; columns indicate cells, and rows the expression, of the 1,500 ordering genes. Rows were grouped based on similarity in gene expression, resulting in six clusters (indicated left), with genes in clusters 2 and 3 expressed early in pseudotime and genes in cluster 1 expressed late. Cortex cells with the earliest developmental signal (Brady et al., 2007; Cartwright et al., 2009) were designated as the root of the trajectory. The graph above represents the average best-correlation of developmental stage (Brady et al., 2007; Cartwright et al., 2009) in a scrolling window of 20 cells with pseudotime, showing the expected increase in developmental age with increasing pseudotime. (D) Examples of an early and a late expressed novel cortex-cell–specific gene. Gene expression in each cell is superimposed onto the UMAP cluster and trajectory, with lighter colors indicating higher gene expression. (E) Different transcription factor motifs reside in the 500-bp upstream regions of genes expressed early (clusters 2 and 3) compared with genes expressed late (cluster 1). Transcription factor motifs specific to early cortex cells are denoted with blue bars, and those for late cortex cells with green bars; bar length = motif frequency. Thresholds on either side (gray box, dotted lines) refer to 1.5 sd above mean motif frequency. (F) Expression of individual members of transcription factor families highlighted in (D) across pseudotime identifies candidate factors driving early or late gene expression.
Figure 6.
Figure 6.
Branch Analysis Reveals Actively Dividing Cells. (A) The 70 cells that resided in the branch of Louvain component 8 (purple) show significant branch-specific expression of genes enriched for cell-cycle function. (B) Comparison of all known cell-cycle genes with expression in at least 5% of cells in Louvain component 8. Known cell-cycle expression is denoted for each gene, if unknown ‘?’. (C) Two kinases, AUR1 and AUR2, were specifically expressed in branch cells. These genes are involved in cell plate formation and lateral root formation.
Figure 7.
Figure 7.
Single-Cell RNA-Seq Highlights Canonical and Novel Aspects of the Heat-Shock Response. (A) A nearest-neighbor approach aligns control and heat-shocked cells in a UMAP embedding to allow for concomitant cluster/cell-type assignment. (B) Volcano plots of average gene expression change upon heat shock within Louvain component 2 for all genes (black), known hair marker genes (blue), and heat-shock signature genes (red). (C) HSP101, a signature heat-shock gene, shows dramatic increase of expression in all cell types upon heat shock. (D) COBL9, a well-studied hair marker gene, is strongly repressed upon heat shock. (E) Heat map of differentially expressed genes upon heat shock (top red bar; control, top gray bar), hierarchically clustered by both cells and genes (FDR < 0.1% and absolute value of the log2 fold change > 1). (F) “Upset” plot (Lex et al., 2014) of the number of differentially expressed genes as a function of heat shock for each Louvain cluster in our UMAP embedding (bars on top) along with the number of the intersect of differentially expressed genes between Louvain clusters (bars on the right). A surprising number of differentially expressed genes were specific to certain clusters (single dot in vertical row of dots).
None

Comment in

References

    1. Alexandre, C.M. , et al. (2018). Complex relationships between chromatin accessibility, sequence divergence, and gene expression in Arabidopsis thaliana . Mol. Biol. Evol. 35: 837–854. - PMC - PubMed
    1. Bargmann, B.O.R. , Birnbaum, K.D. (2010). Fluorescence activated cell sorting of plant protoplasts. J. Vis. Exp. 36: 1673. - PMC - PubMed
    1. Bennett, T. , van den Toorn, A. , Sanchez-Perez, G.F. , Campilho, A. , Willemsen, V. , Snel, B. , Scheres, B. (2010). SOMBRERO, BEARSKIN1, and BEARSKIN2 regulate root cap maturation in Arabidopsis. Plant Cell 22: 640–654. - PMC - PubMed
    1. Bhosale, R. , et al. (2018). A spatiotemporal DNA endoploidy map of the Arabidopsis root reveals roles for the endocycle in root development and stress adaptation. Plant Cell 30: 2330–2351. - PMC - PubMed
    1. Birnbaum, K. , Shasha, D.E. , Wang, J.Y. , Jung, J.W. , Lambert, G.M. , Galbraith, D.W. , Benfey, P.N. (2003). A gene expression map of the Arabidopsis root. Science 302: 1956–1960. - PubMed

Publication types