. 2019 Mar 28;9(1):5295.
doi: 10.1038/s41598-019-41659-3.

Evidence of Environmental Changes Caused by Chinese Island-Building

Affiliations

Evidence of Environmental Changes Caused by Chinese Island-Building

Leland Smith et al. Sci Rep. .

Abstract

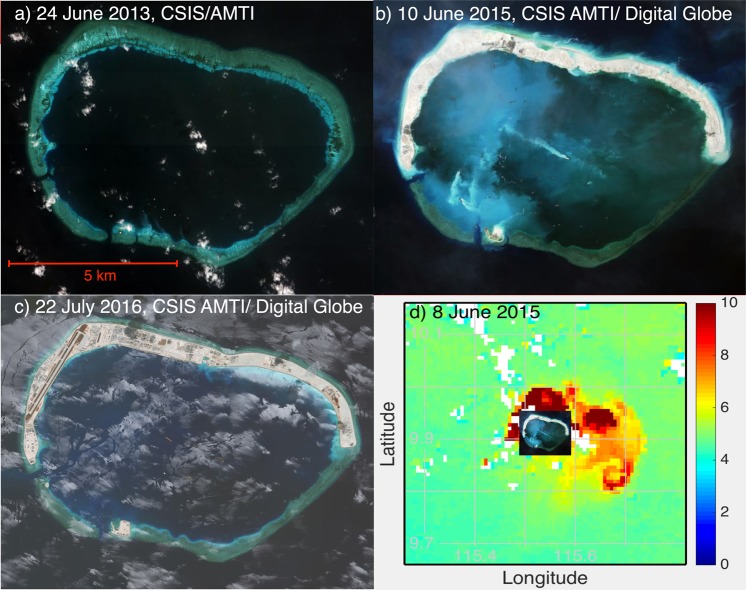
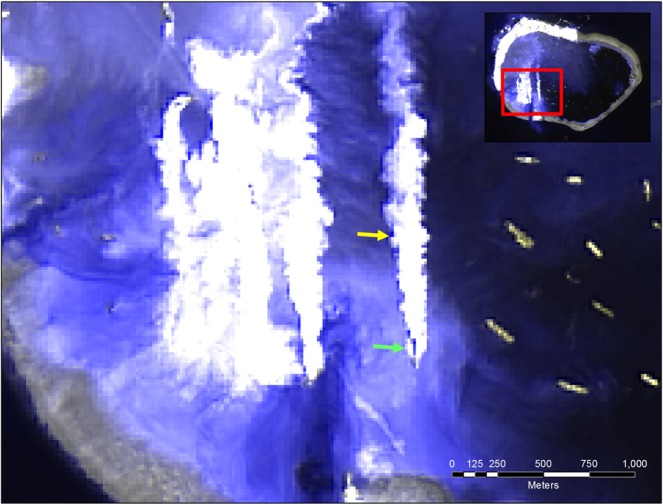
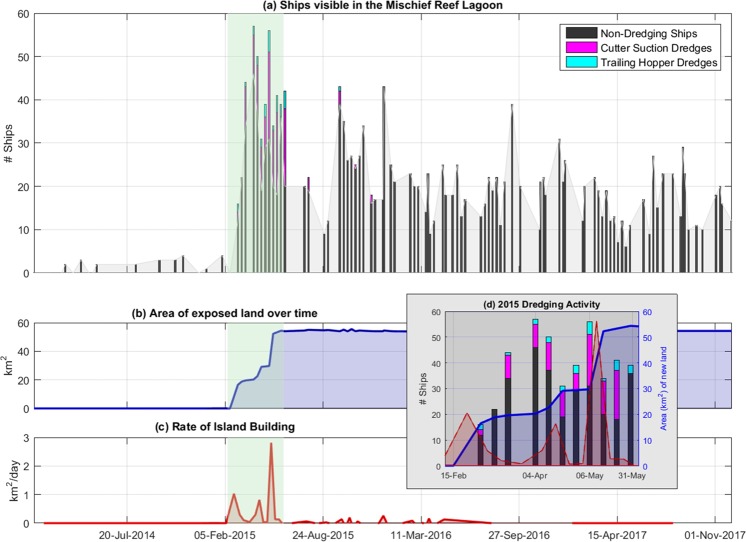
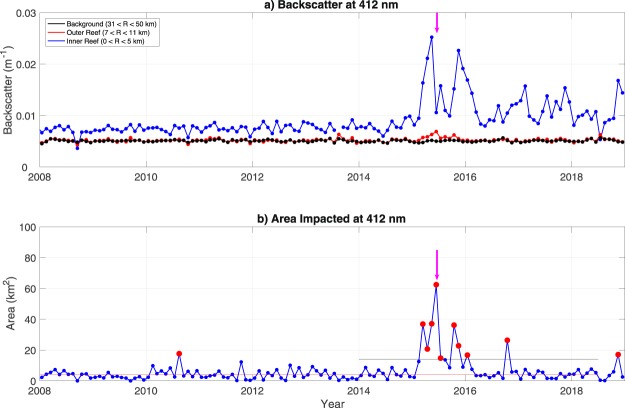
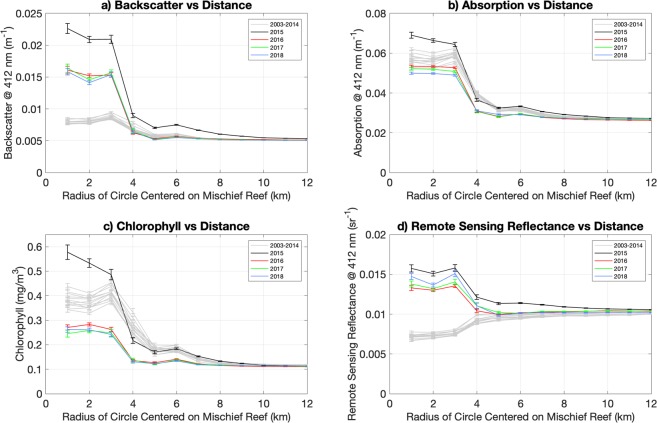
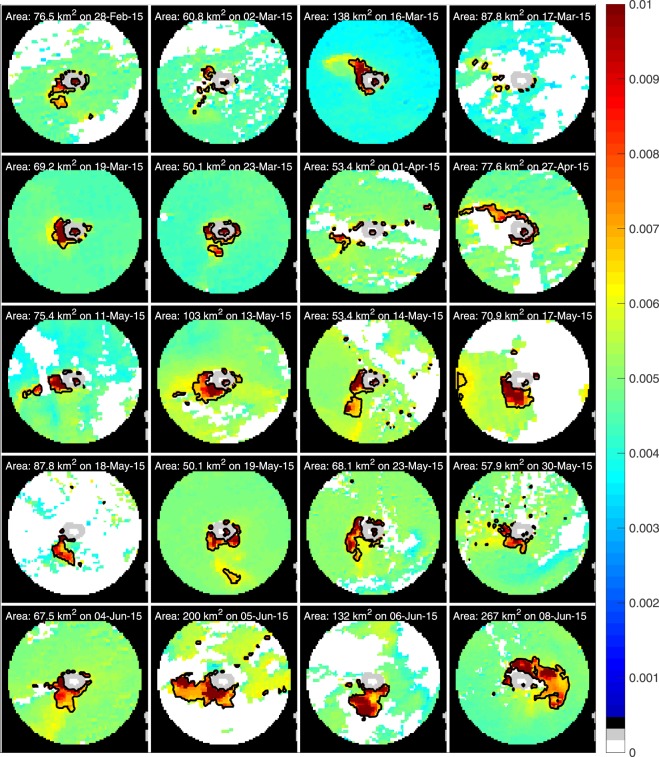
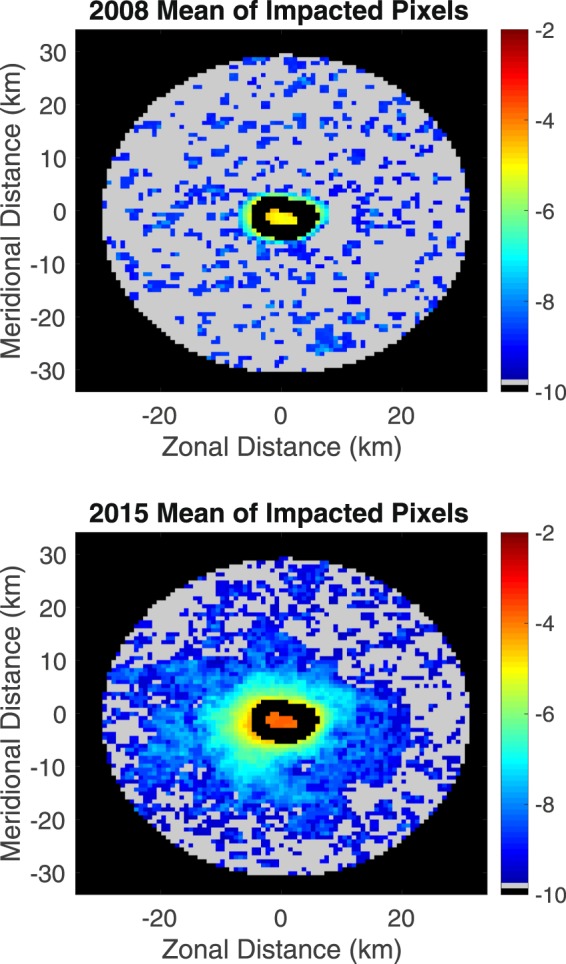
This paper quantifies environmental effects of island-building operations in the South China Sea, which result from dredging and can negatively impact marine flora, fauna, and ecosystems. The extent of the damage caused by island-creation is believed to be large, as the South China Sea reefs support the largest concentration of marine biodiversity on Earth. Through use of satellite imagery, we investigate the island-construction on Mischief Reef in the South China Sea, showing backscatter increases of up to 350% in waters surrounding the reef, with plumes of excess sediment exceeding 250 km2 at times during island-construction, and the cumulative area impacted by dredging exceeding 1,200 km2. Comparison of satellite-derived chlorophyll-a, backscatter, absorption and remote sensing reflectance at 412 nm suggest that dredging activities led to a decrease in biological health of the region resulting from the smothering of natural benthic habitats and reef complexes with sediment. We anticipate this ex post facto quantification of the connectivity between island-construction, large particulate plumes and a decrease in absorption related to marine life in the water column to establish a starting point for further study into ecosystem impact. The potential associations between these damages and a long-term reduction in ocean life and resources could serve inter-governmental bodies with a baseline metric for evaluating the level of damage caused. This may result in both forward-looking deterrent policies that limit island-building as well as backward-looking compensation.


Conflict of interest statement

D. Rudnickas was attending the University of Rhode Island (URI) while also serving in the U.S. Coast Guard but the views expressed herein are those of the authors and are not to be construed as official or reflecting the views of the Commandant or of the U.S. Coast Guard.

Figures

Figure 1
Figure 1
Progression of island building and ocean changes at Mischief Reef. High resolution imagery from the Asia Maritime Transparency Initiative at the Center for Strategic and International Studies shows (a) untouched Mischief Reef in 2013 Image© 2013 DigitalGlobe, Inc, (b) significant dredging activity evident in 2015, Image© 2015 DigitalGlobe, Inc (c) land development evident by 2016, Image© 2016 DigitalGlobe, Inc and, (d) Our analysis of Ocean Color imagery from the MODerate-resolution Imaging Spectroradiometer (MODIS)-Aqua indicates a large backscattering plume coincident with a time of high dredging activity evidenced in (b). The inset shows (b) to the scale of the ocean color image. [NASA Goddard Space Flight Center, Ocean Ecology Laboratory, Ocean Biology Processing Group; (2015): MODIS Aqua Ocean Color Data, NASA OB.DAAC. https://oceandata.sci.gsfc.nasa.gov/cgi/getfile/http_manifest.txt?h=ocdist103&p=/data2/c080a010e2fe8158. Accessed on 2017/04/27].
Figure 2
Figure 2
Cutter Suction Dredges identified by dredge pipes by OLI using bands 8-8-2 in RGB on May 6, 2015. The green and yellow arrows point to a sample dredge and pipeline, respectively. Landsat-8 imagery courtesy of the U.S. Geological Survey. This image was generated using ERDAS Imagine 2016®, which is a software product owned by Intergraph Corporation doing business as Hexagon Geopatial. © 2016 Hexagon and/or its subsidiaries and affiliates. All rights reserved.
Figure 3
Figure 3
Trailing Hopper Dredges identified by along-side plumes by OLI using bands 8-8-2 in RGB on May 6, 2015. The green and yellow arrows point to a sample dredge and resulting plume, respectively. Landsat-8 imagery courtesy of the U.S. Geological Survey. This image was generated using ERDAS Imagine 2016®, which is a software product owned by Intergraph Corporation doing business as Hexagon Geopatial. © 2016 Hexagon and/or its subsidiaries and affiliates. All rights reserved.
Figure 4
Figure 4
The results of the Landsat and Sentinel image analysis. (a) Shows the number of ships (dredging and non-dredging) in the lagoon from January 2014 through December 2017. (b) Shows the land area of the island building project. (c) Is the rate of dredging (calculated as the change in land area between usable satellite images). (d) Is a subset of the high activity dredging timeframe from February through May 2015 identified in (ac) by the green shading.
Figure 5
Figure 5
Monthly (a) backscatter average in the vicinity of Mischief Reef and (b) area impacted in the annulus between 7 and 30 km. Magenta arrows are the values for 8 June 2015. The horizontal red line in the lower panel is the mean area ‘impacted’, resulting from natural variability in the system, prior to 2013 and the gray line is 3 standard deviations above this mean.
Figure 6
Figure 6
Ocean color parameters by time period as a function of distance from Mischief Reef. (a) Backscatter at 412 nm, (b) Absorption at 412 nm, (c) Chlorophyll Concentration and (d) Remote Sensing Reflectance at 412 nm. All are averaged over 1 km annular rings as a function of distance from the center of Mischief Reef for one-year periods starting with 1 January 2003. Lines for years prior to 2015 are shown in gray, the line for 2015 - the period of significant dredging - is shown in black and lines for the period following significant dredging are shown in color.
Figure 7
Figure 7
Backscatter at 412 nm within 30 km of Mischief Reef (light gray) on selected days in early 2015. Flagged pixels are indicated in white. The area for which the backscatter >130% of the mean value between 31 and 50 km from the reef center indicated in the heading of each frame. The 0.0064 m−1 contours indicated in black. These contours designate the approximate extent of the plume on which the area estimate is based; approximate because the precise contour is determined from the mean concentration of the ‘background’, which changes slightly from image-to-image.
Figure 8
Figure 8
The natural logarithm of the annual mean backscatter of impacted pixels for 2008 (upper panel) and 2015 (lower panel) as a function of distance from Mischief Reef (black elliptical area at the center of the image). Pixels not flagged as impacted at any time during the given year shown in gray.

References

    1. Permanent Court of Arbitration in the Hague. Annex 799-800. the magic dredge pumping artifact ‘tianjing hao’, a great meritorious machine in china’s land reclamation in nansha (2015a).
    1. Ferse, S., Mumby, P. & Ward, S. Expert report: Assessment of the potential environmental consequences of construction activities on seven reefs in the spratly islands in the south china sea. Tech. Rep., Permanent Court of Arbitration (2017).
    1. Beech, H. The environment is the silent casualty of Beijing’s ambitions in the South China Sea. (2016).
    1. Center for Strategic and International Studies. Island tracker (2017a).
    1. Crowe SE, Bergquist DC, Sanger D, Van Dolah R. Physical and biological alterations following dredging in two beach nourishment borrow areas in south carolina’s coastal zone. J. COastal Res. 2016;32(4):875–889. doi: 10.2112/JCOASTRES-D-15-00075.1. - DOI