. 2019 Mar 14:10:207.
doi: 10.3389/fgene.2019.00207. eCollection 2019.

Microsatellite Diversity, Complexity, and Host Range of Mycobacteriophage Genomes of the Siphoviridae Family

Affiliations

Microsatellite Diversity, Complexity, and Host Range of Mycobacteriophage Genomes of the Siphoviridae Family

Chaudhary Mashhood Alam et al. Front Genet. .

Abstract

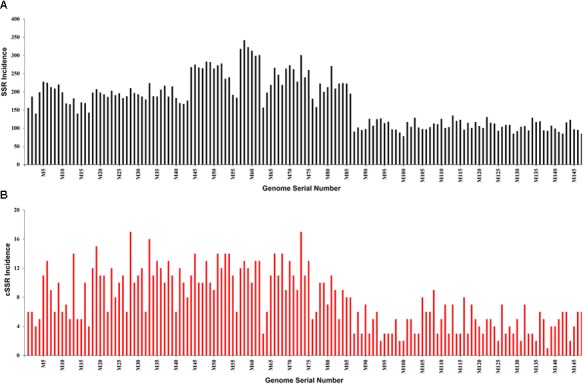
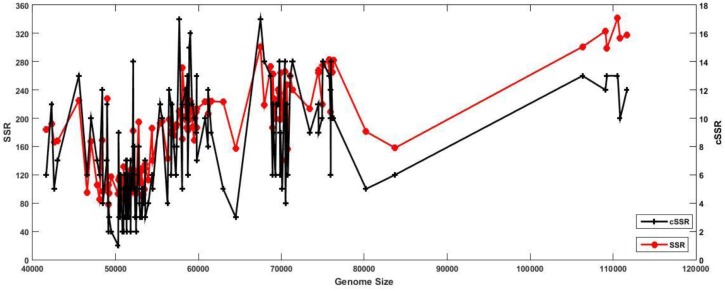
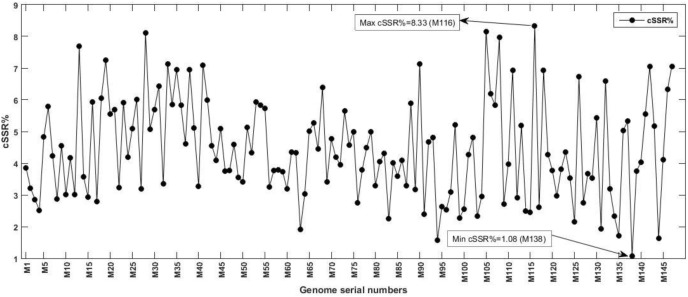
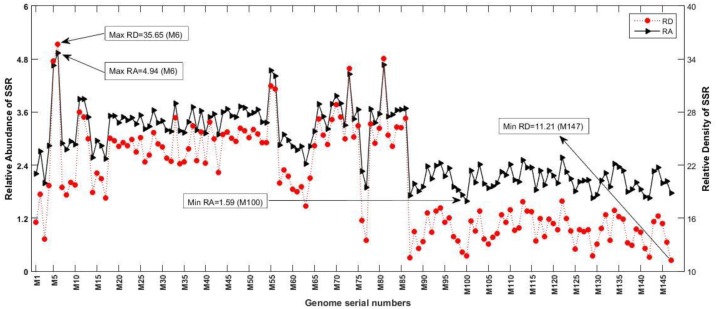
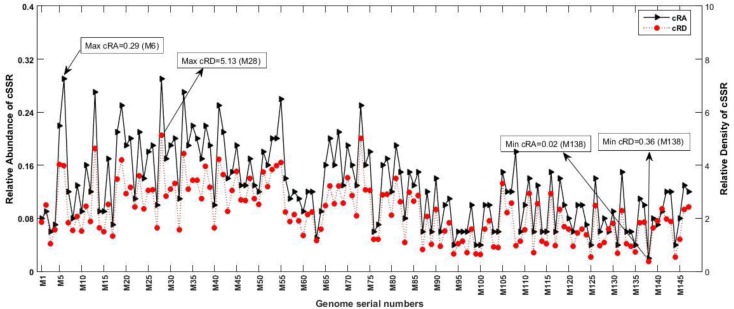
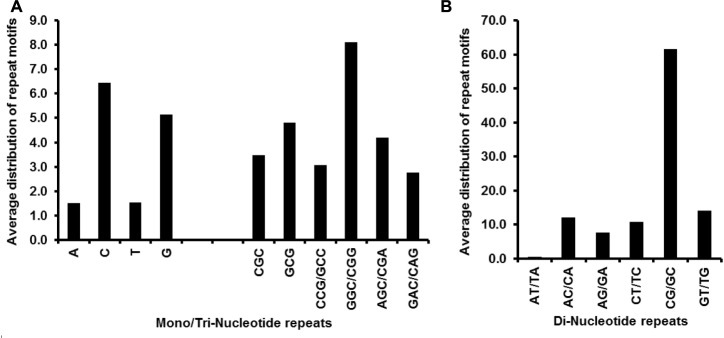
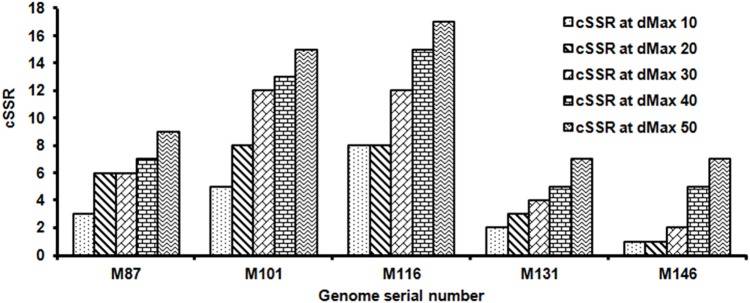
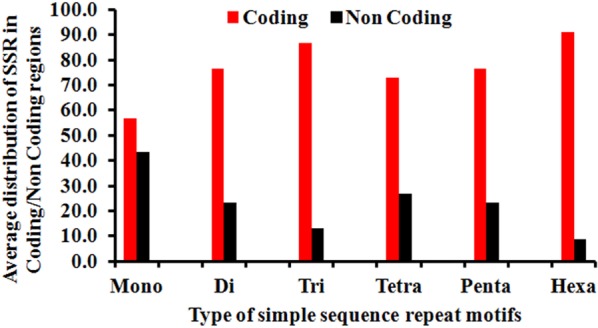
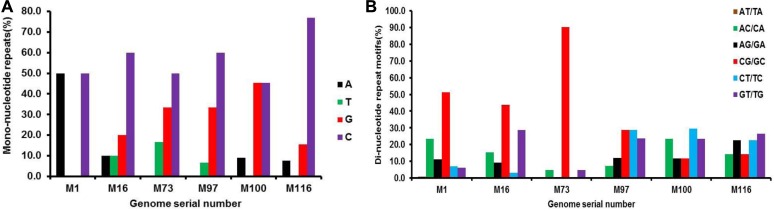
The incidence, distribution, and variation of simple sequence repeats (SSRs) in viruses is instrumental in understanding the functional and evolutionary aspects of repeat sequences. Full-length genome sequences retrieved from NCBI were used for extraction and analysis of repeat sequences using IMEx software. We have also developed two MATLAB-based tools for extraction of gene locations from GenBank in tabular format and simulation of this data with SSR incidence data. Present study encompassing 147 Mycobacteriophage genomes revealed 25,284 SSRs and 1,127 compound SSRs (cSSRs) through IMEx. Mono- to hexa-nucleotide motifs were present. The SSR count per genome ranged from 78 (M100) to 342 (M58) while cSSRs incidence ranged from 1 (M138) to 17 (M28, M73). Though cSSRs were present in all the genomes, their frequency and SSR to cSSR conversion percentage varied from 1.08 (M138 with 93 SSRs) to 8.33 (M116 with 96 SSRs). In terms of localization, the SSRs were predominantly localized to coding regions (∼78%). Interestingly, genomes of around 50 kb contained a similar number of SSRs/cSSRs to that in a 110 kb genome, suggesting functional relevance for SSRs which was substantiated by variation in motif constitution between species with different host range. The three species with broad host range (M97, M100, M116) have around 90% of their mono-nucleotide repeat motifs composed of G or C and only M16 has both A and T mononucleotide motifs. Around 20% of the di-nucleotide repeat motifs in the genomes exhibiting a broad host range were CT/TC, which were either absent or represented to a much lesser extent in the other genomes.

Keywords: Mycobacteriophage; dMAX; host range; imperfect microsatellite extractor; simple sequence repeats.


Figures

FIGURE 1
FIGURE 1
(A) Incidence of SSRs and (B) cSSRs in the studied Mycobacteriophage genomes. Note the highest SSR and cSSR incidence of 342 (M58) and 78 (M100) whereas corresponding values for cSSR are 17 (M28) and 1 (M138) respectively.
FIGURE 2
FIGURE 2
Relation between genome size and SSR/cSSR incidence. The presence of some of the highest peaks (SSR/cSSR incidence) on the far left of the X-axis (smaller genome size) are a clear indication of comparable SSR incidences across varying length of genomes, thus implying their functional significance.
FIGURE 3
FIGURE 3
Compound SSRs % in the studied Mycobacteriophage genomes. The percentage of individual microsatellites that are part of a compound microsatellite is represented by cSSR %. Note the presence of highest cSSR% of 8.33 in M116 with just 96 SSRs (Supplementary Table 1), representing uneven distribution of SSRs, suggestive of functional relevance.
FIGURE 4
FIGURE 4
Relative abundance (RA) and relative density (RD) of SSRs. RA is the number of microsatellites present per kb of the genome whereas RD is the sequence space composed of SSRs of microsatellites per kb of the genome. The variations in these variables represent incidence and distribution of these sequences across genomes.
FIGURE 5
FIGURE 5
Relative abundance (cRA) and relative density (cRD) of cSSRs. cRA is the number of compound microsatellites present per kb of the genome whereas cRD is the sequence space composed of cSSRs per kb of the genome.
FIGURE 6
FIGURE 6
(A) Average distribution of mono- and tri-nucleotide repeat motifs and (B) di-nucleotide repeat motifs. The most prevalent mono-, di- and tri-nucleotide repeat motifs are “C”, “CG/GC,” and “GGC/CGG” respectively, which corroborates with the GC rich nature of the studied genomes.
FIGURE 7
FIGURE 7
Frequency of cSSR in relation to varying dMAX (10–50) across five randomly selected Mycobacteriophage genomes. A higher cSSR incidence with increasing dMAX in the genomes is along expected lines but the non-linearity of the increase across species is suggestive of genome specific clustering of SSRs.
FIGURE 8
FIGURE 8
Differential distribution of SSRs (%) in coding vs. non-coding regions. In the figure “gp” represents “ORF”. The 15 most conserved “gp” were included in this figure, “NC” represents non-coding and “Others” represent in remaining “gp” (179). The numbers in percentage represent the fraction of SSRs that can be attributed to that specific sequence across genomes.
FIGURE 9
FIGURE 9
Differential distribution of individual SSR (%) from Mono to Hexanucleotide in coding vs. non-coding regions. The figure very clearly illustrates the extreme bias of hexanucleotide repeats incidence in coding regions. This was followed by trinucleotide repeats whereas the least bias was observed in case of mononucleitide repeats.
FIGURE 10
FIGURE 10
Dot plot analysis of six Mycobacteriophage genomes, three with broad host range and three with restricted host range. Repeats within a single genome are depicted as dots, which extend into lines with as the repeats extend. Lines off the center line of the global comparison indicate sequence conservation between Mycobacteriophage genomes.
FIGURE 11
FIGURE 11
Composition of (A) mononucleotide and (B) dinucleotide repeat motifs in six Mycobacteriophage genomes selected by their host range. The broad host range species M97, M100, M116 have extremely high prevalence of mono-nucleotide repeat motifs G/C. These species have ∼20% of the di-nucleotide repeat motifs CT/TC, which are either absent or comparatively much less represented (<10%) in the others with narrow host range.

References

    1. Alam C. M., Singh A. K., Sharfuddin C., Ali S. (2013). In-silico analysis of simple and imperfect microsatellites in diverse tobamovirus genomes. Gene 530 193–200. 10.1016/j.gene.2013.08.046 - DOI - PubMed
    1. Alam C. M., Singh A. K., Sharfuddin C., Ali S. (2014a). Genome-wide scan for analysis of simple and imperfect microsatellites in diverse carlaviruses. Infect. Genet. Evol. 21 287–294. 10.1016/j.meegid.2013.11.018 - DOI - PubMed
    1. Alam C. M., Singh A. K., Sharfuddin C., Ali S. (2014b). In- silico exploration of thirty alphavirus genomes for analysis of the simple sequence repeats. Meta Gene 2 694–705. 10.1016/j.mgene.2014.09.005 - DOI - PMC - PubMed
    1. Alam C. M., Singh A. K., Sharfuddin C., Ali S. (2014c). Incidence, complexity and diversity of simple sequence repeats across potexvirus genomes. Gene 537 189–196. 10.1016/j.gene.2014.01.007 - DOI - PubMed
    1. Brüssow H., Hendrix R. W. (2002). Phage Genomics. Cell 108 13–16. 10.1016/S0092-8674(01)00637-7 - DOI - PubMed

LinkOut - more resources