

Investigation of direct counting and sizing of DNA fragments in flow applying an improved data analysis and correction method
- PMID: 30923678
- PMCID: PMC6423501
- DOI: 10.1016/j.bdq.2019.100083
Investigation of direct counting and sizing of DNA fragments in flow applying an improved data analysis and correction method
Abstract
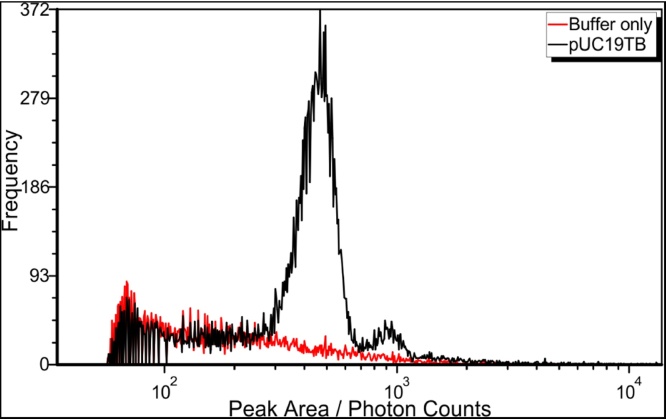
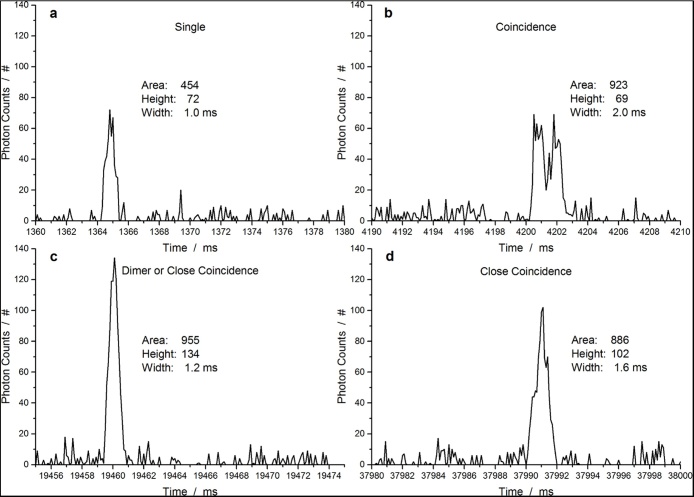
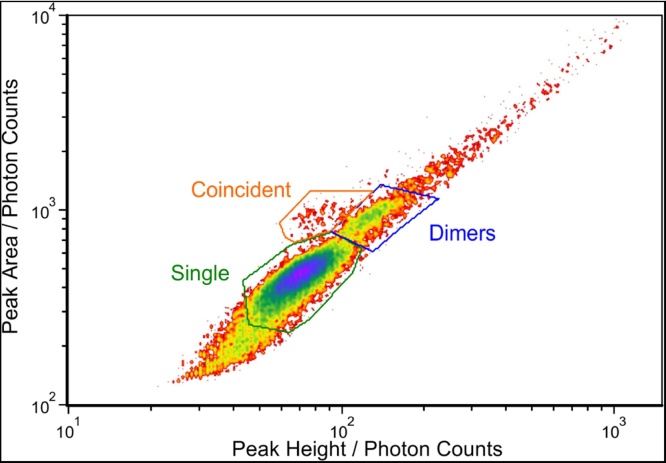
Direct detection of single stained DNA fragments in flow is a very sensitive method for nucleic acid detection which does not need any amplification process. We have developed an instrument for direct counting and sizing of single DNA fragments (single or double stranded DNA) in flow with integrated sample volume measurement for concentration determination. As the method is a potential reference method for DNA quantification, processes affecting the measurement uncertainty are of major interest. Additionally, comparison of this method to the orthogonal method of digital PCR is useful with the restriction of low specificity of the direct detection method. In this study, we analysed raw detector signals and the sizing performance for target identification and the effect of coincidence detection concerning concentration measurements. We present data of purified artificial DNA samples measured with the home-built setup. Main emphasis was to develop an improved data analysis method to gain insight into and carefully correct for coincident detection of DNA fragments and for estimation of the amount of fragment dimers.
Keywords: DNA-copy concentration; Enumeration based quantification; Flow cytometric counting; Metrology; Molecular quantification; dPCR.
Figures


References
-
- Yoo H.-B., Park S.-R., Dong L., Wang J., Sui Z., Pavšič J., Milavec M., Akgoz M., Mozioğlu E., Corbisier P., Janka M., Cosme B., de J.J., Cavalcante V., Flatshart R.B., Burke D., Forbes-Smith M., McLaughlin J., Emslie K., Whale A.S., Huggett J.F., Parkes H., Kline M.C., Harenza J.L., Vallone P.M. International comparison of enumeration-based quantification of DNA copy-concentration using flow cytometric counting and digital polymerase chain reaction. Anal. Chem. 2016;88(24):12169–12176. - PubMed
-
- Huggett J.F., Foy C.A., Benes V., Emslie K., Garson J.A., Haynes R., Hellemans J., Kubista M., Mueller R.D., Nolan T., Pfaffl M.W., Shipley G.L., Vandesompele J., Wittwer C.T., Bustin S.A. The digital MIQE guidelines: Minimum information for publication of quantitative digital PCR experiments. Clin. Chem. 2013;59(6):892–902. - PubMed
-
- Castro A., Fairfield F.R., Shera E.B. Fluorescence detection and size measurement of single DNA molecules. Anal. Chem. 1993;65(7):849–852.
-
- Petty J.T., Johnson M.E., Goodwin P.M., Martin J.C., Jett J.H., Keller R.A. Characterization of DNA size determination of small fragments by flow cytometry. Anal. Chem. 1995;67(10):1755–1761.
LinkOut - more resources
Full Text Sources
Research Materials