. 2019 Jun 20;47(11):e66.
doi: 10.1093/nar/gkz204.

Cell lineage and communication network inference via optimization for single-cell transcriptomics

Affiliations

Cell lineage and communication network inference via optimization for single-cell transcriptomics

Shuxiong Wang et al. Nucleic Acids Res. .

Abstract

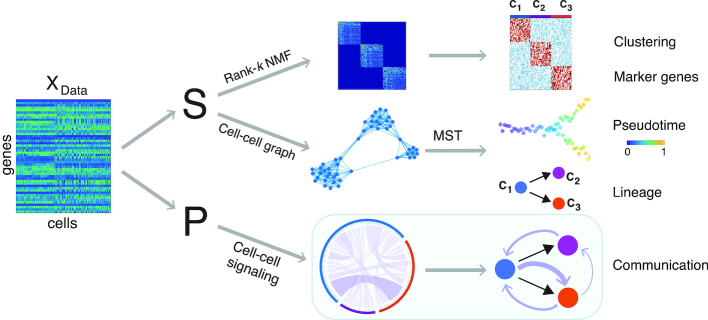
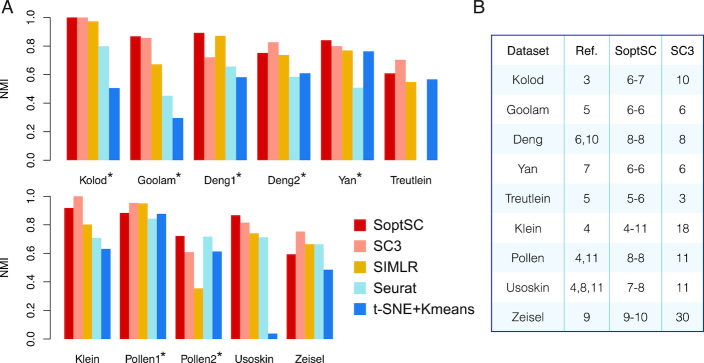
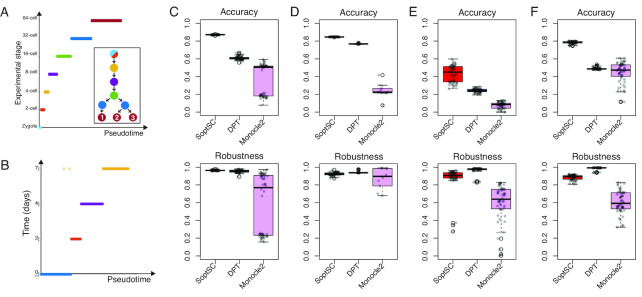
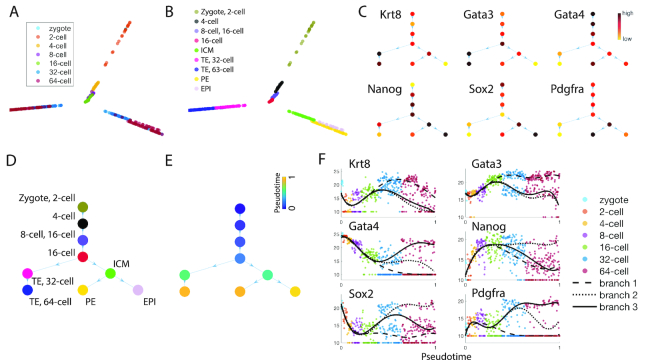
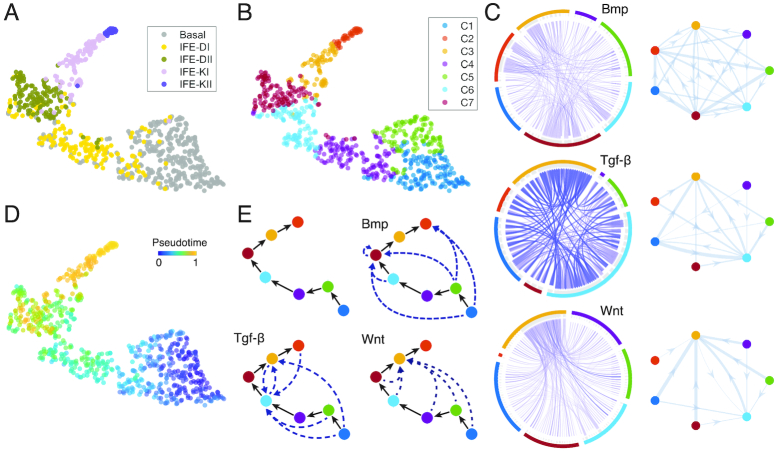
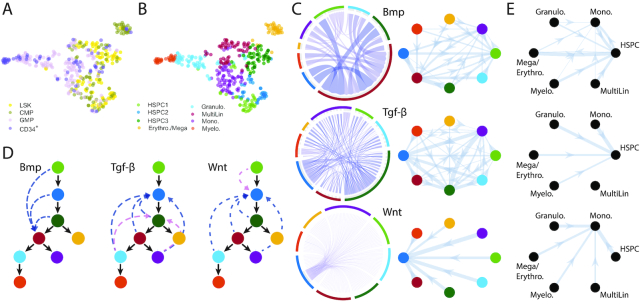
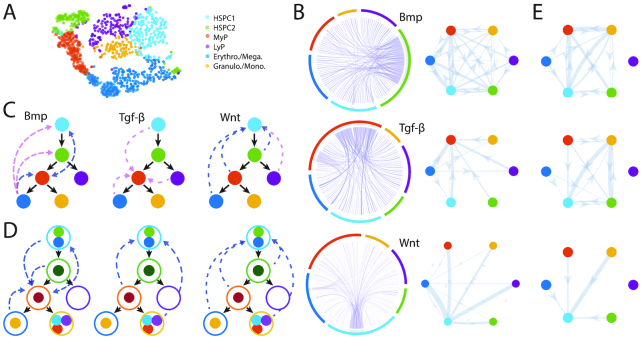
The use of single-cell transcriptomics has become a major approach to delineate cell subpopulations and the transitions between them. While various computational tools using different mathematical methods have been developed to infer clusters, marker genes, and cell lineage, none yet integrate these within a mathematical framework to perform multiple tasks coherently. Such coherence is critical for the inference of cell-cell communication, a major remaining challenge. Here, we present similarity matrix-based optimization for single-cell data analysis (SoptSC), in which unsupervised clustering, pseudotemporal ordering, lineage inference, and marker gene identification are inferred via a structured cell-to-cell similarity matrix. SoptSC then predicts cell-cell communication networks, enabling reconstruction of complex cell lineages that include feedback or feedforward interactions. Application of SoptSC to early embryonic development, epidermal regeneration, and hematopoiesis demonstrates robust identification of subpopulations, lineage relationships, and pseudotime, and prediction of pathway-specific cell communication patterns regulating processes of development and differentiation.


Figures

Figure 1.
Figure 1.
Overview of the SoptSC framework and outputs generated. SoptSC takes a gene expression matrix X as an input and learns a proper cell-to-cell similarity matrix S. Cell clustering is carried out by performing non-negative matrix factorization on S. Marker genes for each cluster are found via the product of the factorized latent matrix and X. A cell–cell graph (constructed from S) is used to infer pseudotime by calculating the shortest path distance between cells on this graph. The lineage relationships are constructed via a minimum spanning tree over the cluster–cluster graph derived from the cell–cell graph. Cell-cell communication is predicted by SoptSC via cell–cell signaling probabilities that are based on single-cell gene expression of specific genes within a pathway in sender-receiver cell pairs.
Figure 2.
Figure 2.
Benchmarking SoptSC against current methods for clustering. (A) Five clustering methods (SoptSC, SC3, SIMLR, Seurat, and t-SNE + k-means) are applied to a range of single-cell datasets where cell cluster labels are known or were previously validated. Normalized mutual information (NMI) is used as a measure of accuracy. Datasets marked by an asterisk are annotated ‘gold-standard’ for comparison purposes. (B) Prediction of the number of clusters by SoptSC or SC3, compared to a reference number of clusters (Ref.) from the original study; SoptSC predicts both lower and upper bounds.
Figure 3.
Figure 3.
Assessment of SoptSC for pseudotime inference. (A) Pseudotemporal ordering of data from mouse early embryo development (55) is compared with the known biological stage. Inset shows the lineage inferred by SoptSC, colored by experimental stage of origin for each cluster. (B) Pseudotemporal ordering of embryonic stem cell data from (52) compared with experimental time. (C) Comparison of three methods for pseudotime inference with data from (55) using the Kendall rank correlation between pseudotime and experimental stage as a measure of accuracy, and by subsampling 90% of cells from the data 50 times (and comparison of subsets) to measure robustness. (D) Comparison as for (C) with embryonic stem cell data from (52). (E) Comparison as for (C) with bone-marrow-derived dendritic cells (56). (F) Comparison as for (C) with cells from the murine epidermis (32). Here the accuracy is measured by comparison with the pseudotime inferred in the original study.
Figure 4.
Figure 4.
Inference of cell lineage and pseudotime during early embryonic development. (A) Visualization of data from mouse early embryonic development (55) by SoptSC, colored by the experimental labels from the original study. (B) Nine clusters were identified by SoptSC; labels were ascribed following marker gene expression profiling. (C) Lineage tree inferred by SoptSC, with average inter-cluster expression of selected markers shown. (D) Lineage relationships inferred by SoptSC, colored by clusters from (B), and labeled by the identified experimental stages from (A). (E) Pseudotime projected onto the lineage tree. (F) Marker genes plotted along pseudotime; lines correspond to polynomial regression for each branch. TE: Trophectoderm; PE: Primitive Endoderm; EPI: Epiblast.
Figure 5.
Figure 5.
Inference of epidermal lineage and signaling networks. (A) Cells from (32) projected into low dimension by SoptSC and colored by the cluster labels from the original study. (B) Cells colored by cluster labels identified by SoptSC. (C) Single-cell communication networks predicted for three pathways. Left: samples from full networks where edge weights represent the probability of signaling between cells. Right: cluster-to-cluster signaling interactions where edge weights represent sums over inter-cluster interactions. Colors correspond to cluster labels from part b. (D) Pseudotemporal ordering of cells. (E) SoptSC infers a linear lineage from basal to differentiated epidermal cells (top left). Summaries of the cluster-to-cluster signaling interactions with highest probability are given for the Bmp, Tgf-β and Wnt pathways.
Figure 6.
Figure 6.
Inference of subpopulations, pseudotime, lineage paths and signaling networks during myelopoiesis. (A) Cells from (33) projected into low dimension by SoptSC and colored by the cluster labels from the original study. LSK: LinSca1+c-Kit+; CMP: common myeloid progenitor; GMP: granulocyte monocyte progenitor; CD34+: LSK CD34+ cells. (B) Cells colored by cluster labels identified by SoptSC. (C) Single-cell communication networks predicted for three pathways. Left: samples from full networks where edge weights represent the probability of signaling between cells. Right: cluster-to-cluster signaling interactions where edge weights represent sums over inter-cluster interactions. Colors correspond to cluster labels from part B. (D) Lineage inferred by SoptSC. Summaries of the cluster-to-cluster signaling interactions with highest probability are given for the Bmp, Tgf-β, and Wnt pathways. Blue: signaling prediction is supported by literature; pink: new signaling prediction. (E) Comparison of cluster-to-cluster signaling networks for Bmp, Tgf-β and Wnt (top down). Signaling probabilities from part (C) plotted on clusters identified in Seurat. Cluster identities ascribed via marker gene expression.
Figure 7.
Figure 7.
Inference of subpopulations, pseudotime, lineage paths and signaling networks for mouse hematopoietic stem cell differentiation. (A) Visualization and clustering of cells from HSPCs (34) by SoptSC. MyP: Myeloid Progenitor; LyP: Lymphoid Progenitor. (B) Single-cell signaling networks predicted for three pathways. Left: samples from full networks where edge weights represent the probability of signaling between cells. Right: cluster-to-cluster signaling interactions where edge weights represent sums over inter-cluster interactions. Colors correspond to cluster labels from part A. (C) Lineage inferred by SoptSC. Summaries of the cluster-to-cluster signaling interactions with highest probability are given for the Bmp, Tgf-β, and Wnt pathways. Blue: signaling prediction supported by literature; pink: new signaling prediction. (D) Comparison of lineage and signaling predictions from Olsson and Nesterowa datasets. Consensus lineage shown: solid circles for Olsson clusters (correspond to Figure 6); open circles for Nesterowa clusters. Edges denote signaling predictions made either for Olsson or Nesterowa data analysis that are supported by evidence from literature. (E) Signaling probabilities from Olsson data are plotted on the consensus lineage from panel (D), enabling direct comparison of predicted cluster–cluster communication between Olsson and Nesterowa (panel B).

References

    1. Moris N., Pina C., Martinez Arias A.. Transition states and cell fate decisions in epigenetic landscapes. Nat. Rev. Genet. 2016; 17:693–703. - PubMed
    1. MacLean A.L., Hong T., Nie Q.. Exploring intermediate cell states through the lens of single cells. Curr. Opin. Syst. Biol. 2018; 9:32–41. - PMC - PubMed
    1. Svensson V., Vento-Tormo R., Teichmann S.A.. Exponential scaling of single-cell RNA-seq in the past decade. Nat. Protoc. 2018; 13:599–604. - PubMed
    1. Angerer P., Simon L., Tritschler S., Wolf F.A., Fischer D., Theis F.J.. Single cells make big data: New challenges and opportunities in transcriptomics. Curr. Opin. Syst. Biol. 2017; 4:85–91.
    1. Mohammed H., Hernando-Herraez I., Savino A., Scialdone A., Macaulay I., Mulas C., Chandra T., Voet T., Dean W., Nichols J. et al. .. Single-cell landscape of transcriptional heterogeneity and cell fate decisions during mouse early gastrulation. Cell Rep. 2017; 20:1215–1228. - PMC - PubMed

Publication types