. 2019 Jun;21(6):2148-2170.
doi: 10.1111/1462-2920.14608. Epub 2019 May 13.

Closely related viruses of the marine picoeukaryotic alga Ostreococcus lucimarinus exhibit different ecological strategies

Affiliations

Closely related viruses of the marine picoeukaryotic alga Ostreococcus lucimarinus exhibit different ecological strategies

Amy E Zimmerman et al. Environ Microbiol. 2019 Jun.

Abstract

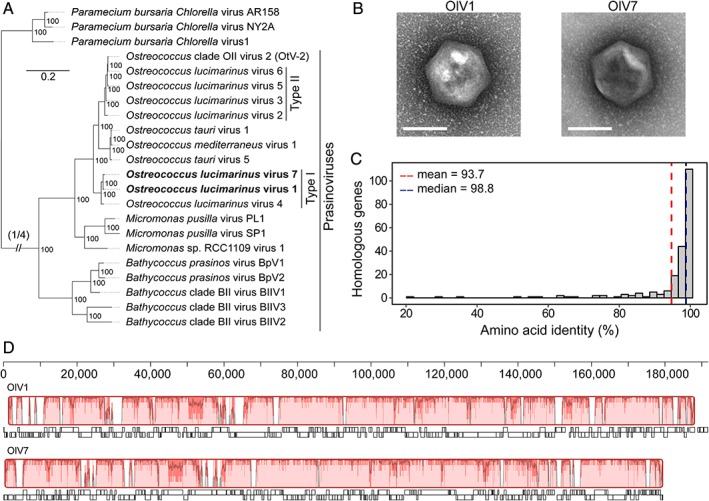
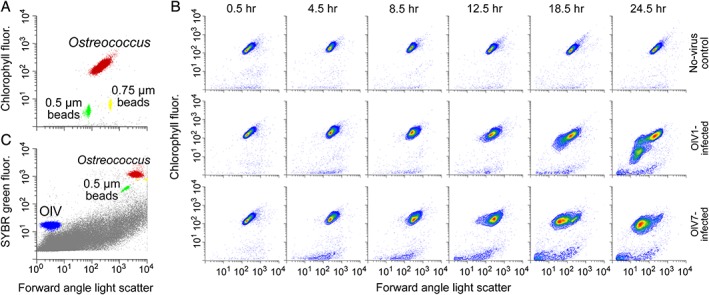
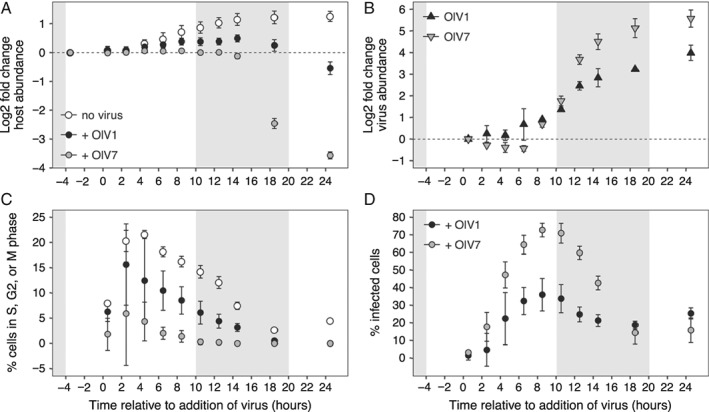
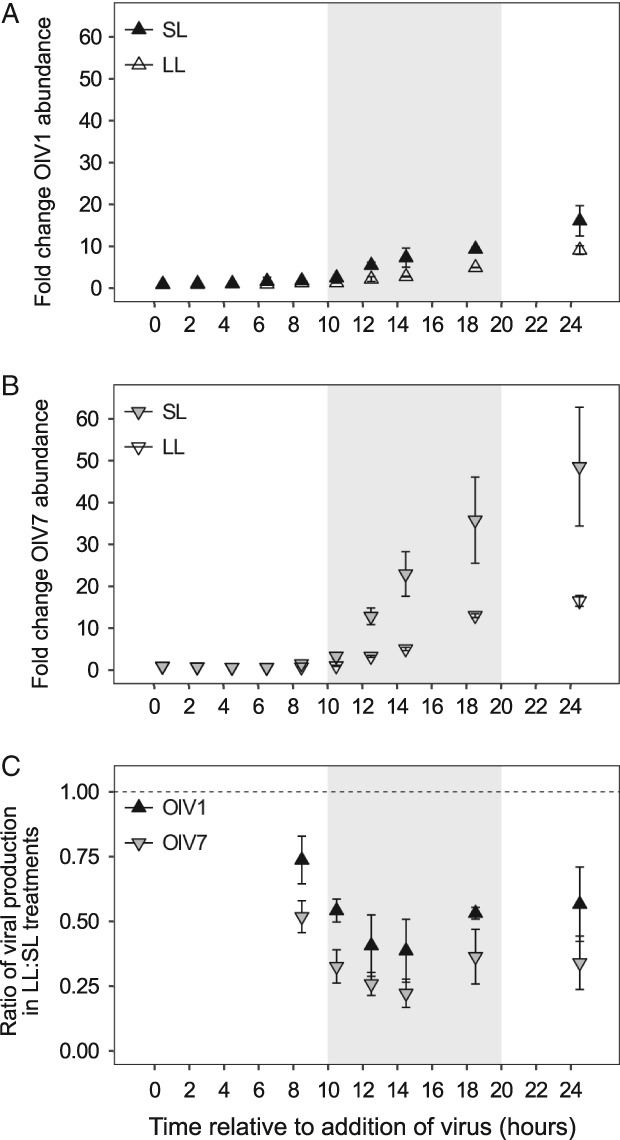
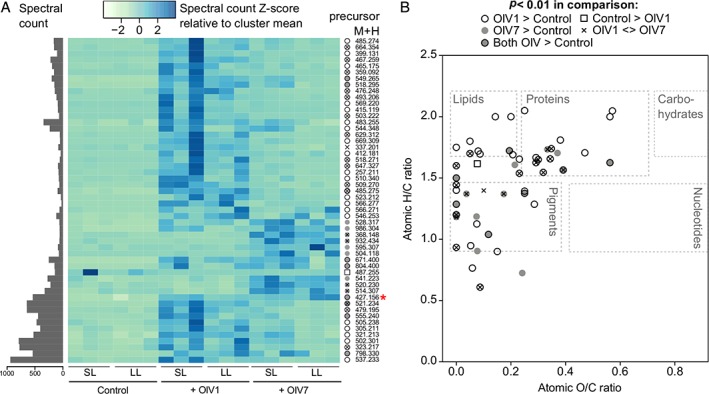
In marine ecosystems, viruses are major disrupters of the direct flow of carbon and nutrients to higher trophic levels. Although the genetic diversity of several eukaryotic phytoplankton virus groups has been characterized, their infection dynamics are less understood, such that the physiological and ecological implications of their diversity remain unclear. We compared genomes and infection phenotypes of the two most closely related cultured phycodnaviruses infecting the widespread picoprasinophyte Ostreococcus lucimarinus under standard- (1.3 divisions per day) and limited-light (0.41 divisions per day) nutrient replete conditions. OlV7 infection caused early arrest of the host cell cycle, coinciding with a significantly higher proportion of infected cells than OlV1-amended treatments, regardless of host growth rate. OlV7 treatments showed a near-50-fold increase of progeny virions at the higher host growth rate, contrasting with OlV1's 16-fold increase. However, production of OlV7 virions was more sensitive than OlV1 production to reduced host growth rate, suggesting fitness trade-offs between infection efficiency and resilience to host physiology. Moreover, although organic matter released from OlV1- and OlV7-infected hosts had broadly similar chemical composition, some distinct molecular signatures were observed. Collectively, these results suggest that current views on viral relatedness through marker and core gene analyses underplay operational divergence and consequences for host ecology.


Figures

Figure 1
Figure 1
Comparisons of Ostreococcus lucimarinus viruses OlV1 and OlV7. A. Maximum‐likelihood phylogenetic tree of green algal viruses inferred from a concatenated amino acid alignment of 22 shared ‘core algal virus proteins’ (7001 positions). Viruses studied herein are highlighted in bold, and Chlorovirus were used as an outgroup (grey). Bootstrap support reflects the percent of 100 replicates. Note that OtV‐2 was originally misnamed as being an O. tauri virus, but was isolated against RCC393, an Ostreococcus Clade OII species (sensu Simmons et al., 2015; Clade B sensu Guillou et al., 2004). B. Transmission electron micrographs of OlV1 and OlV7 (scale bar, 100 nm). OlV1 capsids measured 146 ± 1 nm and OlV7 measured 140 ± 4 nm in diameter (n = 5 virions). C. A histogram of percent amino acid identity for 212 orthologous genes identified in OlV1 and OlV7 genomes by reciprocal BLAST (minimum identity of 20%, minimum coverage of 50% of the shorter sequence). The mean (93.7%, red dashed line) and median (98.8%, blue dashed line) identities are indicated. D. Synteny analysis based on the alignment of OlV1 and OlV7 annotated genome sequences. Alignment is shown relative to nucleotide position in OlV1 genome. Boxes with identical colours represent Local Colinear Blocks, indicating homologous DNA regions without sequence rearrangements. Similarity profiles (trace) show average level of conservation at each position. Annotated genes (white boxes below each genome) are shown with genes in the forward (boxes above black line) and reverse directions (boxes below black line) indicated.
Figure 2
Figure 2
Representative flow cytometry plots. A. Discrimination of O. lucimarinus host populations based on chlorophyll autofluorescence (692 nm) versus forward angle light scatter (FALS). B. Discrimination of OlV virus populations based of green (SYBR) fluorescence (520 nm) versus FALS. The host population (red) and virus population (blue) are shown along with beads used for normalization (yellow and green) and background events (grey, possibly cell debris or media components). C. Chlorophyll fluorescence versus FALS over the infection cycle for non‐infected control, OlV1‐infected, and OlV7‐infected cultures acclimated to 105–115 μmol photons m−2 s−2 irradiance (SL). Note that both x‐ and y‐axes are plotted on a log scale.
Figure 3
Figure 3
Growth of host cultures acclimated to 105–115 μmol photons m−2 s−2 irradiance and viral life cycle of OlV1 and OlV7 resolved by analytical flow cytometry. A. Growth curves of algal hosts without viruses (open circles) and with addition of OlV1 (black circles) or OlV7 (grey circles), shown as the log2 fold change in abundance (equivalent to number of generations during exponential growth) since dawn (T‐4 h). B. OlV1 (black triangles) and OlV7 (grey triangles) abundance over the infection cycle shown as the log2 fold change relative to the time viruses were added to cultures (T = 0 h). C. Percentages of algal cells that were actively dividing (sum of cells in S, G2 or M phases) as inferred from cell cycle analysis of SYBR‐stained samples. The growth of OlV1‐ and OlV7‐infected cultures relative to non‐infected cultures in panel A was used to calculate the percentages of dividing cells in infected cultures at each time point from non‐infected culture values (see methods for more details). D. The percentages of infected host cells were inferred from SYBR‐stained samples, after accounting for cells in S, G2 and M phases of the cell cycle. Points show mean ± standard deviation of biological replicates (n = 3). Shaded areas indicate dark period in 14:10 h diel cycle.
Figure 4
Figure 4
Response of viral production to host cultures acclimated to 105–115 μmol photons m−2 s−2 irradiance (SL, 0.76 ± 0.06 day−1 growth rate at time of infection) or shifted to 15 μmol photons m−2 s−2 irradiance (LL, 0.091 ± 0.082 day−1 growth rate at time of infection). A,B. Viral production is shown for SL (filled triangles) and LL (open triangles) treatments as the fold change in virion abundance relative to abundance at T = 0 h to account for the different initial concentrations of total virions added to OlV1‐ vs. OlV7‐infected cultures (Table 1). C. The relative sensitivity of OlV1 (black triangles) and OlV7 (grey triangles) to host growth at reduced irradiance is shown as the ratio of viral production from LL and SL cultures at each time point after the release of progeny virions. A ratio of 1 indicates that an equal proportion of virions were produced under the different host growth conditions. Points show mean ± standard deviation of biological replicates (n = 3). Shaded areas indicate dark period in 14:10 h diel cycle.
Figure 5
Figure 5
Differential chemical composition of dissolved organic matter resulting from virally infected host cultures (‘+OlV1’ and ‘+OlV7’) as compared to non‐infected control cultures acclimated to 105–115 (SL) and 15 (LL) μmol photons m−2 s−2 irradiance. A. Heatmap of abundance of spectral clusters that were significantly (P < 0.01) differentially abundant between pairwise comparisons of virus treatment groups (represented by different symbols). Only one spectral cluster was also found to have significant differential abundance between SL and LL conditions (red asterisk). The heatmap is coloured based on spectral counts in a given sample relative to the cluster mean across samples. Total spectral count across samples is shown for each significant cluster on the left (grey bars). On the right side, compound mass is expressed as monoisotopic M + H mass for each spectral cluster. B. van Krevelen diagram (i.e., elemental ratio plot) for best‐fit molecular formulas (lowest mass error from observed cluster molecular weight) of statistically significant spectral clusters. Clusters are represented by different shapes indicating the direction of significant differences between virus treatments. The approximate composition regions for some major classes of biochemicals are indicated.

References

    1. Abràmofff, M.D. , Magalhães, P.J. , and Ram, S.J. (2004) Image processing with Image J. Biophotonics Int 11: 36–43.
    1. Agarkova, I.V. , Dunigan, D.D. , and Van Etten, J.L. (2006) Virion‐associated restriction endonucleases of chloroviruses. J Virol 80: 8114–8123. - PMC - PubMed
    1. Allers, E. , Moraru, C. , Duhaime, M.B. , Beneze, E. , Solonenko, N. , Barrero‐Canosa, J. , et al (2013) Single‐cell and population level viral infection dynamics revealed by phageFISH, a method to visualize intracellular and free viruses. Environ Microbiol 15: 2306–2318. - PMC - PubMed
    1. Altschul, S.F. , Gish, W. , Miller, W. , Myers, E.W. , and Lipman, D.L. (1990) Basic local alignment search tool. J Mol Biol 215: 403–410. - PubMed
    1. Ankrah, N.Y.D. , May, A.L. , Middleton, J.L. , Jones, D.R. , Hadden, M.K. , Gooding, J.R. , et al (2014) Phage infection of an environmentally relevant marine bacterium alters host metabolism and lysate composition. ISME J 8: 1089–1100. - PMC - PubMed

Publication types