. 2019 Jun 17;32(6):1151-1164.
doi: 10.1021/acs.chemrestox.9b00006. Epub 2019 Apr 10.

CYP2C19 and 3A4 Dominate Metabolic Clearance and Bioactivation of Terbinafine Based on Computational and Experimental Approaches

Affiliations

CYP2C19 and 3A4 Dominate Metabolic Clearance and Bioactivation of Terbinafine Based on Computational and Experimental Approaches

Mary A Davis et al. Chem Res Toxicol. .

Abstract

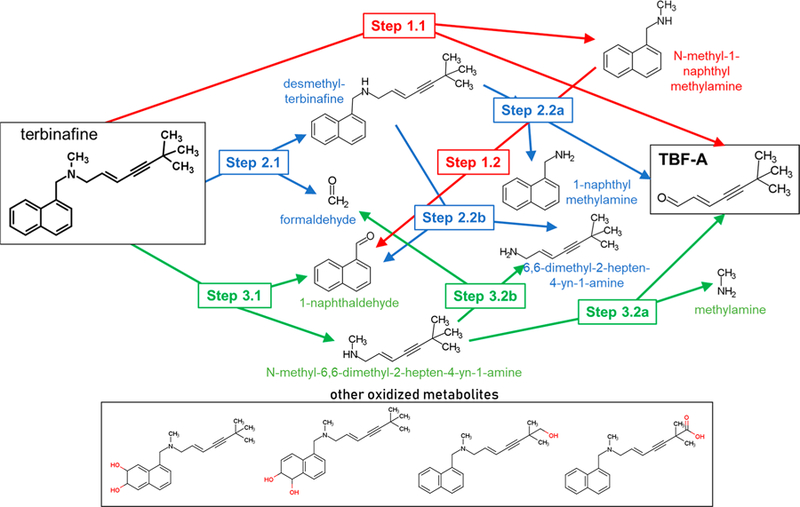
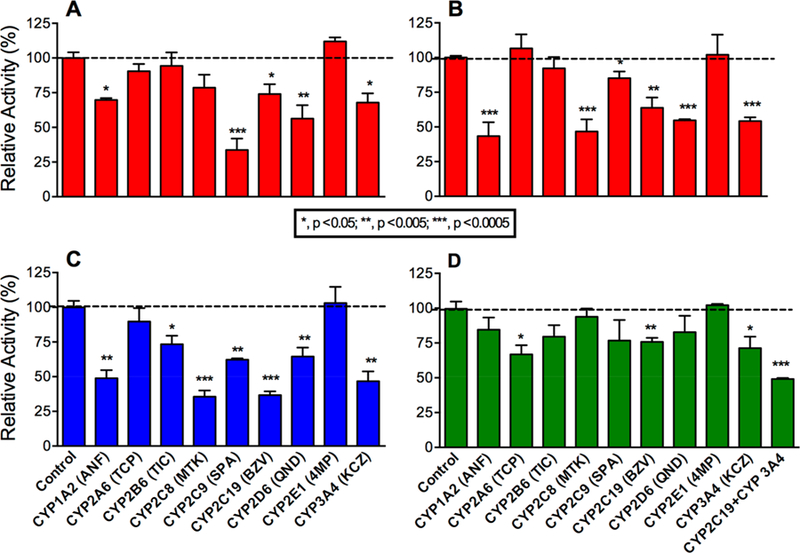
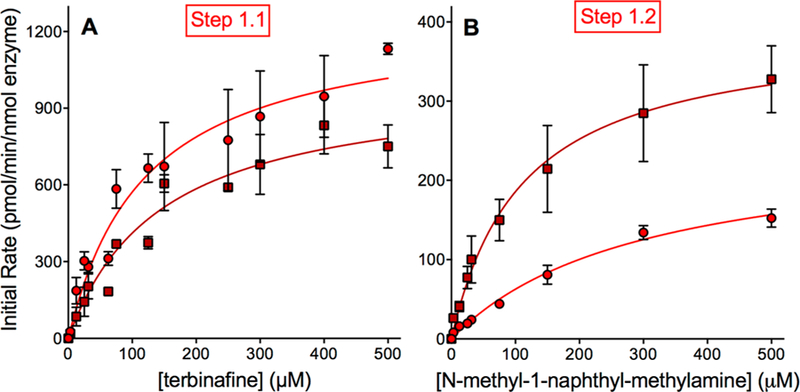
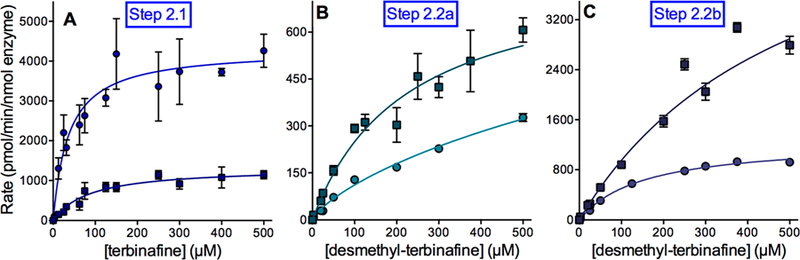
Lamisil (terbinafine) is an effective, widely prescribed antifungal drug that causes rare idiosyncratic hepatotoxicity. The proposed toxic mechanism involves a reactive metabolite, 6,6-dimethyl-2-hepten-4-ynal (TBF-A), formed through three N-dealkylation pathways. We were the first to characterize them using in vitro studies with human liver microsomes and modeling approaches, yet knowledge of the individual enzymes catalyzing reactions remained unknown. Herein, we employed experimental and computational tools to assess terbinafine metabolism by specific cytochrome P450 isozymes. In vitro inhibitor phenotyping studies revealed six isozymes were involved in one or more N-dealkylation pathways. CYP2C19 and 3A4 contributed to all pathways, and so, we targeted them for steady-state analyses with recombinant isozymes. N-Dealkylation yielding TBF-A directly was catalyzed by CYP2C19 and 3A4 similarly. Nevertheless, CYP2C19 was more efficient than CYP3A4 at N-demethylation and other steps leading to TBF-A. Unlike microsomal reactions, N-denaphthylation was surprisingly efficient for CYP2C19 and 3A4, which was validated by controls. CYP2C19 was the most efficient among all reactions. Nonetheless, CYP3A4 was more selective at steps leading to TBF-A, making it more effective in terbinafine bioactivation based on metabolic split ratios for competing pathways. Model predictions did not extrapolate to quantitative kinetic constants, yet some results for CYP3A4 and CYP2C19 agreed qualitatively with preferred reaction steps and pathways. Clinical data on drug interactions support the CYP3A4 role in terbinafine metabolism, while CYP2C19 remains understudied. Taken together, knowledge of P450s responsible for terbinafine metabolism and TBF-A formation provides a foundation for investigating and mitigating the impact of P450 variations in toxic risks posed to patients.


Conflict of interest statement

Notes

The authors declare no competing financial interest.

Figures

Figure 1.
Figure 1.
N-Dealkylation of terbinafine pathways leading to formation of reactive TBF-A. Three N-dealkylation pathways for terbinafine yield TBF-A (m/z 384, dansyl labeled). Pathway 1 (red) is a single-step pathway directly yielding TBF-A and N-methyl-1-naphthyl methylamine (m/z 405, dansyl labeled) as a co-metabolite (Step 1.1). Pathway 2 (blue) is a two-step pathway first yielding desmethyl-terbinafine (m/z 511, dansyl labeled) and formaldehyde via N-demethylation (Step 2.1), followed by the generation of 1-naphthyl methylamine (m/z 391, dansyl labeled) and TBF-A from desmethyl-terbinafine (Step 2.2a). Pathway 3 (green) is a two-step pathway first yielding 1-naphthaldehyde (m/z 404, dansyl labeled) and N-methyl-6,6-dimethyl-2-hepten-4-yn-1-amine (Step 3.1), which undergoes N-dealkylation to yield TBF-A (Step 3.2a). There are three non-N-dealkylation primary metabolites of terbinafine from alternate pathways. Hydroxyterbinafine (m/z 308) and two isomers of terbinafine dihydrodiol (m/z 326) were also observed in this study (shown in the box). Carboxyterbinafine has been reported by others, but was not observed under our steady-state conditions.,
Figure 2.
Figure 2.
Inhibitor phenotyping of terbinafine metabolism by human liver microsomes. As described in Experimental Procedures, terbinafine (200 μM) metabolism to TBF-A (A) and the co-metabolite N-methyl-1-naphthyl methylamine (B) from Pathway 1.1, desmethyl-terbinafine (C) from Pathway 2.1, and 1-naphthaldehyde (D) from Pathway 3.1 was blocked by P450-specific inhibitors. All other potential metabolites for these reactions were not detected consistently or at all. Error bars denote standard deviations. Inhibitors used are as follows: 16 μM α-naphthoflavone (ANF) for CYP1A2, 2 μM tranylcypromine (TCP) for CYP2A6, 3 μM ticlopidine (TIC) for CYP2B6, 16 μM montelukast (MTK) for CYP2C8, 10 μM sulfaphenazole (SPA) for CYP2C9, 16 μM (+)-N-3-benzylnirvanol (BZV) for CYP2C19, 2 μM quinidine (QND) for CYP2D6, 30 μM 4-methylpyrazole (4MP) for CYP2E1, and 1 μM ketoconazole (KCZ) for CYP3A4 as well as a combined 16 μM (+)-N-3-benzylnirvanol and 1 μM ketoconazole for the 1-naphthaldehyde reaction. A total of 9−15 experimental reactions were carried out for these studies.
Figure 3.
Figure 3.
Steady-state kinetic profiles for terbinafine N-dealkylation in Pathway 1. CYP2C19 (○) and 3A4 (□) metabolism of terbinafine yielded kinetics for N-methyl-1-naphthyl methylamine (A) and TBF-A (not shown, see Results) in Pathway 1, as shown in Figure 1. The subsequent N-denaphthylation of N-methyl-1-naphthyl methylamine yielded kinetic profiles in (B). The sets of data were fit best to the Michaelis−Menten equation (p < 0.05), and the corresponding constants reported in Tables 1 and 2. A total of 12 experimental reactions were carried out for these studies. Error bars denote the standard deviations. Reaction conditions and data analyses were carried out as described in Experimental Procedures.
Figure 4.
Figure 4.
Steady state kinetic profiles for terbinafine N-dealkylation in Pathway 2. CYP2C19 (○) and 3A4 (□) metabolism of terbinafine yielded kinetics for desmethyl-terbinafine (A) for the Step 2.1 in Pathway 2 (Figure 1). This metabolite was then used as a substrate to measure the kinetics for naphthyl methylamine (B) and TBF-A (not shown, see Results) for Step 2.2a and 1-naphthaldehyde for Step 2.2b (C), as shown in Figure 1. The sets of data were fit best to the Michaelis−Menten equation (p < 0.05), and the corresponding constants are reported in Tables 1 and 2. A total of 12 experimental reactions were carried out with terbinafine or desmethyl-terbinafine as the substrate. Error bars denote standard deviations. Reaction conditions and data analyses were carried out as described in Experimental Procedures.
Figure 5.
Figure 5.
Steady-state kinetic profiles for terbinafine N-dealkylation in Pathway 3. CYP2C19 (○) and 3A4 (□) metabolism of terbinafine yielded kinetics for 1-naphthaldehyde in Pathway 3, as shown in Figure 1. The sets of data were fit best to the Michaelis−Menten equation (p < 0.05), and the corresponding constants reported in Tables 1 and 2. A total of 12 experimental reactions were carried out with terbinafine as substrate. Error bars denote the standard deviations. Reaction conditions and data analyses were carried out as described in Experimental Procedures.
Figure 6.
Figure 6.
Representative model outputs for metabolism of terbinafine and its metabolites. Deep learning neural network models for CYP2C19 and 3A4 as well as human liver microsomes (HLM) predicted the likelihood for metabolism at each atom of terbinafine (A) and its downstream metabolites N-methyl-1-naphthyl methylamine (pathway 1, (B)), desmethyl-terbinafine (pathway 2, (C)), and N-methyl-6,6-dimethyl-2-hepten-4-yn-1-amine (pathway 3, (D))., Predictions were scaled from 0 to 1.0 and colored from blue (cold) to red (hot), respectively. Targeted sites for metabolism would lead to the formation of N-dealkylated metabolites such as aldehydes and amines, as well as oxidized, nondealkylated metabolites like terbinafine dihydrodiols and hydroxyterbinafine.
Figure 7.
Figure 7.
Relative significance of individual reaction steps and N-dealkylation pathways leading to TBF-A. Reaction steps are labeled by pathway number, reaction number, and branch designation, for example, 2.2a. The table lists information gained from experimental and computational modeling studies including experimentally measured catalytic efficiencies (Vmax/Km), modeled reaction predictions, and metabolic split ratios for each reaction step. As discussed in Experimental Procedures, ratios based on experimental Supersomal and human liver microsomal data were calculated using rates under conditions at low substrate concentrations so that they were defined by the catalytic efficiency of the reaction. The multiplication of the metabolic split ratios at each step of the pathway then reflected the quantitative fractional conversion of terbinafine into the reactive TBF-A metabolite. Although not rates, model predictions reflected the relative likelihood for the reaction to occur, and so, we applied a similar analysis to determine model split ratios for competing reactions and assess the qualitative preference for competing pathways. Table footnotes: (a) Metabolic split ratio derived from catalytic (experimental) efficiency values; (b) numerical score produced by computational model; (c) model split ratio derived from computational model scores; (d) denotes formation of TBF-A through pathway 1.1; (e) denotes formation of TBF-A through pathways 2.1 and 2.2a; (f) denotes formation of TBF-A through pathways 3.1 and 3.2a; (g) denotes “not determined”.

References

    1. Ryder NS (1992) Terbinafine: Mode of Action and Properties of the Squalene Epoxidase Inhibition. Br. J. Dermatol 126 (s39), 2–7. - PubMed
    1. Park Y-M (2012) Prolonged Drug-Drug Interaction between Terbinafine and Perphenazine. Psychiatry Invest 9 (4), 422–424. - PMC - PubMed
    1. Nowosielski M, Hoffmann M, Wyrwicz LS, Stepniak P, Plewczynski DM, Lazniewski M, Ginalski K, and Rychlewski L (2011) Detailed Mechanism of Squalene Epoxidase Inhibition by Terbinafine. J. Chem. Inf. Model 51 (2), 455–462. - PubMed
    1. Hall M, Monka C, Krupp P, and O’Sullivan D (1997) Safety of Oral Terbinafine: Results of a Postmarketing Surveillance Study in 25 884 Patients. Arch. Dermatol 133 (10), 1213–1219. - PubMed
    1. Gupta AK, Sibbald RG, Knowles SR, Lynde CW, and Shear NH (1997) Terbinafine Therapy May Be Associated with the Development of Psoriasis de Novo or Its Exacerbation: Four Case Reports and a Review of Drug-Induced Psoriasis. J. Am. Acad. Dermatol 36 (5), 858–862. - PubMed

Publication types