. 2019 Mar 29;17(3):e3000182.
doi: 10.1371/journal.pbio.3000182. eCollection 2019 Mar.

Evolthon: A community endeavor to evolve lab evolution

Affiliations

Evolthon: A community endeavor to evolve lab evolution

Sivan Kaminski Strauss et al. PLoS Biol. .

Abstract

In experimental evolution, scientists evolve organisms in the lab, typically by challenging them to new environmental conditions. How best to evolve a desired trait? Should the challenge be applied abruptly, gradually, periodically, sporadically? Should one apply chemical mutagenesis, and do strains with high innate mutation rate evolve faster? What are ideal population sizes of evolving populations? There are endless strategies, beyond those that can be exposed by individual labs. We therefore arranged a community challenge, Evolthon, in which students and scientists from different labs were asked to evolve Escherichia coli or Saccharomyces cerevisiae for an abiotic stress-low temperature. About 30 participants from around the world explored diverse environmental and genetic regimes of evolution. After a period of evolution in each lab, all strains of each species were competed with one another. In yeast, the most successful strategies were those that used mating, underscoring the importance of sex in evolution. In bacteria, the fittest strain used a strategy based on exploration of different mutation rates. Different strategies displayed variable levels of performance and stability across additional challenges and conditions. This study therefore uncovers principles of effective experimental evolutionary regimens and might prove useful also for biotechnological developments of new strains and for understanding natural strategies in evolutionary arms races between species. Evolthon constitutes a model for community-based scientific exploration that encourages creativity and cooperation.


Conflict of interest statement

The authors have declared that no competing interests exist.

Figures
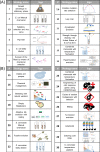
Fig 1
Fig 1. Summary of the strategies employed in Evolthon.
All strategies used in Evolthon are listed each strategy is characterize by identifying number, name, and logo. (A) Strategies used for E.coli. (B) Strategies used for S. cerevisiae. Additional details of each strategy can be found in S1 Table and S2 Text. Pop-Gen, Population Genetics; CRISPR, clustered regularly interspaced short palindromic repeats.
Fig 2
Fig 2. Schematic illustration of the different evolutionary strategies location in the conceptual plan.
We conceptually and qualitatively projected all 30 evolutionary strategies onto a plane that is spanned by two principled characteristics of many of the strategies. The x axis denotes the extent of genome engineering and mutagenesis used. The left most strategies used no engineering, the second used mutagenesis, the third used DNA transformation, the fourth used mating (in yeast), and the right most used genome engineering. The y axis denotes the temperature versus evolutionary time regimen experienced by cells during evolution, with strategies exposing cells to fluctuating temperature, constant temperature, monotonically increasing or decreasing temperature, and a strategy (marked by a red X) that involved engineering with no lab evolution. Colors represent organism, E. coli (blue) or S. cerevisiae (red).
Fig 3
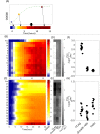
Fig 3. Growth experiments of individual strains.
All strains were grown for approximatley 30 hours in 15°C and 20°C (E. coli and S. cerevisiae, respectively), while measuring OD600 every approximately 1.5 hours. (A) Schematic representation of transforming growth curves into heat map figure. Each point in the growth curve is colored based on its OD600 value to obtain the heat map figure. (B-C) Growth in heat map format. Each row corresponds to a strain. Color bar represents OD600 values. Growth experiments were done in 11 replicates per strain. (B) E. coli (SD doesn’t exceed 0.02). (C) S. cerevisiae (SD doesn’t exceed 0.17). Strains in each species are sorted in ascending order according to final OD. (D-G) Growth parameters (lag, growth rate, and yield) were calculated based on a mathematical model for growth (for details, see S3 Text). Color bar represents log2(Evol/Anc) for each growth parameter. (D, F) E. coli; (E, G) S. cerevisiae. Strains key: E. coli strains: (1) Growth advantage in stationary phase, (2) E. coli Manual chemostat, (3) Saltation-selection and vice versa, (4) Pop-Gen, (5) E. coli daily dilution, (6) Survival of the fittest group by means of selection, (7) Variable mutation-rate selection, (8) Variable mutation-rate selection (with cold shock), (9) Saltation selection and vice versa, (10) Lazy man, (11) Accelerated Evolution, (12) Strength through diversity: the United States of E.coli (U.S.E), (13) Combined chemostat and temperature fluctuations, (14) Hypermutation evolution. S. cerevisiae strains: (15) Delete and prosper, (16) Chemical mutagenesis, (17) Breeding with natural variation, (18) Simply Metabolism, (19) Adaptive evolution with mating, (20) S. cerevisiae Manual chemostat, (21) Foodie-evolution, (22) S. cerevisiae Daily dilution, (23) Combined chemostat and temperature fluctuations, (24) Engineering of cold response genes using CRISPR/Cas9, (25) cycles of random mutagenesis with selection, (26) Mating, (27) Ty-induced evolution, (28) Antarticold, (29) Catching cold RNA, (30) S. cerevisiae temperature gradient. Raw data and quantification data for this figure can be found in S1 Data.
Fig 4
Fig 4. Pooled competition.
Strains were mixed and grown for several dozens of generations in serial dilution regimes under different growth conditions (see S3 Text for details). At different time points during the competition, barcodes were sequenced, and their frequencies are shown. (A) Challenge conditions to which strains were evolved (15°C and 20°C for E. coli and S. cerevisiae, respectively). Color bar represents the frequency of the strains barcode reads from total number of reads. (B) Other challenges (“evolutionary memory,” 37°C and 30°C for E. coli and S. cerevisiae, respectively; “generalization,” 0.8M NaCl and 1.2M sorbitol for E. coli and S. cerevisiae; “extremity,” 8°C for both E. coli and S. cerevisiae). Color bar represents the frequency of the strains barcode reads from total number of reads. Upper panels present E. coli competition results; lower panels present S. cerevisiae competition results. Strains key: E. coli strains: (1) Growth advantage in stationary phase, (2) E. coli Manual chemostat, (3) Saltation-selection and vice versa, (4) Pop-Gen, (5) E. coli Daily dilution, (6) Survival of the fittest group by means of selection, (7) Variable mutation-rate selection, (8) Variable mutation-rate selection (with cold-shock), (9) Saltation-selection and vice versa, (10) Lazy man, (11) Accelerated Evolution, (12) Strength through diversity: the United States of E.coli (U.S.E), (13) Combined chemostat and temperature fluctuations, (14) Hypermutation evolution. S. cerevisiae strains: (15) Delete and prosper, (16) Chemical mutagenesis, (17) Breeding with natural variation, (18) Simply Metabolism, (19) Adaptive evolution with mating, (20) S. cerevisiae Manual chemostat, (21) Foodie-evolution, (22) S. cerevisiae Daily dilution, (23) Combined chemostat and temperature fluctuations, (24) Engineering of cold response genes using CRISPR/Cas9, (25) cycles of random mutagenesis with selection, (26) Mating, (27) Ty-induced evolution, (28) Antarticold, (29) Catching cold RNA, (30) S. cerevisiae temperature gradient. Data for this figure can be found in S2 Data.

References

    1. Dobzhansky T (1973) Nothing in Biology Makes Sense Except in the Light of Evolution. 125–129
    1. Lenski RE, Rose MR, Simpson SC, Tadler SC (1991) Long-Term Experimental Evolution in Escherichia coli. I. Adaptation and Divergence During 2,000 Generations. Am Nat 138:1315–1341
    1. Yona AH, Manor YS, Herbst RH, Romano GH, Mitchell A, Kupiec M, et al. (2012) Chromosomal duplication is a transient evolutionary solution to stress. Proc Natl Acad Sci U S A 109:21010–5 10.1073/pnas.1211150109 - DOI - PMC - PubMed
    1. Toprak E, Veres A, Michel J-B, Chait R, Hartl DL, Kishony R (2012) Evolutionary paths to antibiotic resistance under dynamically sustained drug selection. Nat Genet 44:101–105 - PMC - PubMed
    1. Perrineau M-M, Zelzion E, Gross J, Price DC, Boyd J, Bhattacharya D (2014) Evolution of salt tolerance in a laboratory reared population of C hlamydomonas reinhardtii. Environ Microbiol 16:1755–1766 10.1111/1462-2920.12372 - DOI - PubMed

Publication types

LinkOut - more resources