. 2019 Apr 10;25(4):499-512.e8.
doi: 10.1016/j.chom.2019.02.005. Epub 2019 Mar 26.

Adaptive Strategies of the Candidate Probiotic E. coli Nissle in the Mammalian Gut

Affiliations

Adaptive Strategies of the Candidate Probiotic E. coli Nissle in the Mammalian Gut

Nathan Crook et al. Cell Host Microbe. .

Abstract

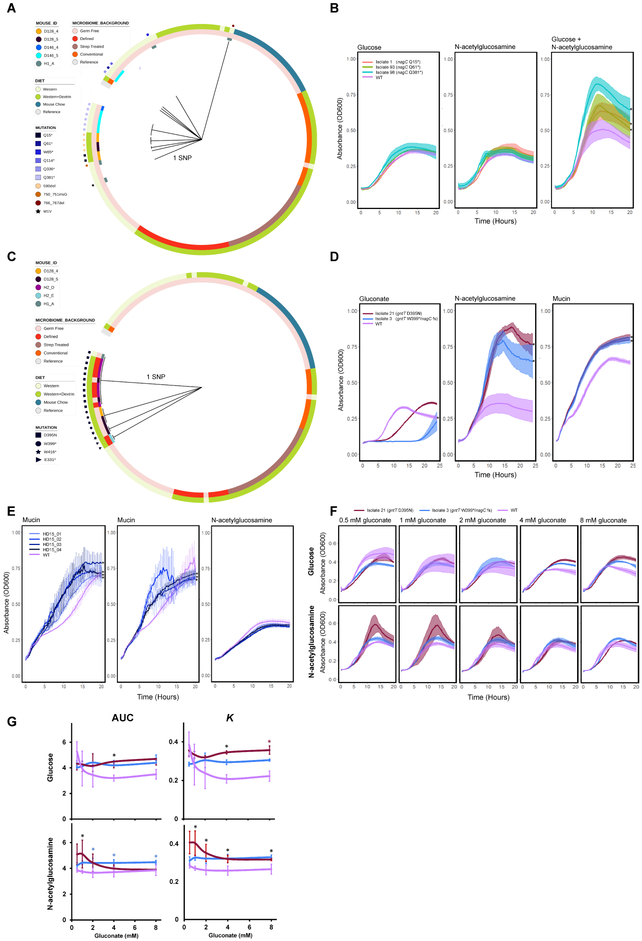
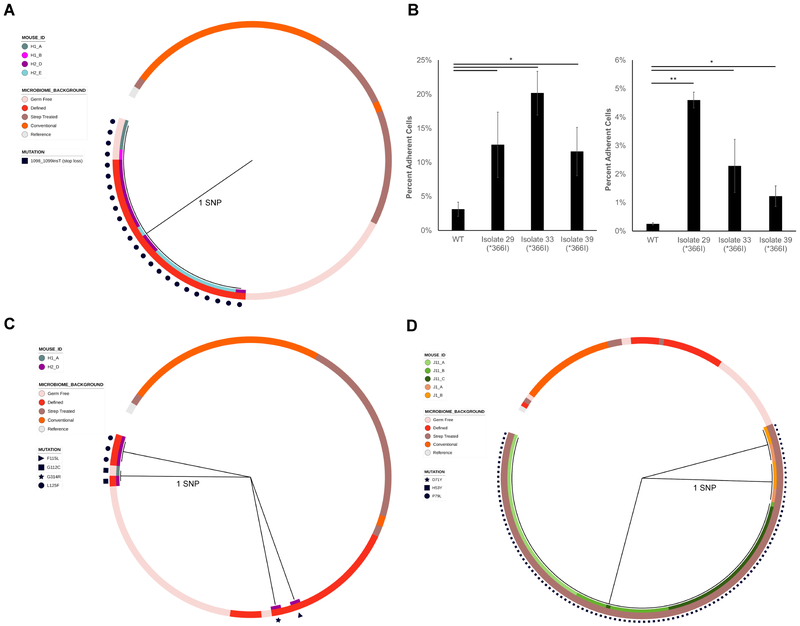
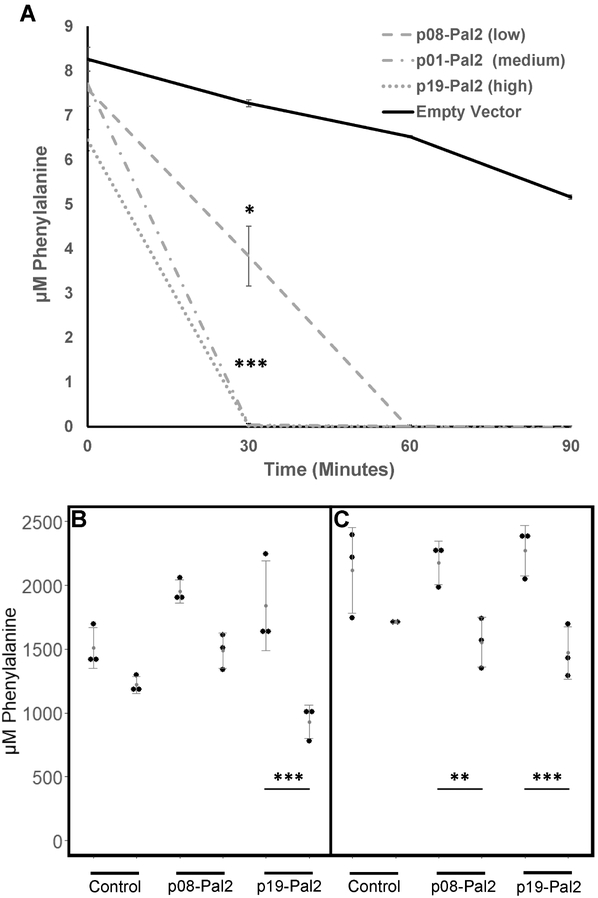
Probiotics are living microorganisms that are increasingly used as gastrointestinal therapeutics by virtue of their innate or engineered genetic function. Unlike abiotic therapeutics, probiotics can replicate in their intended site, subjecting their genomes and therapeutic properties to natural selection. We exposed the candidate probiotic E. coli Nissle (EcN) to the mouse gastrointestinal tract over several weeks, systematically altering the diet and background microbiota complexity. In-transit EcN accumulates genetic mutations that modulate carbohydrate utilization, stress response, and adhesion to gain competitive fitness, while previous exposure to antibiotics reveals an acquisition of resistance. We then leveraged these insights to generate an EcN strain that shows therapeutic efficacy in a mouse model of phenylketonuria and found that it was genetically stable over 1 week, thereby validating EcN's utility as a chassis for engineering. Collectively, we demonstrate a generalizable pipeline that can be applied to other probiotics to better understand their safety and engineering potential.

Keywords: E. coli; engineering; evolution; microbiome; phenylketonuria; probiotic.


Conflict of interest statement

Declaration of Interests

The authors declare no competing interests. The following authors have the current affiliations: AJG: VL55; MKG: Flagship Pioneering; DP: Eli Lilly & Company. The authors assert that VL55, Flagship Pioneering, and Eli Lilly & Company were not involved in and did not influence this research.

Figures

Figure 1.
Figure 1.. Functional metagenomic selections in EcN mono-colonized mice.
A) Experimental design and sampling timeline. Mice were gavaged on day 0. N: number of replicate mice. B-E) Relative abundance of metagenomic fragments in replicate mice fed standard mouse diet and water (B), a high-fat human diet and water (C), a high-fat human diet and dextrin (D), or a high-fat human diet and inulin (E). MD: fragments enriched in mice fed Mouse Diet; HD: fragments enriched in mice fed Human Diet. See also Figures S1–S4, and Table S6.
Figure 2.
Figure 2.. Selection for carbohydrate utilization and acid tolerance in EcN mono-colonized mice.
A) Growth curves of strains expressing fragments enriched in the functional selections on minimal media supplemented with different carbon sources. *P < 6×10⁻³, Student’s t-test comparing time taken to reach OD600=0.25 between WT and MD04. B) Annotations of select metagenomic fragments enriched in the functional selections. C) Growth curves of 3 biologically-replicate EcN strains expressing the gadX DNA insert (MD04) or EcN carrying empty vector (WT) after a 30 minute pulse in acidic (pH 2.5) or neutral (pH 7.0) conditions. * P < 0.001, Student’s t-test for the time needed to return to the maximum optical density prior to the pulse between MD04 fragments and WT, Bonferroni correction for multiple comparisons. D) Growth of WT EcN on 1% raffinose minimal media pre-conditioned by EcN strains carrying MD01 or MD02, or by WT EcN, or on unconditioned 1% raffinose minimal M9 media (left). No growth was observed in uninoculated conditioned media (right). * P < 0.001, Student’s t-test on the K parameter of logistic models fit to the data using the growthcurver R package, Bonferroni correction for multiple comparisons. The shaded regions represent the standard deviation of 8 experimental replicates. See also Figure S2, Figure S4, and Table S6.
Figure 3.
Figure 3.. Comparison of functions enriched in functional selections in mice with different gut microbiome complexities.
A) Heatmap of the relative abundances of GO classifications present in EcN mono-colonized mice and mice pre-colonized with a 13-member defined community at the end of the selection period. Dendrograms represent the clustering applied to group similar rows/columns of the heatmap. B) Growth curves of EcN strains harboring metagenomic inserts shown in D on gluconate minimal media, or (C) glucose. N = 6 experimental replicates, error bars represent one standard deviation above and below the mean. D) Annotations of the metagenomic fragments characterized in B-C. See also Figure S2, S4–S5, and Table S6.
Figure 4.
Figure 4.. Summary of mutations detected in in vivo adapted EcN isolates.
The EcN chromosome, its 2 native plasmids pMut1 and pMut2, and the expression vector pZE21 are depicted in a Circos plot. Light gray regions are scaled 100x that of the rest of the chromosome for visibility. Genes of interest (orange) are labelled around the plot. The outer track depicts all detected intergenic (orange) and nonsynonymous (green) SNPs. The next track depicts all small insertions (blue) and deletions (red). The third tack depicts all large deletions > 1kb (shaded purple). The inner track depicts the number of isolates that contained each mutation. Mutations found in only one isolate are excluded the inner track for visibility. Isolate counts for each mutation are capped at 25, which only affects the rsmG mutants, (167). See also Figure S6 and Tables S3, S5–S7.
Figure 5.
Figure 5.. Phylogenies and phenotypic effects of nagC and gntT mutations.
Maximum parsimony gene phylogenies for adapted isolates based on their nucleotide sequences for A) nagC and C) gntT. The length of the branches corresponds to the number of SNPs separating the isolate gene sequence from the reference sequence. Color tracks depict the treatment conditions and the Mouse IDs from which isolates were isolated. The prefix of each Mouse ID indicates the cage in which the mouse was housed. B) Growth curves of nagC mutants on 0.4% glucose minimal media (left), 0.4% GlcNAc minimal media (middle), and 0.2% GlcNAc and 0.2% glucose minimal media (right). N = 3 experimental replicates per strain, * P < 0.05, Welch’s t-tests comparing the K parameter of logistic growth models fit to the data for WT or the mutant isolates, with Benjamini-Hochberg correction for multiple comparisons. D) Growth curves of gntT or gntT/nagC double mutants on gluconate (left), GlcNAc (middle), or porcine gastric mucin minimal media (right). ‘fs’: frameshift mutation S197T. * P < 1×10⁻⁵, Welch’s t-tests comparing the empirical areas under the curves for WT and the mutant isolates, Bonferroni correction for multiple comparisons. E) Growth curves of EcN transformed with plasmid-borne gntR-containing inserts from the functional metagenomic selections in 1.5% porcine gastric mucin (left, middle, 2 independent experiments), or in 20 mM GlcNAc minimal media (right). N = 4–6 experimental replicates per strain, *P < 0.05, Welch’s t-tests comparing the empirical areas under the curves for WT and the mutant isolates, Benjamini-Hochberg correction for multiple comparisons. F) gntT mutants were grown in 20 mM glucose (top) or 20 mM GlcNAc (bottom) minimal media supplemented with indicated gluconate. G) Summary of F, showing the areas under the growth curves (AUC) and the K parameter of logistic growth models fit to the data. N = 2–4 experimental replicates per strain, * P < 0.05, Welch’s t-tests, Benjamini-Hochberg correction for multiple comparisons. Black stars indicate both Isolates 3 and 21 had a significantly greater value than WT at a given gluconate concentration. Blue – only Isolate 3. Red – only Isolate 21. For all panels, K and AUC values were calculated using the growthcurver R package. Error bars and shaded regions represent one standard deviation above and below the mean. See also Figure S7.
Figure 6.
Figure 6.. Phylogenies and phenotypic effects of kfiB, sgrR, and rsmG mutations.
Maximum parsimony gene phylogenies for adapted isolates based on their nucleotide sequences for A) kfiB, C) sgrR, and D) rsmG, as in Figure 5 B) Percentages of kfiB mutant cells adherent to Caco-2 (left) or HT29-MTX (right) monolayers after 3 washes. Shown are the means of ratios of adherent CFU to total CFU counts (N = 3 experimental replicates). Error bars are one standard deviation above and below the mean. * P < 0.05, ** P < 0.001, Welch’s t-test with Benjamini-Hochberg correction for multiple comparisons.
Figure 7.
Figure 7.. In vitro and in vivo degradation of phenylalanine by EcN:PAL2.
A) Phenylalanine concentration over time in minimal media supplemented with glucose and 10 μM Phe, and inoculated with EcN expressing PAL2 under promoters of indicated strength. Shown are the mean of three experimental replicates. Error bars represent one standard deviation above and below the mean. * P < 0.01, Welch’s t-test with Bonferroni correction for multiple comparisons. B-C) Paired serum phe concentrations for male (B) and female (C) homozygous mutant Pahenu2 mice before and 24 hours after gavage with WT EcN or EcN expressing PAL2 under a high or low strength promoter. Shown are means and standard deviations for three replicate mice. *** P < 0.0001, ** P < 0.01; P-values were calculated using the generalized linear hypothesis test with Bonferroni correction (glht function from the multcomp R package) on the coefficient estimates from a linear mixed-effects model generated by regressing Phe measurements on an interaction factor comprised of mouse gender, measurement timepoint (before or after treatment), and treatment (lme function from the nlme R package). Random intercepts by mouse were specified in the model. The model accounts for repeat measures variability.

Comment in

References

    1. Anderson C (2006. ). Anderson promoter collection. http://parts.igem.org/Promoters/Catalog/Anderson
    1. Arndt D, Grant JR, Marcu A, Sajed T, Pon A, Liang Y, and Wishart DS (2016). PHASTER: a better, faster version of the PHAST phage search tool. Nucleic Acids Res 44, W16–21. - PMC - PubMed
    1. Bankevich A, Nurk S, Antipov D, Gurevich AA, Dvorkin M, Kulikov AS, Lesin VM, Nikolenko SI, Pham S, Prjibelski AD, et al. (2012). SPAdes: a new genome assembly algorithm and its applications to single-cell sequencing. J Comput Biol 19, 455–477. - PMC - PubMed
    1. Battesti A, Majdalani N, and Gottesman S (2011). The RpoS-mediated general stress response in Escherichia coli. Annu Rev Microbiol 65, 189–213. - PMC - PubMed
    1. Baym M, Kryazhimskiy S, Lieberman TD, Chung H, Desai MM, and Kishony R (2015). Inexpensive multiplexed library preparation for megabase-sized genomes. PLoS One 10, e0128036. - PMC - PubMed

Substances

LinkOut - more resources