. 2019;8(1):95-110.
doi: 10.1016/j.jcmgh.2019.03.005. Epub 2019 Mar 27.

Hepatic Lysosomal iNOS Activity Impairs Autophagy in Obesity

Affiliations

Hepatic Lysosomal iNOS Activity Impairs Autophagy in Obesity

Qingwen Qian et al. Cell Mol Gastroenterol Hepatol. 2019.

Abstract

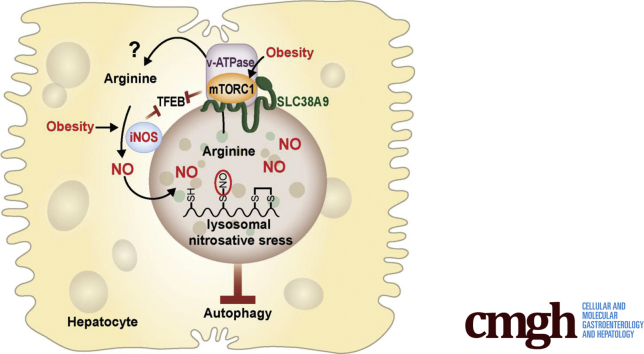
Background & aims: The lysosome is an acidic organelle that is important for maintaining cellular and metabolic homeostasis in hepatocytes. Lysosomal dysfunction and chronic inflammation coexist, and both contribute to obesity-associated hepatic insulin resistance. However, in the context of obesity, the interplay between inflammatory signals and hepatic lysosomal function remains largely unknown. Inducible nitric oxide synthase (iNOS) is a hallmark for inflammation, and is activated in obesity. The aim of this study is to understand the molecular link between iNOS-mediated lysosomal nitric oxide (NO) production, hepatic lysosomal function, and autophagy in the context of obesity-associated insulin resistance.

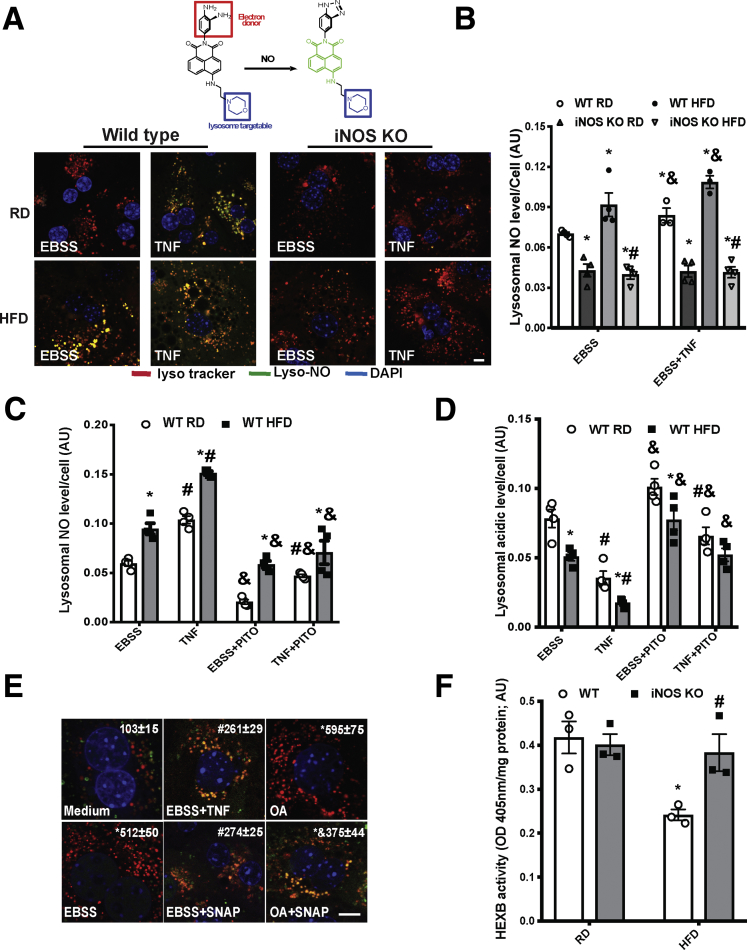
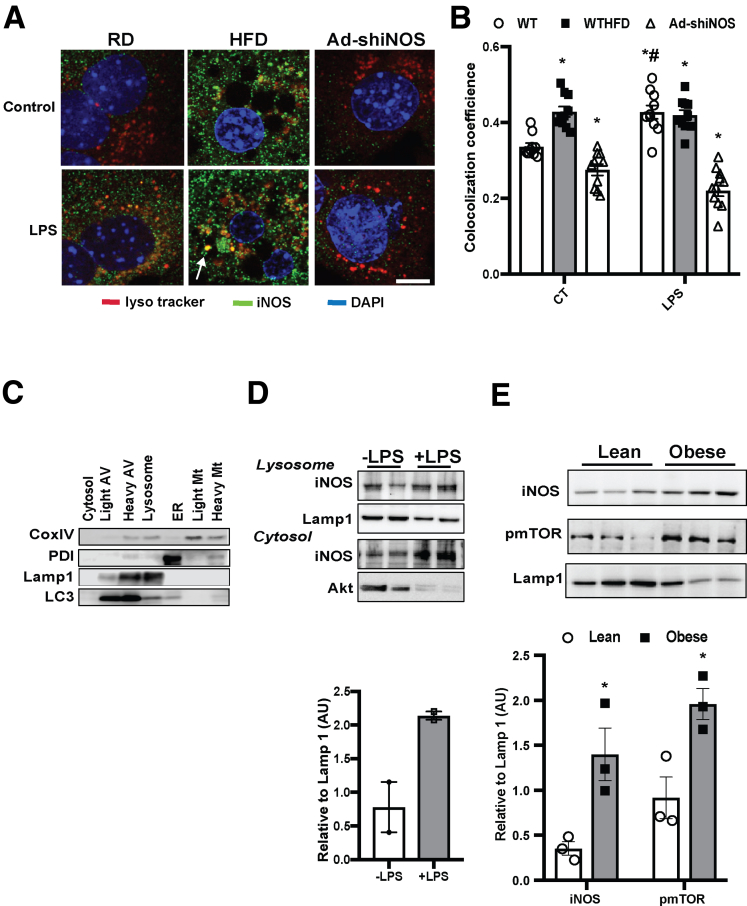
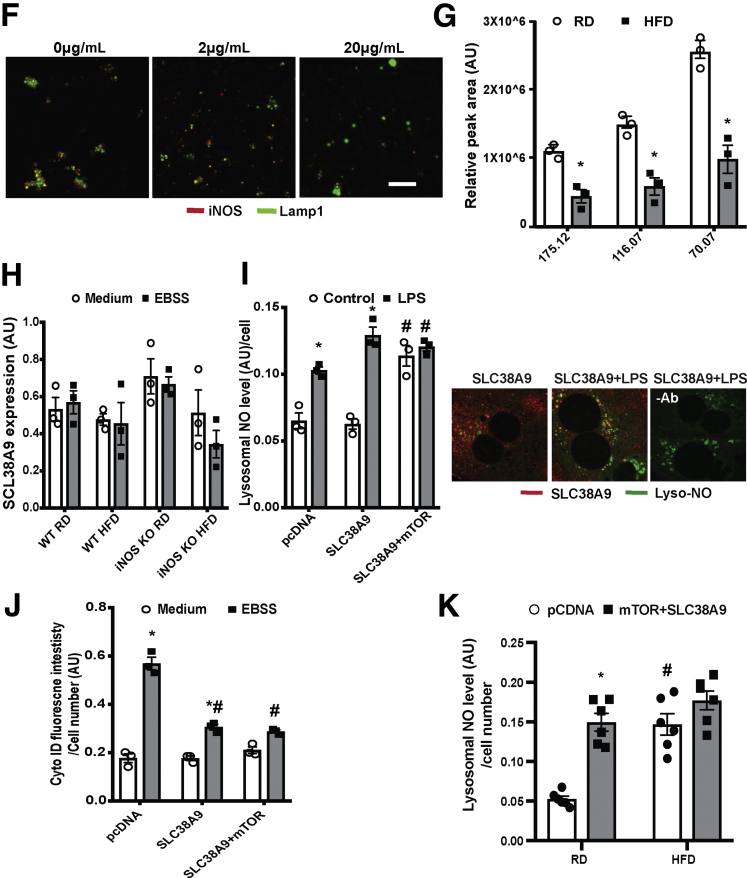
Methods: The role of iNOS in hepatic autophagy, as related to insulin and glucose homeostasis were studied in mice with diet-induced obesity (DIO). The effects and mechanisms of iNOS-mediated lysosomal NO production on lysosomal function and hepatic autophagy were studied in primary hepatocytes as well as in a mouse model of DIO.

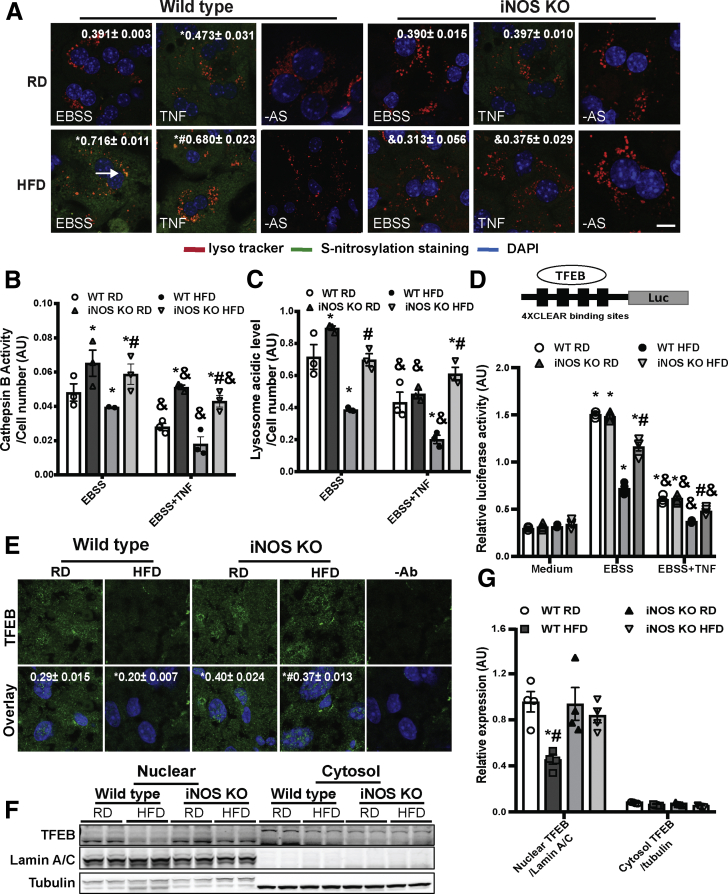
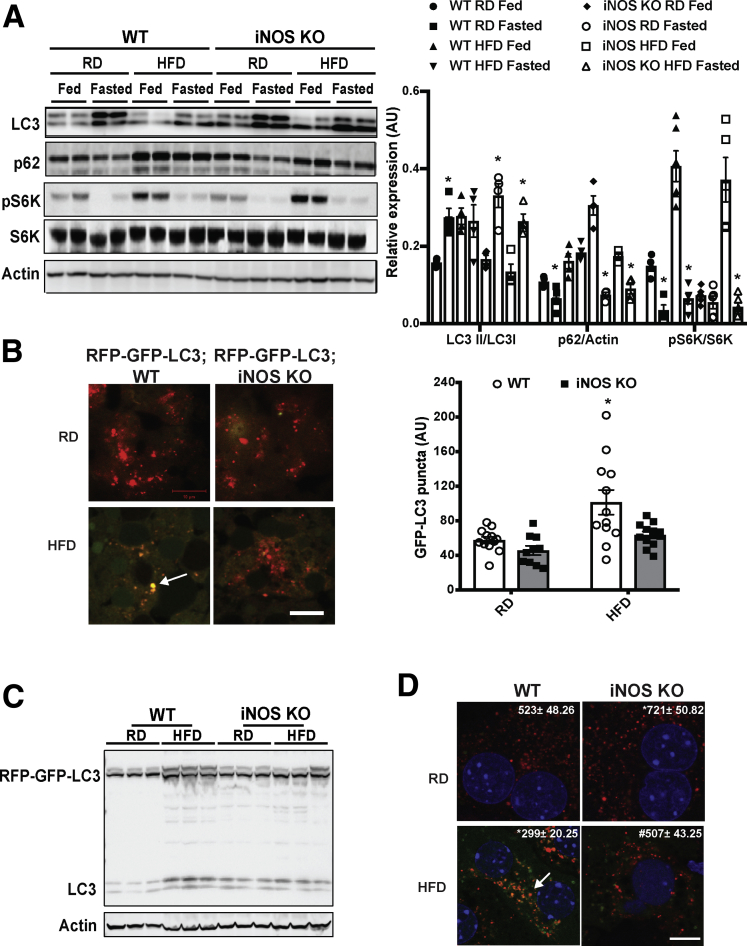
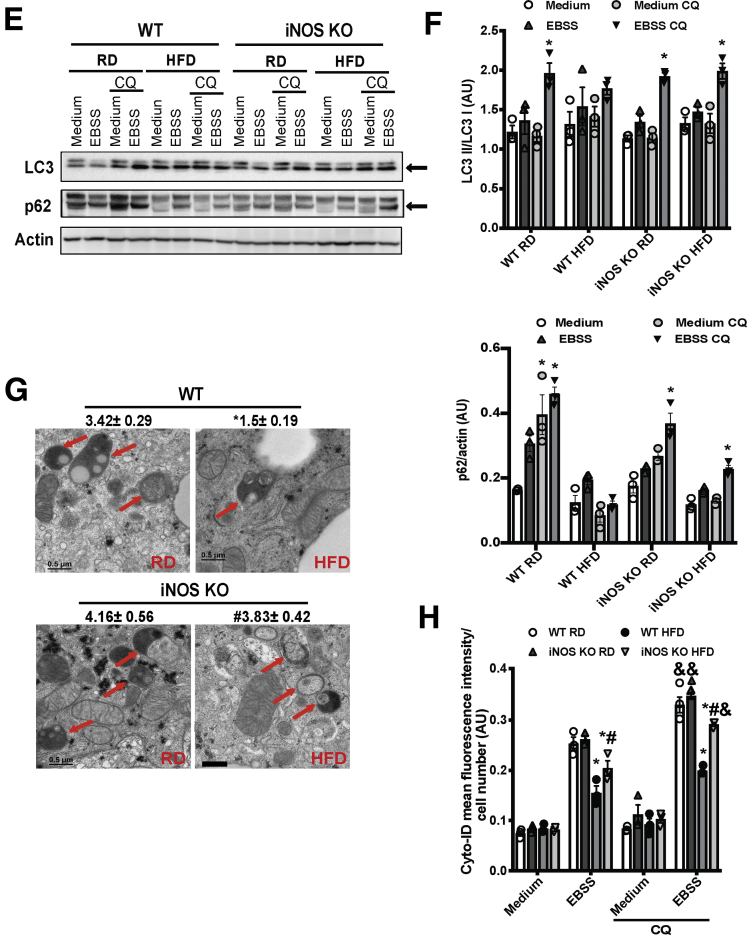
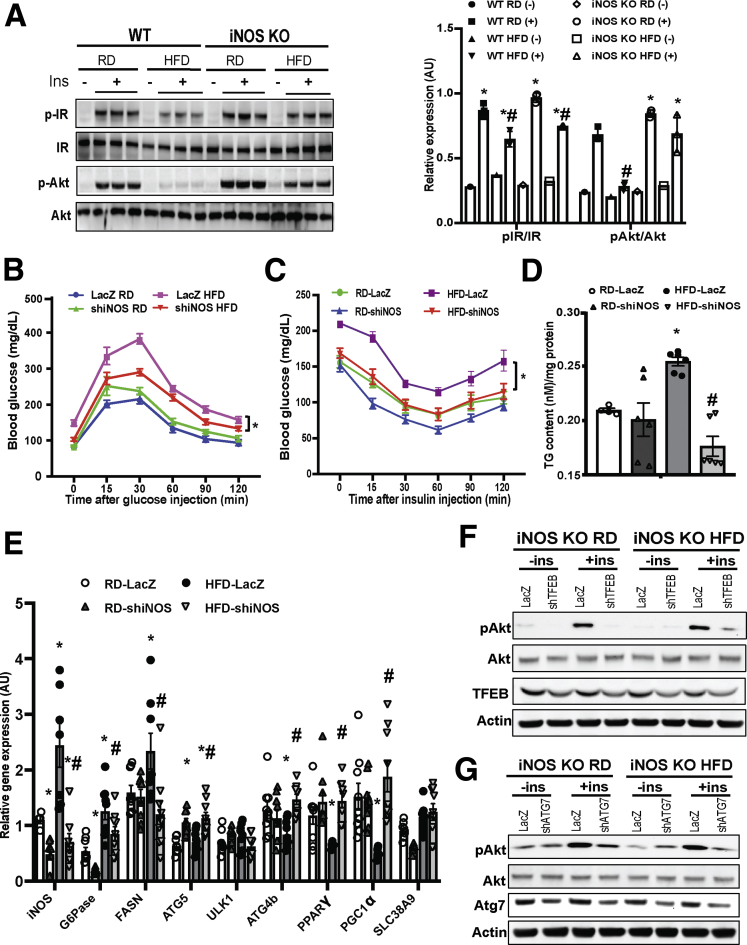
Results: We demonstrate that obesity promotes iNOS localization to the lysosome and decreases levels of lysosomal arginine, resulting in an accumulation of NO in hepatic lysosomes. This lysosomal NO production is attenuated by treatment with a NO scavenger, while co-overexpression of mTOR and a lysosomal arginine transporter (SLC38A9) enhances lysosomal NO production and suppresses autophagy. In addition, we show that deletion of iNOS ameliorates lysosomal nitrosative stress in the livers of DIO mice, promotes lysosomal biogenesis by activating transcription factor EB (TFEB), and enhances lysosomal function and autophagy. Lastly, deletion of iNOS in mice with DIO improves hepatic insulin sensitivity, which is diminished by suppression of TFEB or autophagy related 7 (Atg7).

Conclusions: Our studies suggest that lysosomal iNOS-mediated NO signaling disrupts hepatic lysosomal function, contributing to obesity-associated defective hepatic autophagy and insulin resistance.

Keywords: Autophagy; Inducible Nitric Oxide Synthase; Insulin Resistance; Lysosome; Nitric Oxide.


Figures

None
Graphical abstract
Figure 1
Figure 1
iNOS elevates lysosomal NO production in hepatocytes in obesity. (A) Top: Structure of Lyso-NINO and the reaction of Lyso-NINO with NO. Bottom: Representative confocal images (63×) of live primary hepatocytes from WT or iNOS-KO mice stained with 5.0-μM Lyso-NINO (15 minutes). Cells were treated with EBSS (4 hours) and pretreated with TNF (10 ng/mL, 16 hours). Scale bar: 10 μm. (B) Quantification of lysosomal NO production in primary hepatocytes. Data are presented as mean ± SEM. * indicates statistical significance compared with WT RD in EBSS, # indicates statistical significance between HFD groups, and & indicates statistical significance between EBSS- and TNF-treatment in the same cell type, as determined by analysis of variance (ANOVA) followed by a post hoc test (P < .05; n = 3, biological replicates; 12 weeks on HFD). (C) Lysosomal NO levels and (D) lysosomal acidity in live primary hepatocytes from WT mice. Autophagy was induced by EBSS (4 hours) and pretreatment with TNF (10 ng/mL, 16 hours) in the presence or absence of PTIO (100 nM, 30 minutes). * indicates statistical significance between RD and HFD groups in the same treatment, # indicates statistical significance between EBSS and TNF in the same cell type, and & indicates statistical significance between measurements taken before and after PTIO treatment in the same cell type, as determined by ANOVA followed by a post hoc test (P < .05; n = 3, biological replicates; 12 weeks on HFD). (E) Representative confocal images (63×) of primary hepatocytes isolated from RFP-GFP-LC3 transgenic mice. Autophagy was induced by EBSS (4 hours) or OA (200 μM, 16 hours), ± treatment with TNF (10 ng/mL, 16 hours) or SNAP (50 μM, 4 hours). The number of the red LC3 puncta/field are noted at the top of the image. All data are presented as mean ± SEM. * indicates statistical significance compared with medium, # indicates statistical significance between EBSS groups, and & indicates statistical significance between OA groups determined by ANOVA followed by post hoc test (P < .05; 10 fields/group; n = 3, biological replicates). Scale bar: 10 μm. (F) Hexosaminidase subunit beta activity in lysosomal fractions from WT and iNOS KO mice fed an RD and HFD (16 weeks on HFD). An equivalent amount of liver tissues from lean and obese mice were used. Data are presented as mean ± SEM. * indicates statistically significant difference relative to lean condition in the same type of mice, # indicates statistical significance between HFD groups, by determined by ANOVA followed by post hoc test (P < .05; each sample is the combined fraction from livers of 4 mice; n = 12, biological replicates).
Figure 2
Figure 2
Obesity and inflammation promote lysosomal-localization of iNOS. (A) Representative confocal images (63×) and (B) quantification of lysosomal iNOS in primary hepatocytes from WT mice fed an RD and HFD, and WT fed an HFD and transduced with Ad-shiNOS. Lysotracker was added to cells for 15 minutes; LPS: 1 μg/mL, 6 hours. Scale bar: 10 μm. Data are shown as mean ± SEM as determined by Person’s correlation coefficient. * indicates statistically significant difference relative to -LPS in WT RD, and # indicates statistical significance between +LPS and –LPS groups in same type of mice, as determined by analysis of variance (ANOVA) followed by post hoc test (P < .05; n = 3, biological replicates; 12 weeks on HFD). (C) Western blots of organelle fractions, CoxIV: mitochondrial (Mt) marker; PDI: endoplasmic reticulum (ER) marker; Akt: cytosol marker; Lamp1: lysosomal marker; LC3: autophagy vesicle marker. (D) Lysosomal iNOS expression in livers of WT mice or WT mice treated with LPS (1 mg/kg/mouse; each lane is the combined fraction from livers of 4 mice) and (E) in the livers of lean and obese mice (ob/ob 10 weeks). The densitometry of Western blot analysis of panel E is shown on the bottom of the panel. * indicates statistically significant difference relative to lean, as determined by Student’s t test (P < .05; each lane is the combined fraction from livers of 3 mice; n = 9, biological replicates). (F) Representative confocal images (63×) of lysosomes isolated from WT mice treated with LPS (1 mg/kg/mouse). The lysosomes were treated with trypsin at 0, 2, and 20 μg/mL for 10 minutes at room temperature. Scale bar: 5 μm. (G) Lysosomal arginine profile in the livers of mice fed with an RD and HFD. Data are normalized to liver weight and presented as mean ± SEM. * statistically significant difference relative to RD group, as determined by Student’s t test (P < .05; each sample is the combined fraction from livers of 4 mice; n = 12, biological replicates; 16 weeks on HFD). (H) Levels of messenger RNAs encoding SLC38A9 in the primary hepatocytes from WT mice or iNOS KO mice fed with an RD and HFD, as assessed by quantitative real-time reverse-transcriptase polymerase chain reaction. Autophagy was induced by EBSS (4 hours). Data are presented as mean ± SEM. Statistically significant difference relative to medium is determined by ANOVA followed by a post hoc test (n = 3, biological replicates). (I) Lysosomal NO levels and (J) autophagic vesicle numbers in live primary hepatocytes from WT mice. Cells were transfected with indicated constructs for 48 hours, pretreated with LPS (1μg/mL, 6 hours) and autophagy was induced by EBSS (4 hours). * indicates statistical significance between control and treated cells that were transfected with the same plasmid; # indicates statistical significance between cells of the same treatment group compared with cells transfected with pcDNA, as determined by ANOVA followed by a post hoc test (P < .05; n = 3, biological replicates; 12 weeks on HFD). Representative confocal images (63×) of primary hepatocytes transfected with SLC38A9-flag (48 hours) stained with 5.0 μM Lyso-NINO (15 m, green) and anti-flag (red) are shown on the right panel of panel I. Scale bar: 10 μm. (K) Lysosomal NO levels in live primary hepatocytes from WT mice fed with an RD and HFD. Cells were transfected with the indicated constructs for 48 hours and autophagy was induced by EBSS (4 hours). * indicates statistical significance between pcDNA control and mTOR+SLC38A9 in the same type of cells, and # indicates statistical significance between RD and HFD cells that were transfected with the same plasmid, as determined by ANOVA followed by a post hoc test (P < .05; n = 6, biological replicates; 12 weeks on HFD).
Figure 2
Figure 2
Obesity and inflammation promote lysosomal-localization of iNOS. (A) Representative confocal images (63×) and (B) quantification of lysosomal iNOS in primary hepatocytes from WT mice fed an RD and HFD, and WT fed an HFD and transduced with Ad-shiNOS. Lysotracker was added to cells for 15 minutes; LPS: 1 μg/mL, 6 hours. Scale bar: 10 μm. Data are shown as mean ± SEM as determined by Person’s correlation coefficient. * indicates statistically significant difference relative to -LPS in WT RD, and # indicates statistical significance between +LPS and –LPS groups in same type of mice, as determined by analysis of variance (ANOVA) followed by post hoc test (P < .05; n = 3, biological replicates; 12 weeks on HFD). (C) Western blots of organelle fractions, CoxIV: mitochondrial (Mt) marker; PDI: endoplasmic reticulum (ER) marker; Akt: cytosol marker; Lamp1: lysosomal marker; LC3: autophagy vesicle marker. (D) Lysosomal iNOS expression in livers of WT mice or WT mice treated with LPS (1 mg/kg/mouse; each lane is the combined fraction from livers of 4 mice) and (E) in the livers of lean and obese mice (ob/ob 10 weeks). The densitometry of Western blot analysis of panel E is shown on the bottom of the panel. * indicates statistically significant difference relative to lean, as determined by Student’s t test (P < .05; each lane is the combined fraction from livers of 3 mice; n = 9, biological replicates). (F) Representative confocal images (63×) of lysosomes isolated from WT mice treated with LPS (1 mg/kg/mouse). The lysosomes were treated with trypsin at 0, 2, and 20 μg/mL for 10 minutes at room temperature. Scale bar: 5 μm. (G) Lysosomal arginine profile in the livers of mice fed with an RD and HFD. Data are normalized to liver weight and presented as mean ± SEM. * statistically significant difference relative to RD group, as determined by Student’s t test (P < .05; each sample is the combined fraction from livers of 4 mice; n = 12, biological replicates; 16 weeks on HFD). (H) Levels of messenger RNAs encoding SLC38A9 in the primary hepatocytes from WT mice or iNOS KO mice fed with an RD and HFD, as assessed by quantitative real-time reverse-transcriptase polymerase chain reaction. Autophagy was induced by EBSS (4 hours). Data are presented as mean ± SEM. Statistically significant difference relative to medium is determined by ANOVA followed by a post hoc test (n = 3, biological replicates). (I) Lysosomal NO levels and (J) autophagic vesicle numbers in live primary hepatocytes from WT mice. Cells were transfected with indicated constructs for 48 hours, pretreated with LPS (1μg/mL, 6 hours) and autophagy was induced by EBSS (4 hours). * indicates statistical significance between control and treated cells that were transfected with the same plasmid; # indicates statistical significance between cells of the same treatment group compared with cells transfected with pcDNA, as determined by ANOVA followed by a post hoc test (P < .05; n = 3, biological replicates; 12 weeks on HFD). Representative confocal images (63×) of primary hepatocytes transfected with SLC38A9-flag (48 hours) stained with 5.0 μM Lyso-NINO (15 m, green) and anti-flag (red) are shown on the right panel of panel I. Scale bar: 10 μm. (K) Lysosomal NO levels in live primary hepatocytes from WT mice fed with an RD and HFD. Cells were transfected with the indicated constructs for 48 hours and autophagy was induced by EBSS (4 hours). * indicates statistical significance between pcDNA control and mTOR+SLC38A9 in the same type of cells, and # indicates statistical significance between RD and HFD cells that were transfected with the same plasmid, as determined by ANOVA followed by a post hoc test (P < .05; n = 6, biological replicates; 12 weeks on HFD).
Figure 3
Figure 3
iNOS induces hepatic lysosomal nitrosative stress. (A) Representative confocal images (40×) of S-nitrosylated proteins in primary hepatocytes from WT and iNOS-KO mice (n = 3) using a modified in situ biotin-switch method. Autophagy was induced by EBSS (4 hours) and cells were pretreated with TNF (10 ng/mL, 16 hours). –AS: no ascorbate as a negative control for biotin-switch assay. Scale bar: 10 μm. Quantification of the S-nitrosylated protein and lysotracker are shown on the top of each image. Data are shown as mean ± SEM as determined by Person’s correlation coefficient. * indicates statistically significant difference relative to EBSS in WT RD, and # indicates statistical significance between HFD group determined by analysis of variance (ANOVA) followed by post hoc test (P < .05; 10 fields/group; n = 3, biological replicates; 12 weeks on HFD). (B) CTSB activity and (C) lysosomal acidity in live primary hepatocytes from WT and iNOS-KO mice. * indicates statistical significance compared with WT RD in the same treatment, # indicates statistical significance within HFD groups in the same treatment, and & indicates statistical significance between EBSS- and TNF-treated groups in the same cell type, determined by ANOVA followed by a post hoc test (P < .05; n = 3, biological replicates; 12 weeks on HFD). (D) TFEB activity in primary hepatocytes from WT and iNOS-KO mice. Cells were transfected with the indicated constructs for 48 hours, and treated with EBSS (4 hours) ± TNF (10 ng/mL, 16 hours). The data were normalized to Renilla luciferase. * indicates statistical significance compared with WT RD medium from the same cell type, # indicates statistical significance between HFD groups in the same treatment, and & indicates statistical significance between EBSS and TNF in the same cell type determined by ANOVA followed by a post hoc test (P < .05; n = 3, biological replicates; 12 weeks on HFD). The 4XCLEAR construct is shown on the top of the panel. (E) Representative confocal images (63×) for TFEB staining in livers of WT mice and iNOS KO mice. Green: TFEB; blue: DAPI. –Ab: nonantibody controls. Scale bar: 10 μm. Quantified colocalization of TFEB with DAPI are shown at the top of each image. Data are shown as Pearson’s correlation coefficient as mean ± SEM. * indicates statistically significant difference relative to WT RD, and # indicates statistical significance between HFD group determined by ANOVA followed by a post hoc test (P < .05; 10 fields/group; n = 3, biological replicates; 16 weeks on HFD). (F) Representative Western blot analysis of TFEB nuclear translocation in panel E. Each sample is the combined fraction from livers of 6 mice. (G) Densitometry of Western blot analysis in panel F. * indicates statistical significance between HFD and RD in same type of mouse, # indicates statistical significance between HFD group, determined by ANOVA followed by post hoc test (P < .05; each lane is the combined fraction from livers of 3 mice; n = 12, biological replicates).
Figure 4
Figure 4
iNOS suppresses hepatic autophagy. (A) Representative Western blots of LC3 conversion, p62 and S6K (T421/S424) phosphorylation in livers from WT and iNOS-KO mice under fed or fasting (16 hours) conditions. Densitometry of Western blot analysis in A is shown on the right of the panel. *indicates statistical significance between fasting and fed in the same type of mice fed with same type of diet, determined by Student’s t test (P < .05; n = 4, biological replicates; 16 weeks on HFD). (B) Representative images (40×) of RFP-GFP-LC3 puncta in the livers of RFP-GFP-LC3 and RFP-GFP-LC3;iNOS KO mice fed an RD or HFD (16 weeks on HFD, fasted for 16 hours). Quantified numbers of the GFP-LC3 puncta/field are shown on the right of the panel. Data are shown as mean ± SEM. * indicates statistically significant difference relative to WT RD. determined by analysis of variance (ANOVA) followed by post hoc test (P < .05; 10 fields/group; n = 3, biological replicates). Scale bar: 10μm. (C) LC3 expression in livers from RFP-GFP-LC3 and RFP-GFP-LC3;iNOS-KO mice fed an RD or HFD (16 weeks on HFD, fasted for 16 hours). (D) Representative confocal images (63×) of primary hepatocytes isolated from WT or iNOS-KO mice (n = 3) transduced with Ad-mRFP-GFP-LC3 (MOI=2). Cells were treated with EBSS (4 hours). The number of the red LC3 puncta/field is noted at the top of each image. All data are presented as mean ± SEM. * indicates statistical significance compared with WT, # indicates statistical significance between HFD groups determined by ANOVA followed by post hoc test (P < .05; 10 fields/group; n = 3, biological replicates; 12 weeks on HFD). Scale bar: 10 μm. (E) Representative Western blots of LC3 conversion (arrow indicates LC3-II) and p62 expression in primary hepatocytes from livers of WT and iNOS-KO mice. EBSS (4 hours) was used to induce autophagy, and CQ (20 μM, 4 hours) was used to inhibit lysosomal degradation. Each lane contains a mixture of protein lysates from 3 mice. (F) Densitometry of Western blot analysis in E. * indicates statistical significance between EBSS and EBSS CQ groups in same type of mouse, determined by ANOVA followed by post hoc test (P < .05; n = 9, biological replicates; 12 weeks on HFD). (G) Representative transmission electron microscopy images (5,000×) of livers from fasting (16 hours) WT and iNOS-KO mice. Arrows: autophagic vesicles. Scale bar: 0.5 μm. Numbers at the top of each graph represent the average number of autophagic vesicles/7.5 μm2. All data are presented as mean ± SEM. * indicates statistical significance compared with WT RD; # indicates statistical significance between HFD group, determined by ANOVA followed by post hoc test (P < .05 n = 3, biological replicates; 12 images/mouse; 16 weeks on HFD). (H) Autophagic vacuoles in live primary hepatocytes from mice described in panel E, as detected by the Cyto-ID kit. Data are presented as mean ± SEM. * indicates statistical significance compared with WT RD in EBSS, # indicates statistical significance between HFD groups in the same treatment, and & indicates statistical significance compared with EBSS groups without CQ, determined by ANOVA followed by a post hoc test (P < .05; n = 3, biological replicates; 12 weeks on HFD).
Figure 4
Figure 4
iNOS suppresses hepatic autophagy. (A) Representative Western blots of LC3 conversion, p62 and S6K (T421/S424) phosphorylation in livers from WT and iNOS-KO mice under fed or fasting (16 hours) conditions. Densitometry of Western blot analysis in A is shown on the right of the panel. *indicates statistical significance between fasting and fed in the same type of mice fed with same type of diet, determined by Student’s t test (P < .05; n = 4, biological replicates; 16 weeks on HFD). (B) Representative images (40×) of RFP-GFP-LC3 puncta in the livers of RFP-GFP-LC3 and RFP-GFP-LC3;iNOS KO mice fed an RD or HFD (16 weeks on HFD, fasted for 16 hours). Quantified numbers of the GFP-LC3 puncta/field are shown on the right of the panel. Data are shown as mean ± SEM. * indicates statistically significant difference relative to WT RD. determined by analysis of variance (ANOVA) followed by post hoc test (P < .05; 10 fields/group; n = 3, biological replicates). Scale bar: 10μm. (C) LC3 expression in livers from RFP-GFP-LC3 and RFP-GFP-LC3;iNOS-KO mice fed an RD or HFD (16 weeks on HFD, fasted for 16 hours). (D) Representative confocal images (63×) of primary hepatocytes isolated from WT or iNOS-KO mice (n = 3) transduced with Ad-mRFP-GFP-LC3 (MOI=2). Cells were treated with EBSS (4 hours). The number of the red LC3 puncta/field is noted at the top of each image. All data are presented as mean ± SEM. * indicates statistical significance compared with WT, # indicates statistical significance between HFD groups determined by ANOVA followed by post hoc test (P < .05; 10 fields/group; n = 3, biological replicates; 12 weeks on HFD). Scale bar: 10 μm. (E) Representative Western blots of LC3 conversion (arrow indicates LC3-II) and p62 expression in primary hepatocytes from livers of WT and iNOS-KO mice. EBSS (4 hours) was used to induce autophagy, and CQ (20 μM, 4 hours) was used to inhibit lysosomal degradation. Each lane contains a mixture of protein lysates from 3 mice. (F) Densitometry of Western blot analysis in E. * indicates statistical significance between EBSS and EBSS CQ groups in same type of mouse, determined by ANOVA followed by post hoc test (P < .05; n = 9, biological replicates; 12 weeks on HFD). (G) Representative transmission electron microscopy images (5,000×) of livers from fasting (16 hours) WT and iNOS-KO mice. Arrows: autophagic vesicles. Scale bar: 0.5 μm. Numbers at the top of each graph represent the average number of autophagic vesicles/7.5 μm2. All data are presented as mean ± SEM. * indicates statistical significance compared with WT RD; # indicates statistical significance between HFD group, determined by ANOVA followed by post hoc test (P < .05 n = 3, biological replicates; 12 images/mouse; 16 weeks on HFD). (H) Autophagic vacuoles in live primary hepatocytes from mice described in panel E, as detected by the Cyto-ID kit. Data are presented as mean ± SEM. * indicates statistical significance compared with WT RD in EBSS, # indicates statistical significance between HFD groups in the same treatment, and & indicates statistical significance compared with EBSS groups without CQ, determined by ANOVA followed by a post hoc test (P < .05; n = 3, biological replicates; 12 weeks on HFD).
Figure 5
Figure 5
iNOS-mediated impairment of hepatic autophagy contributes to obesity-associated insulin resistance. (A) Hepatic insulin action in primary hepatocytes from WT and iNOS-KO mice (10 weeks on HFD). Ins: insulin, 5 nM for 10 minutes; p-IR: IRtyr1150/1151; p-AKT: Aktser473. Densitometry of Western blot analysis of panel A is shown on the right of the panel. * indicates statistical significance between +Ins and –Ins in the same type of mice, and # indicates statistical significance between RD and HFD group in the same type of mice, determined by 2-way analysis of variance (ANOVA) with a post hoc test (P < .05; n = 3, biological replicates). (B) Glucose tolerance and (C) insulin tolerance tests in WT mice transduced with control virus (Ad-lacZ) or Ad-shiNOS and fed an RD or HFD (n = 8–10, biological replicates; 8 weeks on HFD). Data are presented as mean ± SEM. * indicates statistical analysis of area under the curve between HFD groups, determined by 2-way ANOVA with a post hoc test (P < .05). (D) Hepatic triglyceride levels in WT and iNOS-KO mice on an RD and HFD. Data are presented as mean ± SEM. * indicates a statistically significant difference relative to WT RD group; # indicates a statistically significant difference between HFD groups determined by ANOVA followed by post hoc test (P < .05; n = 3–4, biological replicates; 12 weeks on HFD). (E) Levels of messenger RNAs encoding gluconeogenesis, lipogenesis proteins and autophagy regulators in the livers of WT mice and WT mice transduced with Ad-shiNOS, as assessed by quantitative real-time RT-PCR. Data are presented as mean ± SEM. * indicates statistical significance compared with LacZ RD group, # indicates statistical significance between HFD groups determined by ANOVA followed by post hoc test (P < .05; n = 4–6, biological replicates; 12 weeks on HFD). (F, G) Hepatic insulin action in primary hepatocytes isolated from WT and iNOS-KO mice transduced with (F) Ad-shTFEB, (G) Ad-shAtg7, or control virus (Ad-lacZ). Each lane contains a mixture of protein lysates from 3 mice. IN: insulin, 5 nM for 10 minutes.

Comment in

References

    1. Kuntz E., Kuntz H.D. Springer; Berlin: 2002. Hepatology, Principles, and Practice: History, Morphology, Biochemistry, Diagnostics, Clinic, Therapy.
    1. Korolchuk V.I., Saiki S., Lichtenberg M., Siddiqi F.H., Roberts E.A., Imarisio S., Jahreiss L., Sarkar S., Futter M., Menzies F.M., O'Kane C.J., Deretic V., Rubinsztein D.C. Lysosomal positioning coordinates cellular nutrient responses. Nat Cell Biol. 2011;13:453–460. - PMC - PubMed
    1. Zoncu R., Bar-Peled L., Efeyan A., Wang S., Sancak Y., Sabatini D.M. mTORC1 senses lysosomal amino acids through an inside-out mechanism that requires the vacuolar H(+)-ATPase. Science. 2011;334:678–683. - PMC - PubMed
    1. Codogno P., Meijer A.J. Autophagy in the liver. J Hepatol. 2013;59:389–391. - PubMed
    1. Doria A., Gatto M., Punzi L. Autophagy in human health and disease. N Engl J Med. 2013;368:651–662. - PubMed

Publication types

MeSH terms