. 2019 May 10;294(19):7942-7965.
doi: 10.1074/jbc.RA118.007087. Epub 2019 Mar 29.

Identification, characterization, and structural analyses of a fungal endo-β-1,2-glucanase reveal a new glycoside hydrolase family

Affiliations

Identification, characterization, and structural analyses of a fungal endo-β-1,2-glucanase reveal a new glycoside hydrolase family

Nobukiyo Tanaka et al. J Biol Chem. .

Abstract

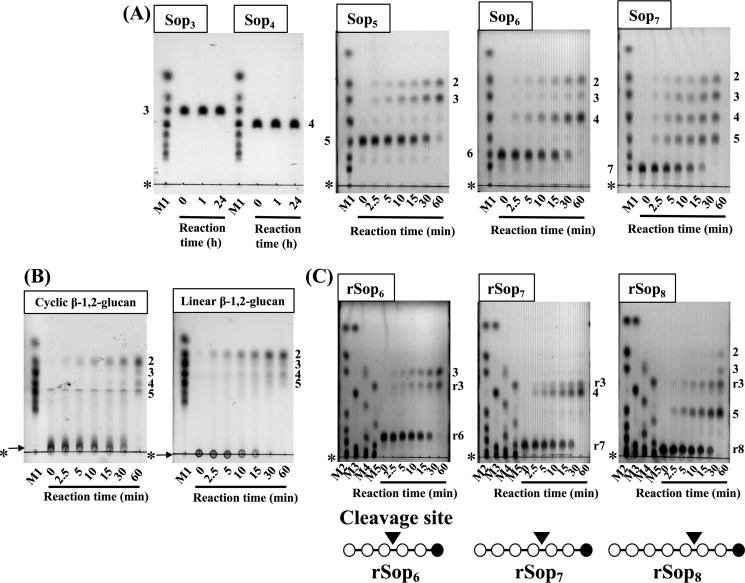
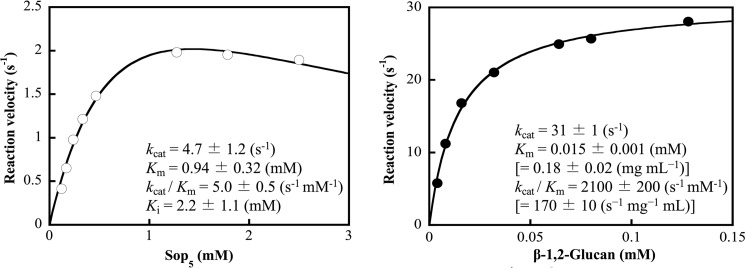
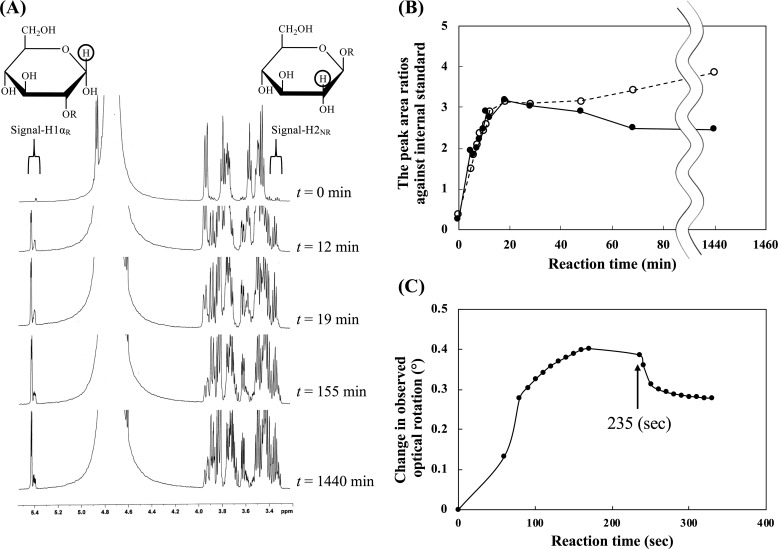
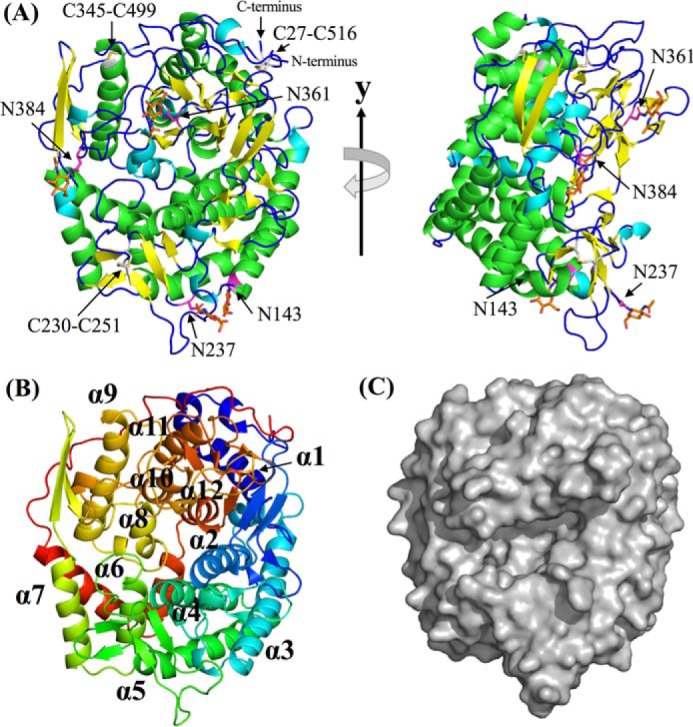
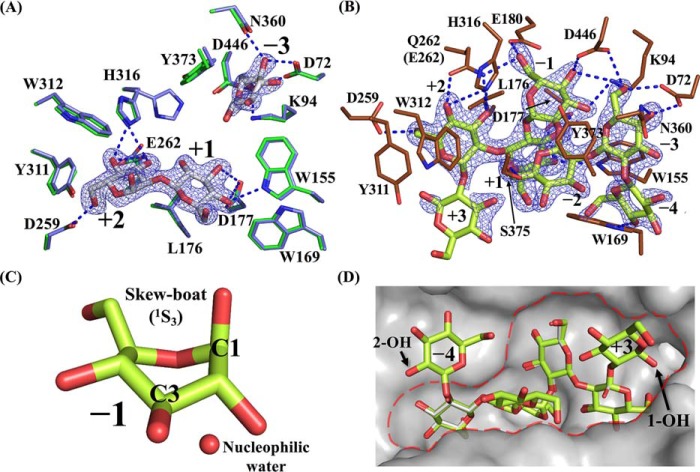
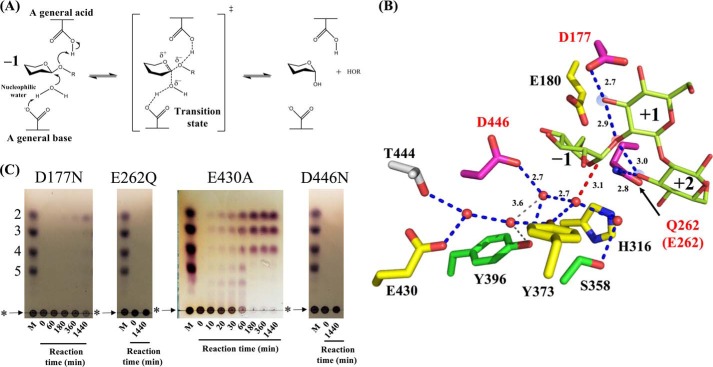
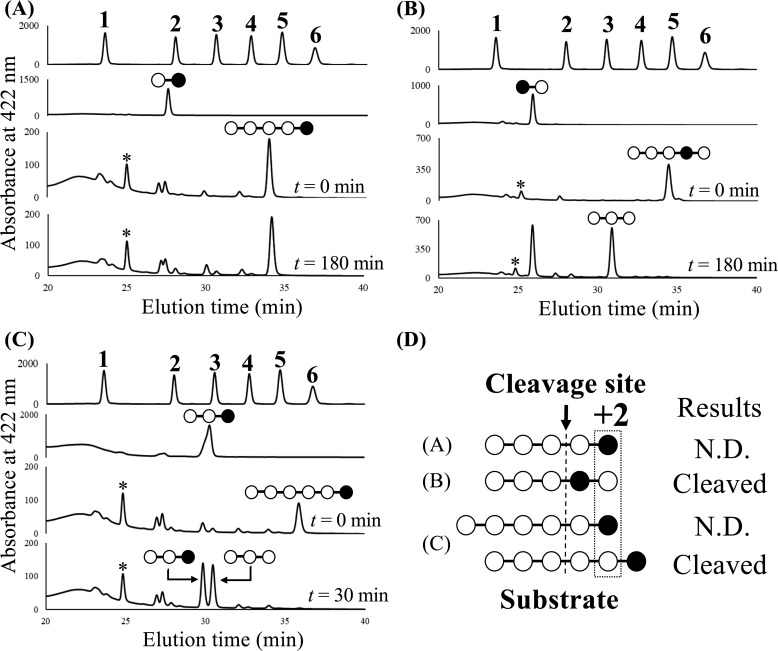
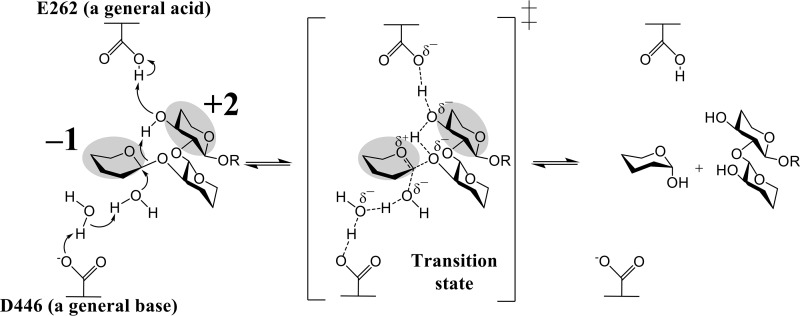
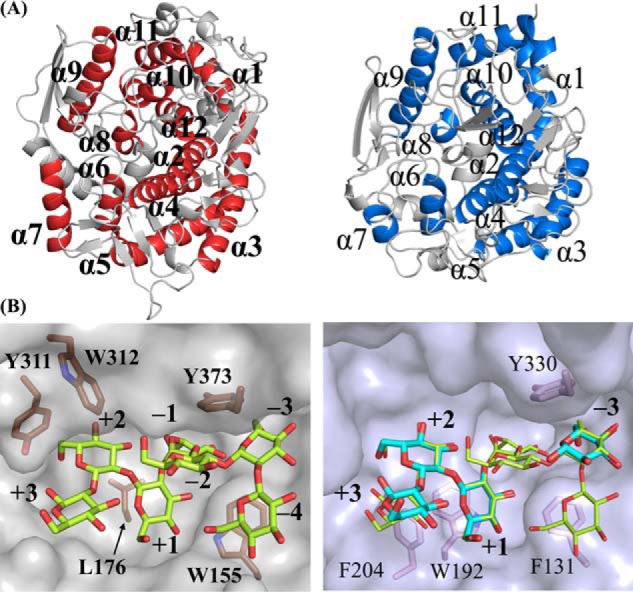
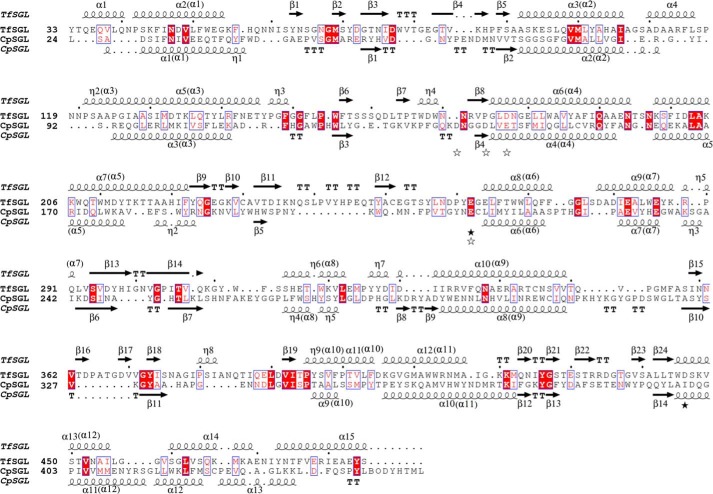
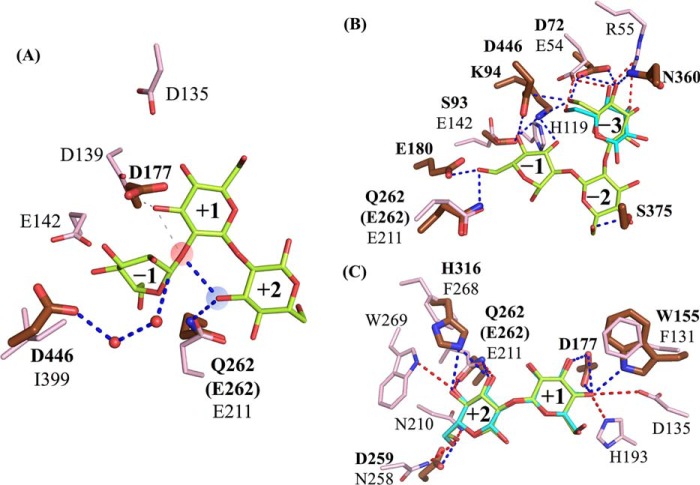
endo-β-1,2-Glucanase (SGL) is an enzyme that hydrolyzes β-1,2-glucans, which play important physiological roles in some bacteria as a cyclic form. To date, no eukaryotic SGL has been identified. We purified an SGL from Talaromyces funiculosus (TfSGL), a soil fungus, to homogeneity and then cloned the complementary DNA encoding the enzyme. TfSGL shows no significant sequence similarity to any known glycoside hydrolase (GH) families, but shows significant similarity to certain eukaryotic proteins with unknown functions. The recombinant TfSGL (TfSGLr) specifically hydrolyzed linear and cyclic β-1,2-glucans to sophorose (Glc-β-1,2-Glc) as a main product. TfSGLr hydrolyzed reducing-end-modified β-1,2-gluco-oligosaccharides to release a sophoroside with the modified moiety. These results indicate that TfSGL is an endo-type enzyme that preferably releases sophorose from the reducing end of substrates. Stereochemical analysis demonstrated that TfSGL is an inverting enzyme. The overall structure of TfSGLr includes an (α/α)6 toroid fold. The substrate-binding mode was revealed by the structure of a Michaelis complex of an inactive TfSGLr mutant with a β-1,2-glucoheptasaccharide. Mutational analysis and action pattern analysis of β-1,2-gluco-oligosaccharide derivatives revealed an unprecedented catalytic mechanism for substrate hydrolysis. Glu-262 (general acid) indirectly protonates the anomeric oxygen at subsite -1 via the 3-hydroxy group of the Glc moiety at subsite +2, and Asp-446 (general base) activates the nucleophilic water via another water. TfSGLr is apparently different from a GH144 SGL in the reaction and substrate recognition mechanism based on structural comparison. Overall, we propose that TfSGL and closely-related enzymes can be classified into a new family, GH162.

Keywords: Talaromyces funiculosus; endo-β-1,2-glucanase; enzyme catalysis; enzyme structure; fungi; glycoside hydrolase; novel glycoside hydrolase family; oligosaccharide; β-1,2-glucan; β-1,2-gluco-oligosaccharide.


Conflict of interest statement

The authors declare that they have no conflicts of interest with the contents of this article

Figures

Figure 1.
Figure 1.
Purification of TfSGL from a culture filtrate. A, top, SDS-PAGE of eluted fractions in the final purification step (SEC). Middle, TLC analysis of SGL activity in the fractions. BGL activity was inhibited by GDL. Lane M represents a mixture of 0.2% sugars (Glc and Sop2–4), and the numbers to the left of the TLC plates represent DP of Sopns. Bottom, BGL activity in the fractions. pNP-Glc was used as a substrate. Upward and downward arrows indicate correspondence of lanes among the three parts. B, protein (left) and sugar-chain (right) staining of TfSGL. Lanes 1–5 represent protein standard markers, glycoprotein standard markers, glycopeptidase F, and TfSGL without and with treatment of glycopeptidase F, respectively.
Figure 2.
Figure 2.
TLC analysis of action patterns on β-1,2-glucan (A) and Sop3–5 (B) with TfSGL. Lane M represents a mixture of 0.2% Sop2–5. The numbers beside the TLC plates represent DP of Sopns. The purified TfSGL (1.9 and 3.8 μg/ml for hydrolytic reactions of β-1,2-glucan and Sopns, respectively) was incubated in 100 mm acetate-Na buffer (pH 5.0) containing 0.2% β-1,2-glucan or 5 mm Sopns with DP of 3–5 at 20 °C. Arrows represent β-1,2-glucan used for reactions. The origins of the TLC plates are shown as horizontal lines denoted by asterisks.
Figure 3.
Figure 3.
Scheme of cloning of a gDNA region encoding the whole TfSGL gene. The coding DNA sequence (CDS) regions shown in the square boxes represent exons of the TfSGL gene. The regions of the N-terminal peptide and internal peptides 1 and 2 are shown as black, gray, and dotted patterns, respectively. The regions around the peptides are shown as an enlarged view. The obtained N-terminal and two internal peptide sequences are shown below. The first (G) and 7th (X) residue in the internal peptide 2 is a presumed and an undetermined residue, respectively. Only the 6th residue in the N-terminal peptide and the 7th residue in the internal peptide 2 were replaced with cysteine residues in the deduced amino acid sequence of TfSGL. The differences in the sequences are attributed to the fact that cysteine cannot generally be detected unless it is pyridylethylated. The degenerate and specific PCR primers used for cloning are represented with thin and bold arrows, respectively. Primer pairs used for degenerate PCR and specific PCR are boxed with dotted and solid lines, respectively. The numbers above the coding DNA sequence boxes and beside the primers represent the nucleotide numbers from the start codon on gDNA.
Figure 4.
Figure 4.
Phylogenetic tree for TfSGL homologs. The phylogenetic tree for TfSGL homologs was prepared using TfSGL homologs exhibiting at least 35% sequence identity and 50% coverage. Proteins are represented as GenBankTM or NCBI reference sequence accession numbers with the corresponding organism names. Ascomycota, highlighted in gray; Basidiomycota, dotted pattern; Elusimicrobia, pattern of horizontal lines; Dinoflagellata, pattern of diagonal lines with the left side up; Heterolobosea, pattern of vertical and horizontal lines; Ciliophora, pattern of vertical lines; Euglenozoa, pattern of diagonal lines with the right side up; Choanozoa, pattern of squares; Mycetozoa, pattern of diamonds. Letters prior to the organism names represent annotations; A, GPI-anchored protein; B, unnamed, hypothetical, or predicted protein. Black diamonds represent TfSGL homologs fused with the GH1 domain. The GH1 domains were excluded for preparation of the phylogenetic tree. The scale bar represents the number of substitutions per amino acid site. Asterisks represent homologs whose sequences were used for sequence alignment with TfSGL in Fig. 10.
Figure 5.
Figure 5.
TLC analysis of hydrolysates from Sopns (A), β-1,2-glucans (B), and Sopn analogs (C) obtained with TfSGLr. Lanes M1–5 represent sugar markers containing 0.2% each gluco-oligosaccharide; M1, Glc and Sop2–7; M2, Glc and Sop2, 3, 5–7, 9, 11; M3, Glc and Sop4, 8, 10, 11; M4, rSop2, 4, 6, 8, 10; and M5, rSop3, 5, 7, 9, 11. The substrates used for the reactions are shown above the TLC plates. Each substrate (0.2%) was hydrolyzed with TfSGLr (19.3 μg/ml for hydrolysis of Sop5 and rSop6 and 3.2 μg/ml for the other substrates). The origins of the TLC plates are shown as horizontal lines denoted by asterisks. The numbers beside the TLC plates represent DP of Sopns. B, arrows indicate β-1,2-glucans used for reactions. C, numbers with the letter r beside the TLC plates represent rSopns. The pattern diagrams of rSopns are shown below the TLC plates. The open and closed circles in the pattern diagrams represent Glc and the reduced Glc moieties, respectively. Cleavage sites are represented as arrowheads.
Figure 6.
Figure 6.
Kinetic parameters of TfSGLr for Sop5 (left) and β-1,2-glucan (right). The data plotted as open and closed circles are regressed with the substrate inhibition equation (left) and Michaelis-Menten equation (right), respectively. The regressed lines are shown as solid lines. A molar concentration of β-1,2-glucan is calculated using average DP of the β-1,2-glucan. The values when the concentrations of β-1,2-glucan are represented by mg/ml are attached in parentheses.
Figure 7.
Figure 7.
Stereochemical analysis of TfSGLr. A, time-course analysis of a 1H NMR spectrum of the reaction mixture during hydrolysis of β-1,2-glucan with the average DP of 25 by TfSGLr. Encircled protons in the reaction products represent the positions of protons used for determination of stereochemical analysis. Signal-H1αR and signal-H2NR correspond to those of α-anomeric products and the total of α- and β-anomeric products, respectively. B, time-course of the ratio of the integral values of chemical shifts derived from signal-H1αR and signal-H2NR to an internal standard. The ratios corresponding to these chemical shifts are shown in a solid line and closed circles, and a dashed line and open circles, respectively. C, time-course of degree of optical rotation during hydrolysis of β-1,2-glucan with the average DP of 25 by TfSGLr. The arrow shows the time when aqueous ammonia was added.
Figure 8.
Figure 8.
Overall structure of TfSGLr. A, front view of the overall apo TfSGLr structure (left) and the structure rotated by 90° around the y axis (right). The α-helices, 310-helices, β-strands, and loop are shown in green, cyan, yellow, and blue, respectively. Four asparagine residues (Asn-143, Asn-237, Asn-361, and Asn-384) bonded with GlcNAc, and the GlcNAc moieties and residues constituting three disulfide bonds (Cys-27–Cys-516, Cys-230–Cys-251, and Cys-345–Cys-499) are represented by magenta, orange, and white sticks, respectively. B, order of helices constituting an (α/α)6-barrel in TfSGLr. The barrel is represented by a rainbow cartoon. The helices in TfSGLr are numbered in order from the N terminus. C, surface of the overall structure of apo TfSGLr.
Figure 9.
Figure 9.
Complexes with Sop2 and Glc in the WT and Sop7 in the E262Q mutant. A and B, substrate-binding modes of TfSGLr–Sop2 and Glc complex (A), and the E262Q–Sop7 complex (B). The numbers beside the substrate represent the positions of subsites. The FoFc omit maps for Sop2, Glc, and Sop7 are shown at the 4σ contour level and represented by a blue mesh. The blue dotted lines represent the hydrogen bonds between the ligands and the enzymes. A, observed Sop2 and Glc in chain B are represented by white sticks. Residues involved in interaction with Sop2 and Glc in the complex, and the corresponding residues in the superimposed apo structure of TfSGLr are represented by green and light blue sticks, respectively. A blobby electron density beyond the anomeric hydroxy group of the Glc molecule at subsite −3 was omitted from this figure. B, observed Sop7 moiety of β-1,2-glucan with the average DP of 25 in the complex of the E262Q mutant is represented by a yellow-green stick. Residues involved in interaction with Sop7 in the E262Q mutant are represented by brown sticks. C, enlarged view of the skewed Glc moiety in the Sop7 molecule. A water near the anomeric carbon of the Glc moiety is represented by a red sphere. D, surface representation of the catalytic center with Sop7 in the E262Q mutant. The catalytic pocket is enclosed by a red dotted line. Ligands in the Sop2 and Glc complex are represented by a white stick when the Sop2 and Glc complex and the Sop7 complex are aligned.
Figure 10.
Figure 10.
Multiple sequence alignment of TfSGL and its homologs. Multiple alignment using TfSGL homologs with at least 37% sequence identity was carried out. The homologs are represented as GenBankTM or NCBI reference sequence accession numbers. The symbols below the sequences are represented as follows: open circles, candidates for catalytic residues of TfSGLr; closed circles, residues involved in substrate recognition; closed triangles, N-glycosylated asparagine residues; and closed stars, the general acid (Glu-262) and the general base (Asp-446) of TfSGL. The same numbers below sequences represent disulfide bond pairs. Residue numbers above sequences are based on the amino acid sequence of the native TfSGL. The secondary structures of TfSGLr are shown above the sequence. The order of helices constituting (α/α)6 barrels in TfSGLr is shown in parentheses.
Figure 11.
Figure 11.
Candidate residues for catalysis by TfSGLr. A, canonical reaction scheme for inverting glycoside hydrolases. B, candidate residues for catalysis. The Glc moieties at subsites −1 to +2 in the Sop7 complex of the E262Q mutant are represented by yellow-green sticks. The positions of subsites are labeled with numbers. The blue and gray dotted lines represent hydrogen bonds and longer hydrogen bonds (over 3.5 Å) related to a water network in TfSGLr, respectively. The distances of the hydrogen bonds are shown beside the lines. A red dotted line represents the position of nucleophilic attack. Residues corresponding to each mutant are represented as sticks and are color-coded based on the relative hydrolytic activity toward β-1,2-glucan (<0.1%, magenta; 0.1–10%, yellow; and >10%, green). The 3-hydroxy groups of the Glc moieties at subsites +1 and +2 and the oxygen atom at the cleavage site are highlighted in blue and red circles, respectively. C, TLC analysis of the activities of TfSGLr mutants toward β-1,2-glucan. Lane M represents markers each containing 0.2% Sop2–5 and β-1,2-glucan. The mutants used for the reactions are shown above the TLC plates. Each TfSGLr mutant (0.2 mg/ml) was incubated in 100 mm acetate-Na buffer (pH 4.0) containing 0.2% β-1,2-glucan at 30 °C. The origins of the TLC plates are shown as horizontal lines denoted by asterisks. The positions of β-1,2-glucan are shown by arrows.
Figure 12.
Figure 12.
HPLC analysis of fluorescently labeled hydrolysates are from 3dSop5 (A), 3′dSop5 (B), and 3dSop6 (C) obtained with TfSGLr. A–C, panels at top show the retention times of peaks derived from the fluorescently labeled Glc and Sop2–6. The numbers above the peaks represent the DPs of the sugars. The second panels from top show the retention times of peaks derived from the fluorescently labeled 3dSop2, 3′dSop2, and 3dSop3, respectively. The third and fourth panels from top show the retention times of peaks derived from the fluorescently labeled reaction mixtures when TfSGLr was incubated with each derivative at 30 °C for 0, 180, or 30 min, respectively. The pattern diagrams of oligosaccharides corresponding to the peaks are shown above the peaks. The open and closed circles in the pattern diagrams represent the Glc and 3-deoxy-Glc moieties, respectively. The asterisks denote peaks derived from the fluorescent labeling reagent. D, summary of the results of action pattern analysis. N.D. represents that no product cleaved at the cleavage site was detected.
Figure 13.
Figure 13.
Reaction mechanism of TfSGL. The Glc moieties at subsites −1 and +2 are highlighted in gray. Curved arrows represent the pathway for proton transfer, and the dotted lines represent hydrogen bonds involved in catalysis. The parts in the substrate that are not directly involved in the reaction mechanism are omitted.
Figure 14.
Figure 14.
Comparison of structures between TfSGLr and CpSGL complexes. The positions of subsites are represented as numbers. The ligands bound with TfSGLr and CpSGL (PDB code 5GZK) are shown as yellow-green and cyan sticks, respectively. Residues involved in hydrophobic recognition of substrates and/or formation of the catalytic pockets in TfSGLr and CpSGL are shown as brown and pink sticks, and the residues are labeled with numbers in bold and regular type, respectively. A, comparison of overall structures between TfSGLr (left) and CpSGL (right). The two structures are superimposed based on their overall structures. The helices constituting (α/α)6 barrels in TfSGLr and CpSGL are colored red and blue, respectively. The helices in TfSGLr and CpSGL are numbered in order from the N termini and are represented by bold and regular letters, respectively. B, comparison of the catalytic pockets between the TfSGLr and CpSGL complexes. Because the ligands in CpSGL are deviated 2–5 Å from the corresponding moieties in TfSGLr and the Glc moieties of Sop7 in TfSGLr at subsites −3, +1, and +2 are strongly bound, the two enzymes were aligned by superimposing the Glc moieties at subsites −3, +1, and +2 in both enzymes. Both corresponding ligand pairs are well-superimposed on 17.8° rotation of CpSGL. TfSGLr (left) and CpSGL (right) are shown as semi-transparent gray and light blue surface models. The Sop7 molecule is superimposed in the right panel.
Figure 15.
Figure 15.
Structure-based alignment of TfSGLr and CpSGL. The alignment based on the structures of TfSGLr and CpSGL was performed using the apo structures of TfSGLr and CpSGL (PDB code 5GZH). The secondary structures of TfSGLr and CpSGL are shown above and below the sequences, respectively. The orders of helices constituting (α/α)6-barrels in both enzymes are shown in parentheses. The amino acid sequences of both enzymes are numbered based on those of the respective native enzymes. The black and white stars represent candidate residues in TfSGLr and CpSGL for catalysis, respectively.
Figure 16.
Figure 16.
Comparison of acidic residues (A) and substrate recognition residues at the subsite minus (B) and plus (C) sides between TfSGLr and CpSGL. The substrate cleavage site and 3-hydroxy group of the Glc moiety at subsite +2 are highlighted in semi-transparent red and blue circles, respectively. The positions of subsites in TfSGLr and CpSGL are represented as numbers. The ligands bound with TfSGLr and CpSGL are shown as yellow-green and cyan sticks, respectively. Residues in TfSGLr and CpSGL are shown as brown and pink sticks, and their residue numbers are denoted by bold and regular numerals, respectively. A, The blue and gray dotted lines represent the catalytic pathway and the candidate pathway ruled out on action pattern analysis of TfSGL, respectively. B and C, hydrogen bonds between residues and ligands in TfSGLr and CpSGL are shown as blue and red dotted lines, respectively. Residues for the hydrophobic interactions with the substrates (Leu-176, Tyr-311, Trp-312, and Tyr-373 in TfSGLr; and Trp-192, Phe-204, and Tyr-330 in CpSGL) are omitted in B and C, and Trp-155 in TfSGLr and Phe-131 in CpSGL are omitted only in B, because these residues can be compared in Fig. 14B.

References

    1. Henrissat B. (1991) A classification of glycosyl hydrolases based on amino acid sequence similarities. Biochem. J. 280, 309–316 10.1042/bj2800309 - DOI - PMC - PubMed
    1. Ndeh D., Rogowski A., Cartmell A., Luis A. S., Baslé A., Gray J., Venditto I., Briggs J., Zhang X., Labourel A., Terrapon N., Buffetto F., Nepogodiev S., Xiao Y., Field R. A., et al. (2017) Complex pectin metabolism by gut bacteria reveals novel catalytic functions. Nature 544, 65–70 10.1038/nature21725 - DOI - PMC - PubMed
    1. Dell A., York W. S., McNeil M., Darvill A. G., and Albersheim P. (1983) The cyclic structure of β-d-(1→2)-linked d-glucans secreted by Rhizobia and Agrobacteria. Carbohydr. Res. 117, 185–200 10.1016/0008-6215(83)88086-0 - DOI
    1. Koizumi K., Okada Y., Utamura T., Hisamatsu M., and Amemura A. (1984) Further studies on the separation of cyclic (1→2)-β-d-glucans (cyclosophoraoses) produced by Rhizobium meliloti IFO 13336, and determination of their degrees of polymerization by high-performance liquid chromatography. J. Chromatogr. 299, 215–224 10.1016/S0021-9673(01)97833-1 - DOI
    1. Bundle D. R., Cherwonogrodzky J. W., and Perry M. B. (1988) Characterization of Brucella polysaccharide B. Infect. Immun. 56, 1101–1106 - PMC - PubMed

Publication types

MeSH terms

LinkOut - more resources