. 2019 Apr 16;116(16):7799-7804.
doi: 10.1073/pnas.1901484116. Epub 2019 Mar 29.

Precise small-molecule cleavage of an r(CUG) repeat expansion in a myotonic dystrophy mouse model

Affiliations

Precise small-molecule cleavage of an r(CUG) repeat expansion in a myotonic dystrophy mouse model

Alicia J Angelbello et al. Proc Natl Acad Sci U S A. .

Abstract

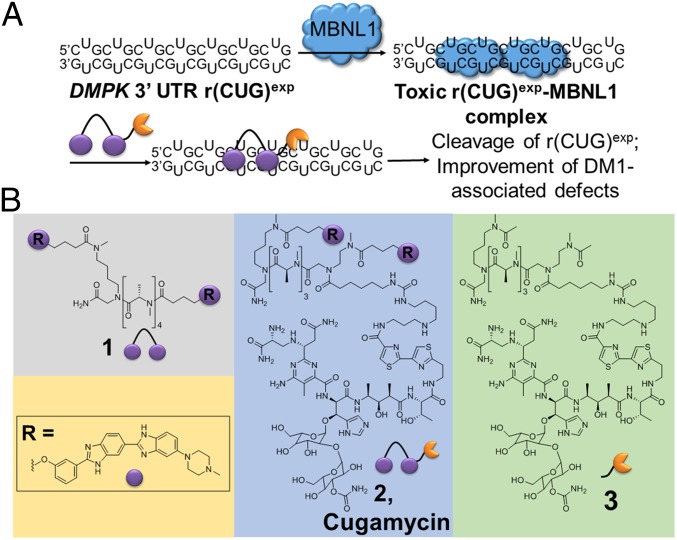
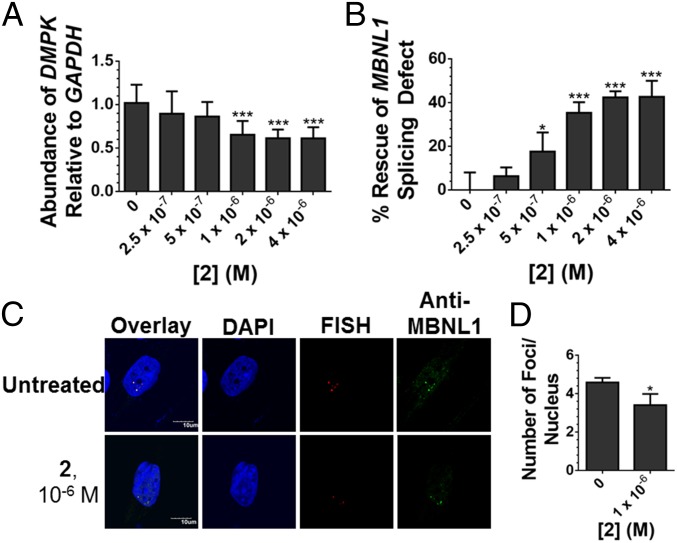
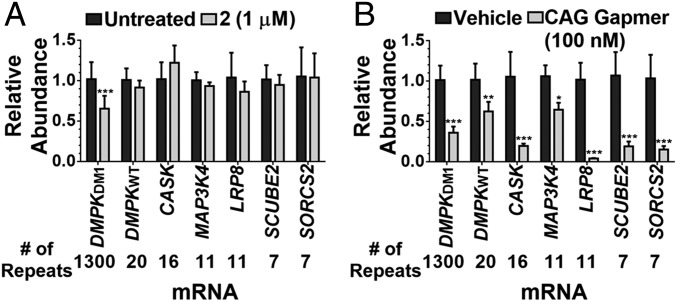
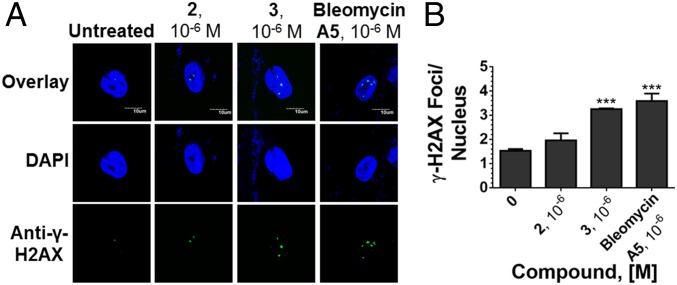
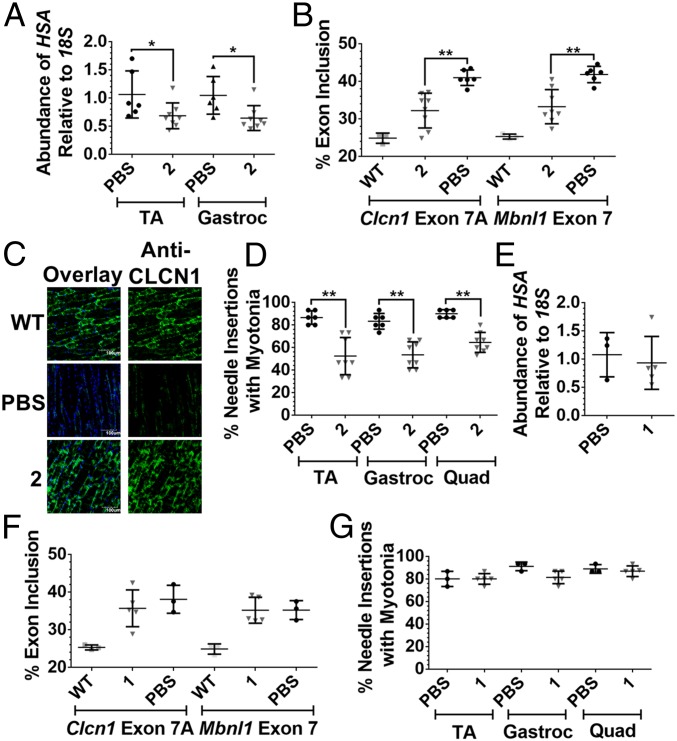
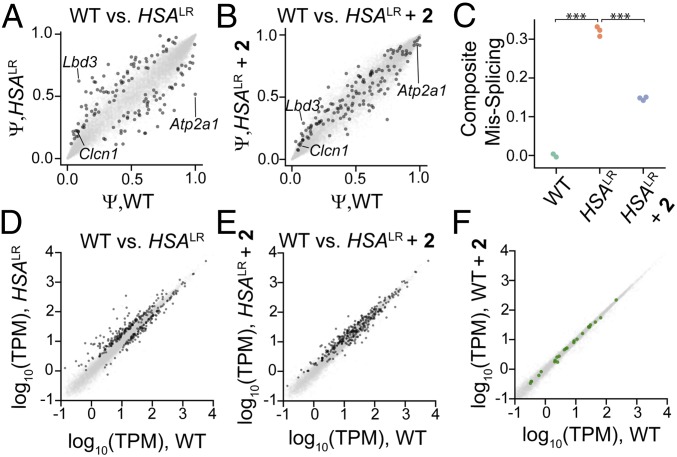
Myotonic dystrophy type 1 (DM1) is an incurable neuromuscular disorder caused by an expanded CTG repeat that is transcribed into r(CUG)exp The RNA repeat expansion sequesters regulatory proteins such as Muscleblind-like protein 1 (MBNL1), which causes pre-mRNA splicing defects. The disease-causing r(CUG)exp has been targeted by antisense oligonucleotides, CRISPR-based approaches, and RNA-targeting small molecules. Herein, we describe a designer small molecule, Cugamycin, that recognizes the structure of r(CUG)exp and cleaves it in both DM1 patient-derived myotubes and a DM1 mouse model, leaving short repeats of r(CUG) untouched. In contrast, oligonucleotides that recognize r(CUG) sequence rather than structure cleave both long and short r(CUG)-containing transcripts. Transcriptomic, histological, and phenotypic studies demonstrate that Cugamycin broadly and specifically relieves DM1-associated defects in vivo without detectable off-targets. Thus, small molecules that bind and cleave RNA have utility as lead chemical probes and medicines and can selectively target disease-causing RNA structures to broadly improve defects in preclinical animal models.

Keywords: RNA; RNA splicing; chemical biology; genetic disease; nucleic acids.


Conflict of interest statement

Conflict of interest statement: M.D.D. and E.T.W. are consultants for Expansion Therapeutics. S.G.R. is a current employee of Expansion Therapeutics.

Figures

Fig. 1.
Fig. 1.
Design of small molecules that cleave r(CUG)exp. (A) r(CUG)exp in the 3′ UTR of the DMPK mRNA folds into a hairpin structure and sequesters MBNL1, resulting in pre-mRNA splicing defects. Compound 2 binds to r(CUG)exp, displaces MBNL1, and cleaves the toxic RNA repeat, improving DM1-associated defects. (B) Chemical structures of 1, 2, and 3.
Fig. 2.
Fig. 2.
Activity of 2 in DM1 myotubes. (A) Effect of 2 on r(CUG)exp-containing DMPK levels in DM1 myotubes as determined by RT-qPCR. Error bars represent SD, n = 3 biological replicates, ***P < 0.001 (one-way ANOVA). (B) Ability of 2 to rescue the MBNL1 exon 5 splicing defect. Error bars represent SD, n = 3 biological replicates, *P < 0.05, ***P < 0.001 (one-way ANOVA). (C) Representative images of r(CUG)exp-MBNL1 foci in DM1 myotubes treated with 2. (D) Quantification of r(CUG)exp-MBNL1 foci/nucleus. Error bars represent SD, n = 3 biological replicates, 40 nuclei counted per replicate, *P < 0.05 (t test).
Fig. 3.
Fig. 3.
Recognition of r(CUG)exp by 2 and an oligonucleotide at a dose where they improve DM1-associated splicing defects similarly. (A) Effect of 2 (1 µM) on RNAs containing more than six r(CUG) repeats expressed in DM1 myotubes as determined by RT-qPCR; dark gray bars indicate untreated cells and light gray bars indicate cells treated with 2. (B) Effect of an r(CUG) repeat-targeting antisense oligonucleotide (100 nM) on RNAs containing more than six r(CUG) repeats expressed in DM1 myotubes as determined by RT-qPCR; dark gray bars indicate vehicle-treated cells and light gray bars indicate cells treated with antisense oligonucleotide. Error bars represent SD, n = 3 biological replicates, *P < 0.05, **P < 0.01, ***P < 0.001 (t test).
Fig. 4.
Fig. 4.
Effects of small molecules on the DNA damage response pathway. (A) Representative images from γ-H2AX immunofluorescence to assess DNA damage in DM1 myotubes upon treatment with 2, 3, or bleomycin A5. (B) Quantification of the number of γ-H2AX foci/nucleus. Error bars represent SD; n = 3 biological replicates, with 40 nuclei counted per replicate; ***P < 0.001 (one-way ANOVA).
Fig. 5.
Fig. 5.
Evaluation of 1 and 2 in HSALR mice. (A) RT-qPCR analysis of the r(CUG)exp-containing HSA transgene in TA and gastrocnemius (gastroc) muscles of vehicle-treated and 2-treated mice; *P < 0.05 (t test). (B) Effect of 2 on Clcn1 exon 7A and Mbnl1 exon 7 splicing in TA muscle of HSALR mice; **P < 0.01 (one-way ANOVA). (C) Representative images of CLCN1 immunostaining in TA muscle sections. (D) Effect of 2 on myotonia in the TA, gastroc, and quadriceps muscles of HSALR mice; **P < 0.01 (t test). Error bars represent SD, n = 3 mice for WT, n = 6 mice for vehicle-treated, n = 8 mice for 2-treated. (E) RT-qPCR analysis of the r(CUG)exp-containing HSA transgene in TA muscle of vehicle-treated and 1-treated mice. (F) Effect of 1 on Clcn1 exon 7A and Mbnl1 exon 7 splicing in the TA muscle of HSALR mice. (G) Effect of 1 on myotonia in the TA, gastroc, and quadriceps muscles of HSALR mice. Error bars represent SD, n = 3 mice for WT, n = 3 mice for vehicle-treated, n = 5 mice for 1-treated.
Fig. 6.
Fig. 6.
RNA-seq analysis of gene expression changes upon treatment with 2. (A) Splicing events in vehicle-treated HSALR mice and WT mice. The x-axis denotes Ψ in WT mice and the y-axis denotes Ψ in vehicle-treated HSALR mice. Dark gray spots represent significantly misspliced events. (B) 2 rescues splicing patterns in HSALR mice. The x-axis denotes Ψ in WT mice and the y-axis denotes Ψ in 2-treated HSALR mice. Dark gray spots indicate events that are mis-spliced in HSALR mice; those that move toward the diagonal compared with A are rescued by 2. (C) Composite mis-splicing score across 70 splicing events, indicating rescue of these events upon treatment with 2. *** P < 0.0001, t test. (D) Gene expression changes in vehicle-treated HSALR mice and WT mice. The x-axis denotes gene expression in WT mice and the y-axis denotes gene expression in vehicle-treated HSALR mice. Significantly dysregulated genes are indicated by dark gray spots. (E) Quantification of gene expression in 2-treated HSALR mice (y-axis) compared with WT mice (x-axis). Dark gray points indicate dysregulated genes in HSALR mice, and dark gray points moving toward the diagonal compared with D are rescued by 2. (F) Treatment of WT mice with 2 elicits minimal changes in gene expression. Log2 (vehicle-treated WT) is plotted as a function of log2 (2-treated WT). Genes with >9 contiguous CTG repeats are shown in green.

References

    1. Kole R, Krainer AR, Altman S. RNA therapeutics: Beyond RNA interference and antisense oligonucleotides. Nat Rev Drug Discov. 2012;11:125–140. - PMC - PubMed
    1. O’Connell MR, et al. Programmable RNA recognition and cleavage by CRISPR/Cas9. Nature. 2014;516:263–266. - PMC - PubMed
    1. Stojic L, et al. Specificity of RNAi, LNA and CRISPRi as loss-of-function methods in transcriptional analysis. Nucleic Acids Res. 2018;46:5950–5966. - PMC - PubMed
    1. Schlünzen F, et al. Structural basis for the interaction of antibiotics with the peptidyl transferase centre in eubacteria. Nature. 2001;413:814–821. - PubMed
    1. Carter AP, et al. Functional insights from the structure of the 30S ribosomal subunit and its interactions with antibiotics. Nature. 2000;407:340–348. - PubMed

Publication types