. 2019 Mar 29;10(1):1421.
doi: 10.1038/s41467-019-09338-z.

Nucleoside analogue activators of cyclic AMP-independent protein kinase A of Trypanosoma

Affiliations

Nucleoside analogue activators of cyclic AMP-independent protein kinase A of Trypanosoma

Sabine Bachmaier et al. Nat Commun. .

Abstract

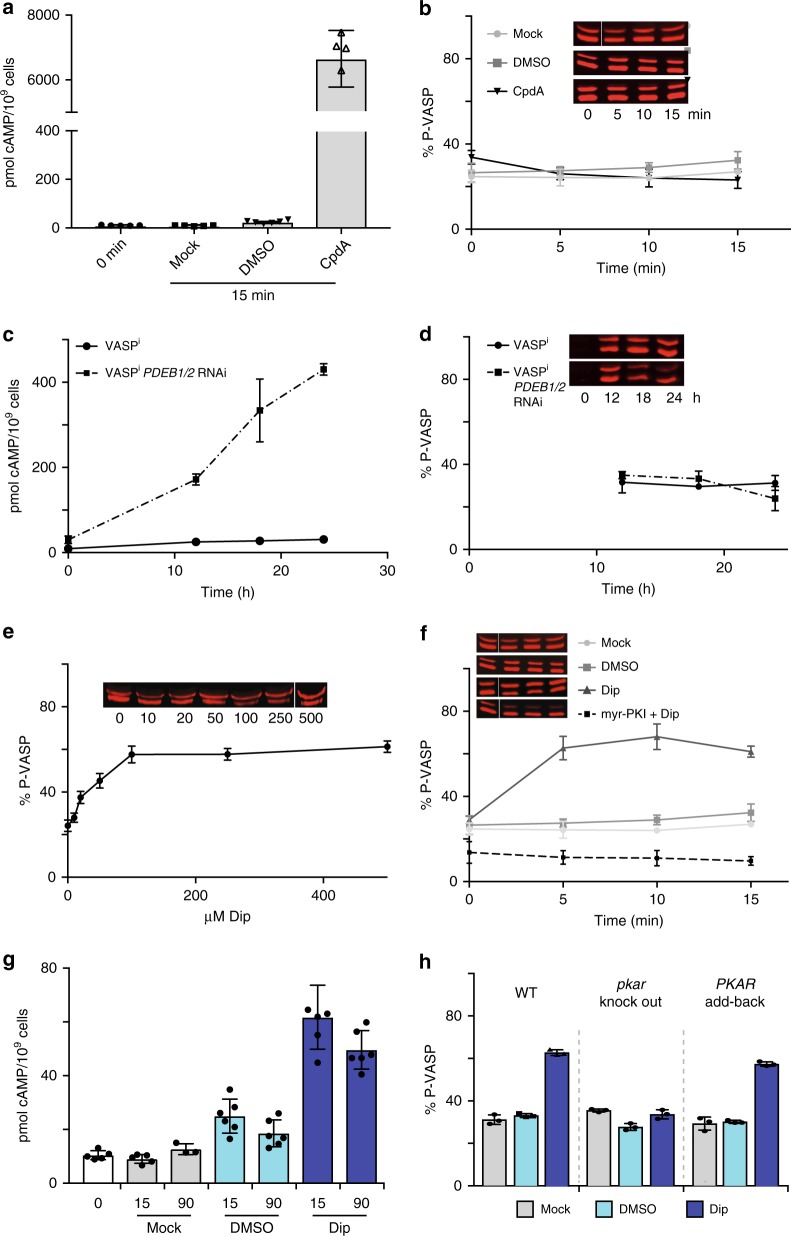
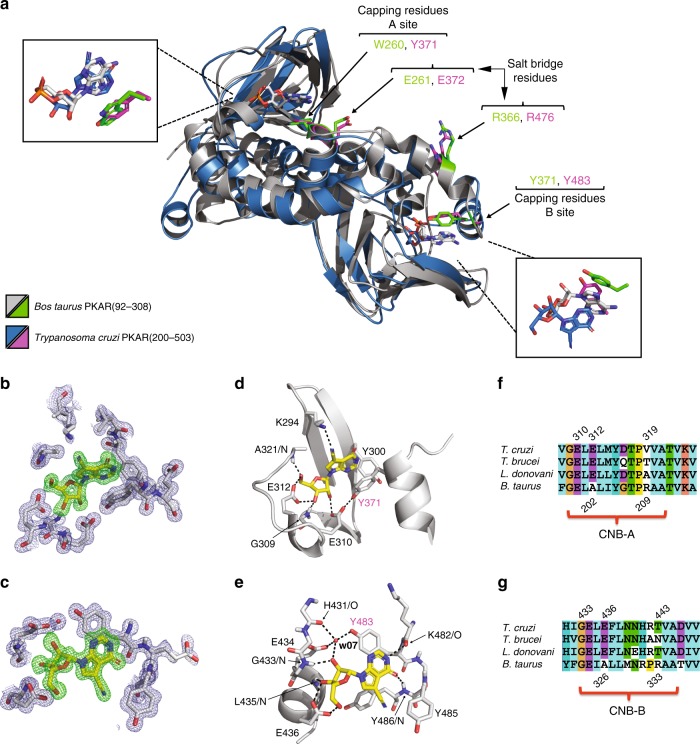
Protein kinase A (PKA), the main effector of cAMP in eukaryotes, is a paradigm for the mechanisms of ligand-dependent and allosteric regulation in signalling. Here we report the orthologous but cAMP-independent PKA of the protozoan Trypanosoma and identify 7-deaza-nucleosides as potent activators (EC50 ≥ 6.5 nM) and high affinity ligands (KD ≥ 8 nM). A co-crystal structure of trypanosome PKA with 7-cyano-7-deazainosine and molecular docking show how substitution of key amino acids in both CNB domains of the regulatory subunit and its unique C-terminal αD helix account for this ligand swap between trypanosome PKA and canonical cAMP-dependent PKAs. We propose nucleoside-related endogenous activators of Trypanosoma brucei PKA (TbPKA). The existence of eukaryotic CNB domains not associated with binding of cyclic nucleotides suggests that orphan CNB domains in other eukaryotes may bind undiscovered signalling molecules. Phosphoproteome analysis validates 7-cyano-7-deazainosine as powerful cell-permeable inducer to explore cAMP-independent PKA signalling in medically important neglected pathogens.


Conflict of interest statement

F.S. and H.-G.G. are employed by the BIOLOG Life Science Institute that sells nucleosides and nucleotides that were used in this study or were developed for this study. The other authors declare no competing interests.

Figures

Fig. 1
Fig. 1
PKA holoenzyme complexes in T. brucei. a Domain architecture of PKAR (top) and PKAC (bottom) orthologues from T. brucei (Tb) (TriTrypDB accessions: PKAR, Tb927.11.4610; PKAC1, Tb927.9.11100; PKAC2, Tb927.9.11030; PKAC3, Tb927.10.13010) compared to human (Hs) PKA (Uniprot accessions: PKARIα, P10644; PKACα, P17612). LRR leucine-rich repeat region, DD dimerization/docking domain, CNB cyclic nucleotide binding domain, kinase kinase domain. b Genotypes of cell lines with in situ tagged PKAC1 (Ty1-C1, cyan; Ty1 epitope tag in magenta) and PKAR (R-PTP, blue; PTP-tag in black) compared to wild type (WT). The phleomycin resistance cassette (BLE, grey) is indicated. c Two-colour fluorescent western blot analysis of the double tagged cell line (c1/Ty1-C1 R-PTP) using anti-PKAR and anti-PKAC1/2 (left panel, red signals), and anti-Ty1 and anti-PFR-A/C (loading control) (middle panel, green signals). The merge of both channels is shown on the right panel. Ty1 causes a mobility shift of PKAC1 and enables the detection of PKAC2 in cell lines devoid of wild type PKAC1. Note that PKAC1 and PKAR appear as doublet bands that we interpret as modification (PKAC1*) and allelic polymorphism, respectively, in the MiTat 1.2 cell line. d PTP affinity purification followed by western blot analysis of double tagged and control cell lines using antibodies as in c and anti-PKAC3. Equivalent amounts of soluble input material (IN), flow-through (FT), washes, and 13 equivalents of the eluate (Elu) were loaded. Source data to c and d are provided as a Source Data file
Fig. 2
Fig. 2
T. brucei PKA is not activated by cAMP. a Intracellular [cAMP] (mean ± SD of independent replicates; n = 5 (0 min, Mock); n = 6 (DMSO, CpdA)) and b in vivo PKA activity (with western blot inset) in cells treated or not (Mock) for 15 min with the PDE inhibitor CpdA (10 µM; now renamed as NPD-001) or solvent (1% DMSO). Release of cAMP into the medium upon treatment was neglectable (Supplementary Fig. 3d). c Intracellular [cAMP] (mean ± SD of n = 3 independent replicates) and d in vivo PKA activity (with western inset) upon inducible (1 µg ml−1 tetracycline) RNAi repression of PDEB1 and PDEB2. Kinase activity cannot be determined at time 0, since the RNAi cell line (VASPi PDEB1/2 RNAi) and the control line (VASPi) both harbour a tetracycline inducible VASP transgene. e Dose response of in vivo PKA activity upon 15 min treatment with dipyridamole (Dip). f Time course of in vivo PKA activity upon treatment with 100 µM dipyridamole (Dip) or dipyridamole + myr-PKI(14–22) or solvent (1% DMSO) or Mock. g Intracellular [cAMP] (mean ± SD of independent replicates; n = 5 (0 min, Mock 15 min); n = 3 (Mock 90 min); n = 6 (DMSO, Dip)) upon treatment with 100 μM dipyridamole (Dip) or 1% solvent (DMSO) or Mock for 15 or 90 min. h In vivo PKA activity upon treatment as in g for 15 min in wild type (WT), homozygous pkar knock out and PKAR add-back (in situ rescue) cells. For all in vivo kinase reporter assays, one representative western blot is shown as inset and data points are mean ± SD of n = 3 independent replicates. Source data are provided as a Source Data file
Fig. 3
Fig. 3
Activators of trypanosome PKA. a Hit compounds with their EC50 of in vivo PKA activity (VASP reporter assay, mean ± SD, n = 3 independent replicates, representative western blots as inset) and their EC50 of in vitro kinase activity (kemptide phosphorylation by T. brucei PKAR-PKAC1 holoenzyme expressed in L. tarentolae). A representative dose response for Toyo (n = 5), 5-I-Tu (n = 4), 5-Br-Tu (n = 2), tubercidin (n = 2), and sangivamycin (n = 1) is shown with SD of technical duplicates or triplicates. Binding parameters to T. brucei PKAR(199–499) expressed in E. coli were determined by isothermal titration calorimetry (ITC). The power differential (DP) between the reference and sample cells upon injection was measured as a function of time (inset). The main plot presents the total heat exchange per mole of injectant (integrated peak areas from inset) as a function of the molar ratio of ligand to protein. One out of three independent replicates is shown. b Data for 7-CN-7-C-Ino as in a; for number of independent replicates see Table 1. The EC50 and KD values given in a and b are rounded values from Table 1. c Thermodynamic signature (ΔG in blue, ΔH in green, and −TΔS in red) compiled from ITC measurements (mean ± SD of n = 3 independent replicates) in a and b. Source data are provided as a Source Data file
Fig. 4
Fig. 4
Co-crystal structure of trypanosome PKAR with 7-CN-7-C-Ino. a Structural alignment of T. cruzi PKAR(200–503) (chain representation in blue) and Bos taurus PKARIα(92–308) (PDB 1RGS, chain representation in grey). The two capping residues and the salt bridge pair are highlighted by their carbon atoms colour-coded as green and magenta in the B. taurus and T. cruzi PKAR structures, respectively. The overlay of ligand poses is shown in the blow-ups and the π-stacking interactions in both sites for both proteins are highlighted. b, c Fo–Fc (3σ, green) and 2Fo–Fc (1σ, blue) maps of TcPKAR CNB-A and CNB-B, respectively, showing 7-CN-7-C-Ino modelled to fit the electron densities. d, e Hydrogen bonding network (black dashed lines) of 7-CN-7-C-Ino bound to TcPKAR(200–503) CNB-A and CNB-B, respectively. The capping residues in CNB-A (Y371) and CNB-B (Y483) are labelled in magenta. 3D versions of a, d, and e are available as Supplementary Movie 1, 3, and 4, respectively. f, g Sequence alignment of PKAR in CNB-A and CNB-B, respectively, of representative kinetoplastid parasites with a mammalian PKAR (B. taurus PKARIα) as reference. Numbering refers to T. cruzi (top) and B. taurus (bottom), respectively
Fig. 5
Fig. 5
Target phosphorylation and expression changes. a Global display of proteins phosphorylated at RXXS/T sites. Wild type (WT) or ∆pkar/pkar (pkar KO) cells were treated or not (−) with 2 µM Toyo or 7-CN-7-C-Ino (Ino) for 10 min and lysates were subjected to western blotting with anti-phospho-RXXS*/T* and anti-PFR-A/C as loading control. M: protein molecular weight marker. b Volcano plot representation of phosphopeptides quantified by label-free phosphoproteome analysis. Phosphopeptides are plotted according to p-value and fold change caused by treatment of T. brucei WT cells with 7-CN-7-C-Ino (8 µM, 15 min, n = 4 independent experiments) in comparison to untreated cells (n = 4 independent experiments). Phosphopeptides that change significantly in abundance (FDR ≤ 0.05, s0 = 2) and contain phosphosites matching PKA consensus motifs (R/K-X-X-S/T, R/K-X-S/T)5 are shown as red dots; significantly changed phosphopeptides without PKA consensus motifs are shown in black. c Pie charts showing the fraction of PKA consensus motifs (red) within the downregulated (n = 84, left) or upregulated (n = 642, right) phosphosites. The frequency of individual subsets of PKA motifs (upregulated) was compared to the human PKA site motif frequency retrieved from the PhosphoSitePlus database (https://www.phosphosite.org). d Abundance changes of metacaspase 4 (MCA4) and PKAC1/2 in WT or e pkar KO cells after treatment with 4 µM 7-CN-7-C-Ino (Ino) or Toyo in a 24-h time course. Western blot signals were normalized to the loading control PFR-A/C; untreated WT cells were set to 1. Source data to a and ce are provided as a Source Data file

References

    1. Taylor SS, Ilouz R, Zhang P, Kornev AP. Assembly of allosteric macromolecular switches: lessons from PKA. Nat. Rev. Mol. Cell Biol. 2012;13:646–658. doi: 10.1038/nrm3432. - DOI - PMC - PubMed
    1. Kannan N, et al. Evolution of allostery in the cyclic nucleotide binding module. Genome Biol. 2007;8:R264. doi: 10.1186/gb-2007-8-12-r264. - DOI - PMC - PubMed
    1. Körner H, Sofia HJ, Zumft WG. Phylogeny of the bacterial superfamily of Crp-Fnr transcription regulators: exploiting the metabolic spectrum by controlling alternative gene programs. FEMS Microbiol. Rev. 2003;27:559–592. doi: 10.1016/S0168-6445(03)00066-4. - DOI - PubMed
    1. Joyce MG, et al. CprK crystal structures reveal mechanism for transcriptional control of halorespiration. J. Biol. Chem. 2006;281:28318–28325. doi: 10.1074/jbc.M602654200. - DOI - PubMed
    1. Shabb JB. Physiological substrates of cAMP-dependent protein kinase. Chem. Rev. 2001;101:2381–2411. doi: 10.1021/cr000236l. - DOI - PubMed

Publication types

MeSH terms