. 2019 Mar 29;10(1):1411.
doi: 10.1038/s41467-019-09139-4.

Inferring HIV-1 transmission networks and sources of epidemic spread in Africa with deep-sequence phylogenetic analysis

Collaborators, Affiliations

Inferring HIV-1 transmission networks and sources of epidemic spread in Africa with deep-sequence phylogenetic analysis

Oliver Ratmann et al. Nat Commun. .

Abstract

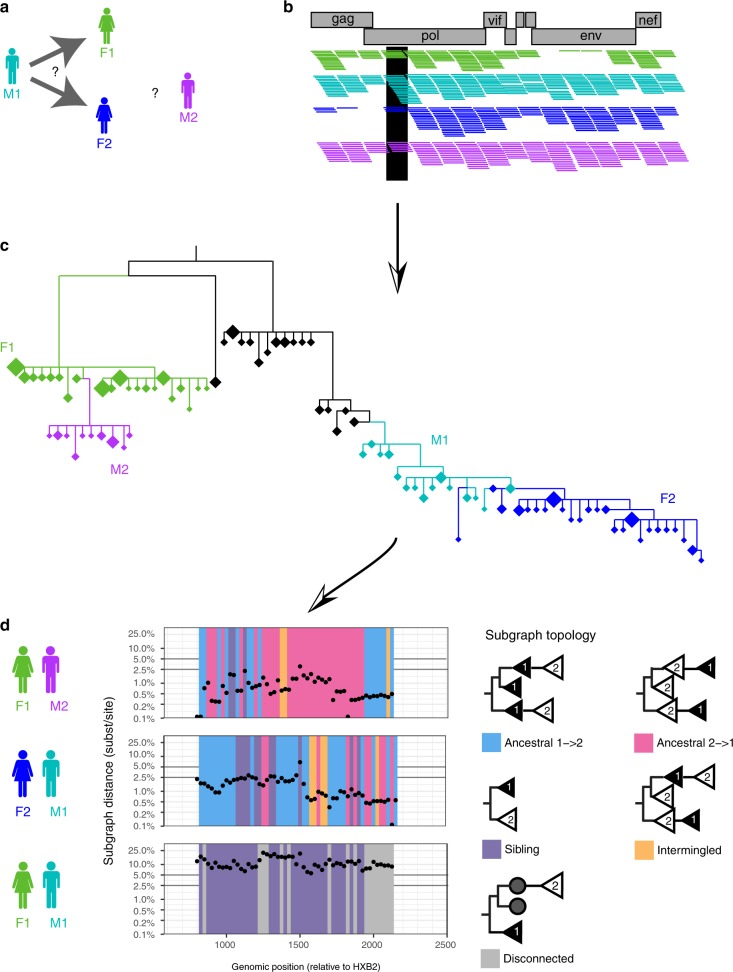
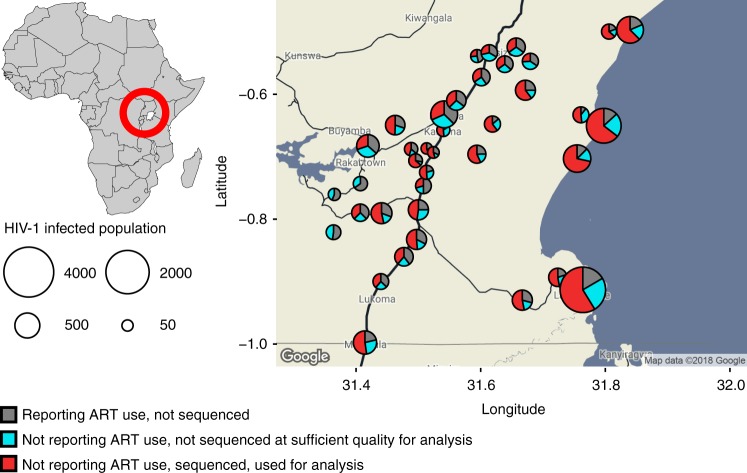
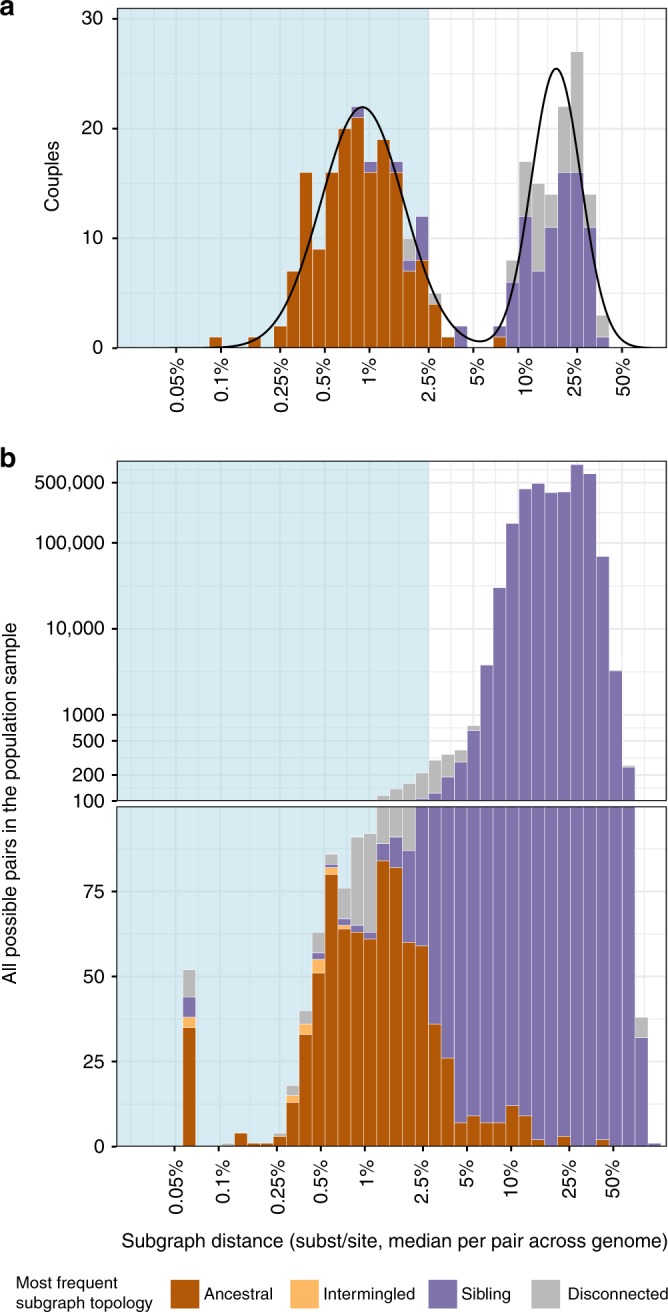
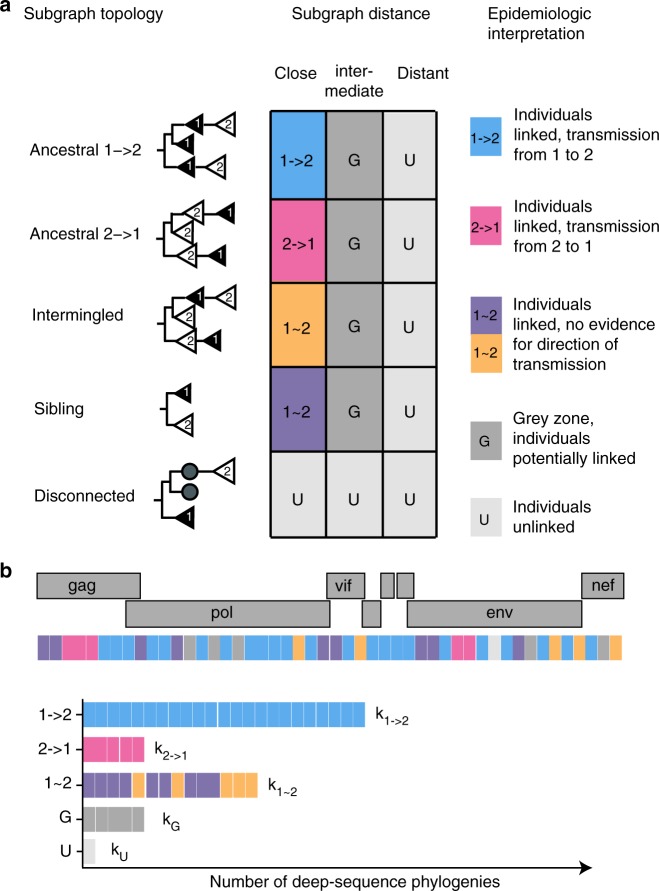
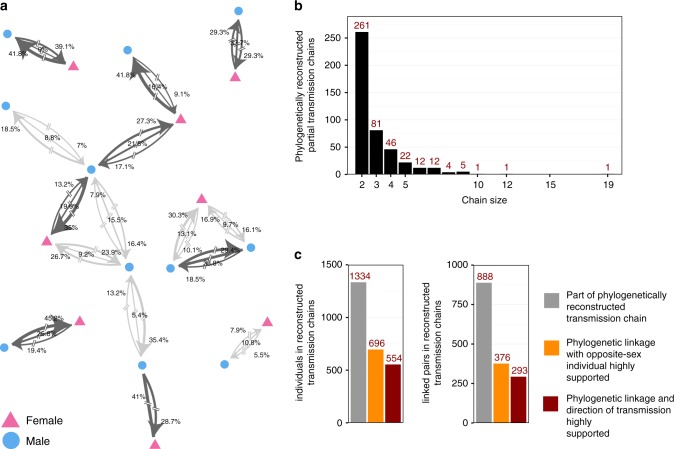
To prevent new infections with human immunodeficiency virus type 1 (HIV-1) in sub-Saharan Africa, UNAIDS recommends targeting interventions to populations that are at high risk of acquiring and passing on the virus. Yet it is often unclear who and where these 'source' populations are. Here we demonstrate how viral deep-sequencing can be used to reconstruct HIV-1 transmission networks and to infer the direction of transmission in these networks. We are able to deep-sequence virus from a large population-based sample of infected individuals in Rakai District, Uganda, reconstruct partial transmission networks, and infer the direction of transmission within them at an estimated error rate of 16.3% [8.8-28.3%]. With this error rate, deep-sequence phylogenetics cannot be used against individuals in legal contexts, but is sufficiently low for population-level inferences into the sources of epidemic spread. The technique presents new opportunities for characterizing source populations and for targeting of HIV-1 prevention interventions in Africa.


Conflict of interest statement

The authors declare no competing interests.

Figures

Fig. 1
Fig. 1
Inferring the direction of transmission from HIV-1 deep-sequence data. a The principles of deep-sequence viral phylogenetic analysis are illustrated on data from male M1 (turquoise) who initially reported partnership with female F1 (green), and later with female F2 (blue). We also included data from another male M2 whose virus was genetically close to that of F1, although a partnership was not reported (see Supplementary Figure 2). b Viral genomes from all individuals were deep-sequenced, generating short viral sequence fragments (reads) that cover the genome. Reads were mapped against HIV-1 reference sequences, and are shown as horizontal coloured lines. Genomic windows covering the whole genome were defined; one is highlighted in black. For each window, overlapping reads were extracted, aligned, and a phylogeny was reconstructed using standard methods. c Each phylogeny contained many unique reads per individual that tended to cluster in the phylogeny. This enabled us to reconstruct parts of the tree (subgraphs) in which virus was inferred to be in each individual (colours label individuals; diamonds indicate unique read fragments, and the size of diamonds reflects copy number). In the phylogeny shown, virus from M1 (turquoise) was phylogenetically ancestral to that from F2 (blue), suggesting that transmission occurred from M1 to F2. Similarly, virus from F1 (green) was phylogenetically ancestral to that from M2 (purple), suggesting that transmission occurred from F1 to M2. For ease of illustration, only a part of the entire reconstructed deep-sequence phylogeny is shown. HIV-1 reference sequences and virus from another phylogenetically distant individual that is in-between the F1−M2 and M1−F2 pair are shown in black. d Viral deep-sequence phylogenies were reconstructed for each 250 bp genomic window to determine the statistical support of inferences on transmission and the direction of transmission. For each pair of individuals, the scan plots show the shortest patristic distance between subgraphs of both individuals (y-axis) and the topological relationship between subgraphs of both individuals (colours) across the genome. Deep-sequence data of sufficient quality were available for the HIV-1 gag gene, and the genomic position on the x-axis indicates the start of each 250 bp read alignment
Fig. 2
Fig. 2
HIV-1 deep-sequencing in the Rakai Community Cohort, Uganda. Individuals aged 15–49 years were surveyed from August 2011 to January 2015 in 40 communities. In all, 5142 men and women were found positive (circles). Of those, 1264 self-reported using antiretrovirals (grey area of circles), and were not considered further as sequencing is challenging when virus is suppressed by treatment. Samples from 3878 individuals were deep-sequenced (see Methods). Of those, samples from 1226 (31.6%) individuals were not of sufficient quality for analysis (blue area of circles). Specifically, for phylogeny reconstruction, only paired-end merged reads of at least 250 base pairs (bp) in length were used, and subsequent deep-sequence inferences were performed on individuals whose reads covered the HIV-1 genome at a depth of at least 30 reads for 750 bp or more. Thus, samples from 2652 individuals (red area of circles) were used for molecular epidemiological analyses, corresponding to an estimated 45.1% of eligible and infected individuals with unsuppressed virus in RCCS communities
Fig. 3
Fig. 3
Deep-sequence phylogenetic data in the population-based sample. To highlight the characteristics of deep-sequence phylogenetic data in a population-based sample, we compared phylogenetic patterns among couples in whom both partners were positive to the patterns in the larger population-based sample. a Analysis of 331 couples. For each couple, their subgraph distances and subgraph topologies were calculated in each deep-sequence phylogeny across the genome as shown in Fig. 1d. Subgraph distances were standardized to the average evolutionary rate of the HIV-1 gag and polymerase genes (see Methods). Information from all deep-sequence phylogenies was summarized by median distance and the most frequent subgraph topology (colours). The distribution of median distances had a clear bimodal shape, separating couples into two groups that were either phylogenetically closely or distantly related. The distribution of median distances was well described by a two-component lognormal mixture model (black lines). 95% of couples in the first component had distances below 0.025 substitutions per site (light blue area) and 99% of couples in the first component had distances below 0.05 substitutions per site. We used these thresholds to classify couples into phylogenetically close and distant. 93.3% of phylogenetically close couples also had mostly ancestral subgraphs. b Analysis of 3,515,226 possible pairs in the population-based sample. For visualization purposes, smaller numbers are displayed on natural scale and larger numbers on log scale. The distribution of median distances was not bimodal, and subgraph distances did not clearly separate pairs of individuals into closely or distantly related pairs. 48/814 (5.9%) pairs with mostly ancestral subgraphs were phylogenetically distant as defined by the couples’ analysis. One hundred and eighteen phylogenetically close pairs had mostly intermingled or sibling subgraphs and were missed by subgraph ancestry, indicating that all types of subgraph topologies in combination with subgraph distance should be used for inference of population-level transmission networks
Fig. 4
Fig. 4
Epidemiological interpretation of deep-sequence phylogenetic data. a The 5 × 3 contingency table describes how deep-sequence phylogenetic patterns between two individuals were epidemiologically interpreted. Viral phylogenetic patterns between two individuals were summarized in terms of subgraph distance and subgraph topologies. There are five possible subgraph topologies between two individuals. All subgraphs of person 1 can be disconnected from the subgraphs of person 2 by another individual. If subgraphs of two individuals are adjacent, i.e. not disconnected by another individual, they can be consistently ancestral to each other in the same direction, intermingled in that some subgraphs are ancestral in one direction and others in the opposite direction, or siblings. The subgraph distance between viral subgraphs was stratified into ‘close’ (<0.025 substitutions per site), ‘intermediate’ (0.025–0.05 substitutions per site), and ‘distant’ (>0.05 substitutions per site) based on the couples’ analysis shown in Fig. 3a. Epidemiologic interpretations are indicated in colours. When only one sequence per individual is available, subgraphs of individuals correspond to the tips in a phylogeny, are either disconnected or siblings, and thus the direction of transmission is not inferable. b To determine the statistical support in inferences on transmission and the direction of transmission, analyses were repeated across the genome and the observed relationship types 1 → 2, 2 → 1, 1 ~ 2, G, U were counted (respectively denoted by k1 → 2, k2 → 1, k1 ~ 2, kG, kU). To avoid overconfidence, an adjustment was made to account for the fact that overlapping windows are not statistically independent (see Supplementary Note 1). Evidence for no transmission between individuals 1 and 2 was estimated by μ^12=kUn; evidence for transmission between 1 and 2 was estimated by λ^12=(k12+k1~2+k21)n; and evidence for transmission from 1 to 2 given that transmission occurred between 1 and 2 was estimated by δ^12=k12(k12+k21); see Methods for further details
Fig. 5
Fig. 5
Phylogenetically reconstructed transmission networks. Four hundred and forty-six transmission networks comprising 1334 individuals and 888 linkages could be reconstructed from the population-based sample. a Illustrative set of six transmission networks with nodes indicating gender. In comparison to phylogenetic clustering analyses, deep-sequence phylogenetic analysis provided evidence about the direction of transmission. Edges connecting two individuals were labelled with the statistical support for transmission in the indicated direction (for directed edges), or for transmission with no evidence for direction (for undirected edges), calculated as the proportion of deep-sequence phylogenies supporting each case (see Fig. 4). The sum of the three weights quantified the phylogenetic support for direct transmission on a scale between 0 and 1 (λ^ij, see Fig. 4). Pairs of individuals with high support for direct transmission were highlighted in dark grey (λ^ij>0.6). All edges were broken to indicate the possibility of unsampled intermediates. b Sizes of reconstructed transmission chains. The majority of transmission chains (261/446, 58.5%) were pairs, though 36 chains had more than five individuals. c Numbers of individuals (left) and linked pairs (right) in reconstructed transmission chains. Many linked pairs were weakly supported or between individuals of the same sex, which indicated the presence of unobserved intermediates or common sources. In all, 376 male−female pairs had high support (λ^ij>0.6) (orange bars), and of those, the direction of transmission could be inferred with high support (δ^ij>0.6) in 293/376 (77.9%) pairs (burgundy bars)
Fig. 6
Fig. 6
Direct transmission cannot be established when HIV-1 sequences from two individuals are intermingled in deep-sequence phylogenies. It was previously proposed that certain patterns in deep-sequence phylogenies—intermingled subgraphs of two individuals as shown in panel (a) in red and blue—rule out the presence of unobserved common sources and/or intermediates, and could thus prove that direct transmission occurred between two individuals. We revisited this prediction on our data, and found two female−female pairs with mostly intermingled and near identical subgraphs across the genome. These data indicate that such deep-sequence phylogenetic relationships cannot exclude the possibility of unsampled common sources or intermediates. a One deep-sequence phylogeny is shown for one female−female pair to illustrate their typical phylogenetic relationships. Reads from the two female−female pairs are shown in red and blue, are intermingled, and often nearly identical. The phylogenetically most closely related individuals that acted as controls are highlighted in colours, and reference sequences are shown in grey. One additional female (RkA06713F) was phylogenetically close to both females, though too poorly sampled to resolve phylogenetic relationship. The other individuals were phylogenetically distant or disconnected from the two females by HIV-1 reference sequences, with no relationship to the two females inferred. Deep-sequence phylogenies of all other windows are shown in Supplementary Data 1. b Phyloscan plot of subgraph distances (y-axis) and subgraph topologies (colour) across the genome for both female−female pairs. In the majority of deep-sequence phylogenies, both pairs had intermingled subgraphs that were also near identical

References

    1. UNAIDS. UNAIDS Data 2017, Document JC2910E. http://www.unaids.org/en/resources/documents/2017/2017_data_book (2017).
    1. Grabowski MK, et al. HIV prevention efforts and incidence of HIV in Uganda. N. Engl. J. Med. 2017;377:2154–2166. doi: 10.1056/NEJMoa1702150. - DOI - PMC - PubMed
    1. UNAIDS. Fast-track: ending the AIDS epidemic by 2030, Document JC2686. http://www.unaids.org/en/resources/documents/2014/JC2686_WAD2014report (2014).
    1. UNAIDS. Empower young women and adolescent girls: fast-track the end of the AIDS epidemic in Africa, Document JC2746. http://www.unaids.org/en/resources/documents/2015/JC2746 (2015).
    1. Salazar-Gonzalez JF, et al. Deciphering human immunodeficiency virus type 1 transmission and early envelope diversification by single-genome amplification and sequencing. J. Virol. 2008;82:3952–3970. doi: 10.1128/JVI.02660-07. - DOI - PMC - PubMed

Publication types