. 2019 Mar 29;10(1):1415.
doi: 10.1038/s41467-019-09180-3.

PiggyBac transposon tools for recessive screening identify B-cell lymphoma drivers in mice

Affiliations

PiggyBac transposon tools for recessive screening identify B-cell lymphoma drivers in mice

Julia Weber et al. Nat Commun. .

Abstract

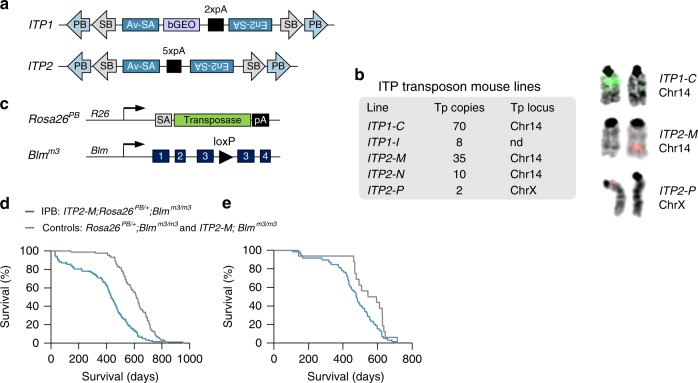
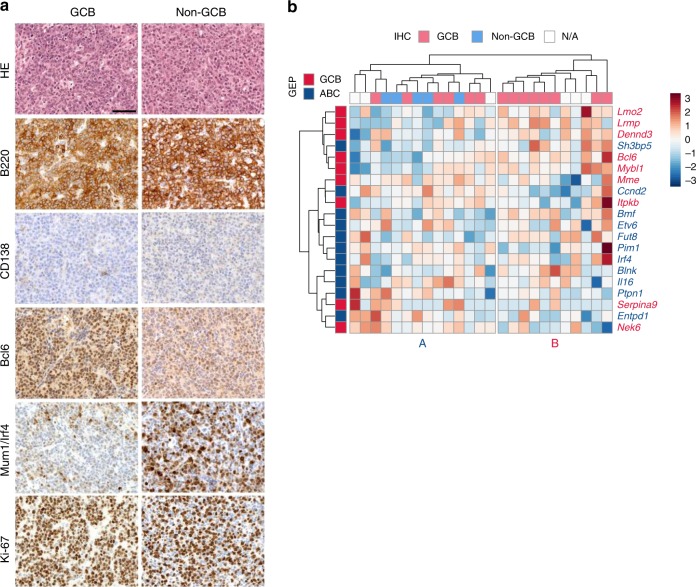
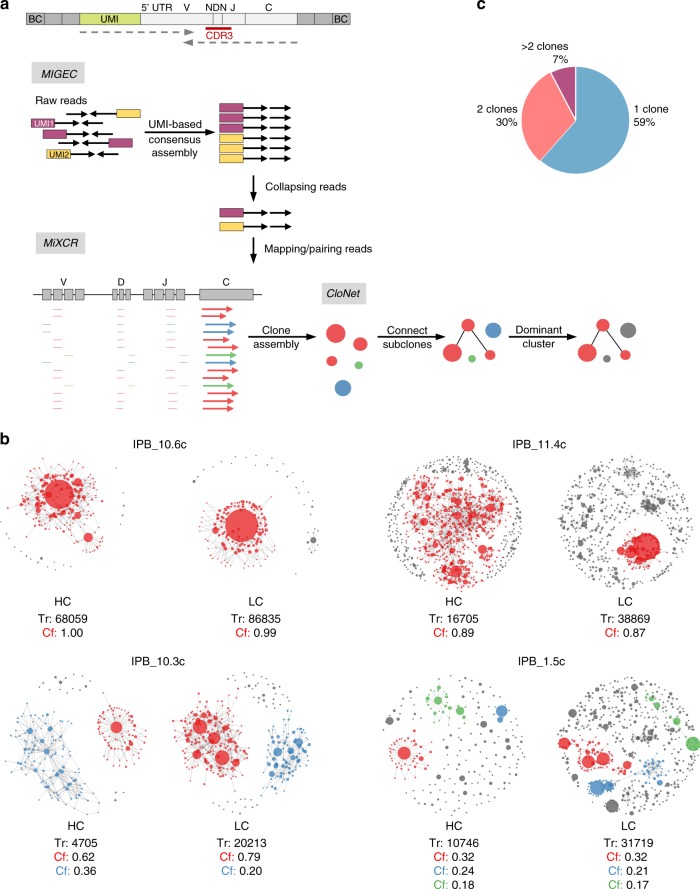
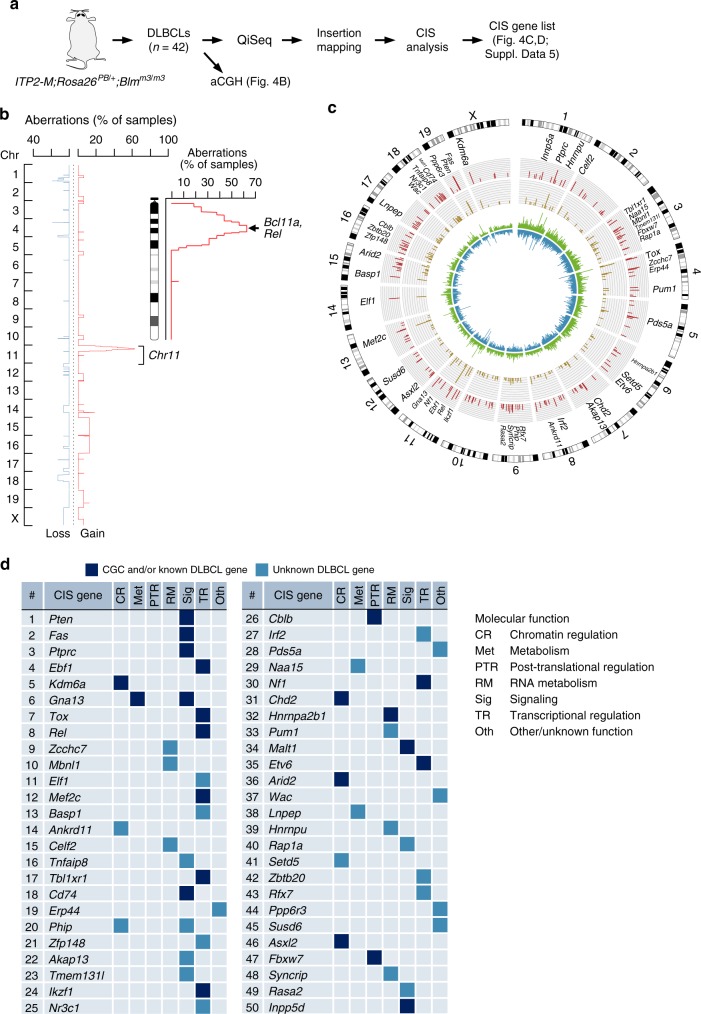
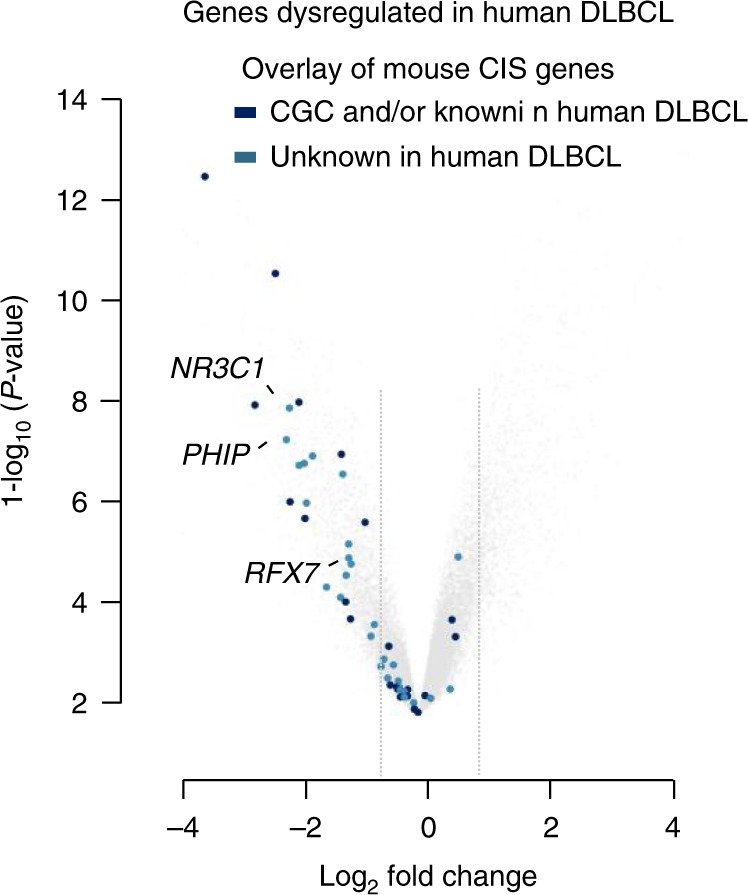
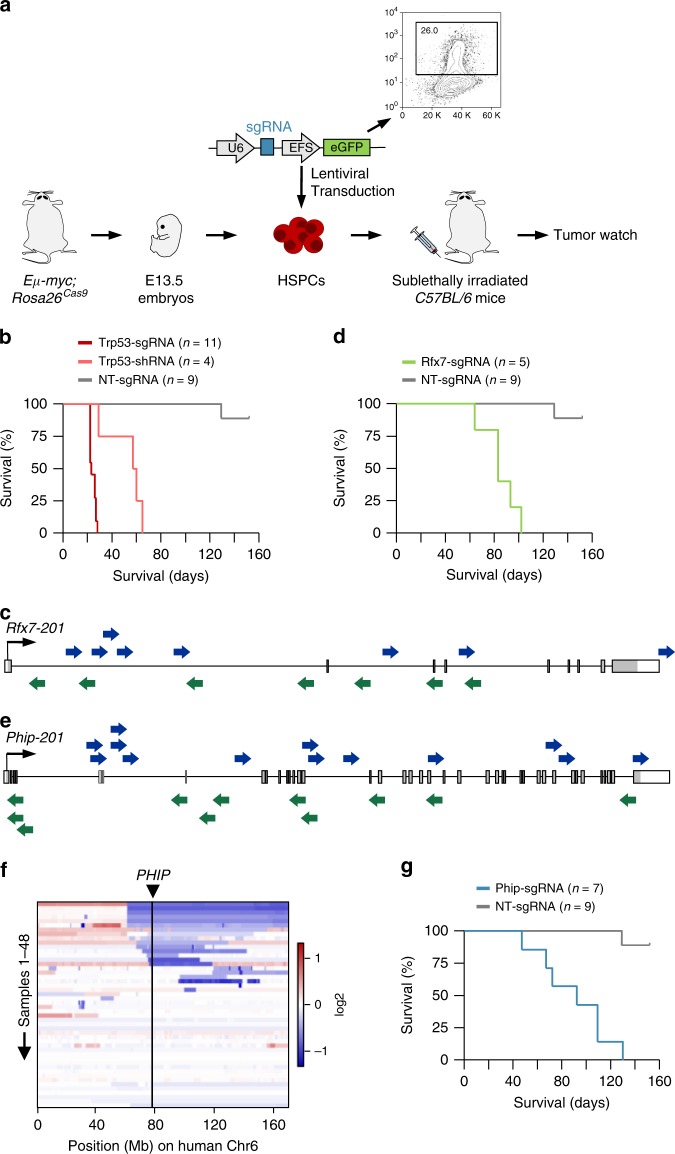
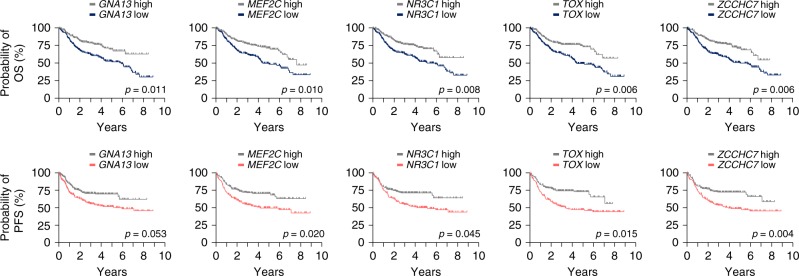
B-cell lymphoma (BCL) is the most common hematologic malignancy. While sequencing studies gave insights into BCL genetics, identification of non-mutated cancer genes remains challenging. Here, we describe PiggyBac transposon tools and mouse models for recessive screening and show their application to study clonal B-cell lymphomagenesis. In a genome-wide screen, we discover BCL genes related to diverse molecular processes, including signaling, transcriptional regulation, chromatin regulation, or RNA metabolism. Cross-species analyses show the efficiency of the screen to pinpoint human cancer drivers altered by non-genetic mechanisms, including clinically relevant genes dysregulated epigenetically, transcriptionally, or post-transcriptionally in human BCL. We also describe a CRISPR/Cas9-based in vivo platform for BCL functional genomics, and validate discovered genes, such as Rfx7, a transcription factor, and Phip, a chromatin regulator, which suppress lymphomagenesis in mice. Our study gives comprehensive insights into the molecular landscapes of BCL and underlines the power of genome-scale screening to inform biology.


Conflict of interest statement

The authors declare no competing interests.

Figures

Fig. 1
Fig. 1
A PiggyBac transposon system for recessive screening in mice. a Structure of "inactivating transposons" ITP1 and ITP2. b Transgenic mouse lines generated using ITP1 or ITP2. Transposon copy numbers within the transgene array as well as the chromosomal donor locus of the array are shown. Chromosomal donor loci for different lines are shown on the right, as detected by fluorescence in situ hybridization with transposon-specific probes. Note that the ITP2-M and ITP2-N mouse lines emerged from a single founder animal. c Structures of the Rosa26PB and Blmm3 alleles as described earlier,. The Rosa26PB knock-in allele expresses the insect version of the PiggyBac transposase constitutively driven by the endogenous Rosa26 promoter. d, e Kaplan–Meier plots showing survival of IPB and control mice. In d the whole cohort is shown (n = 123 [IPB], n = 87 [controls]; p < 0.0001, log-rank test). e represents survival curves for mice displaying hematopoietic tumors characterized histopathologically (n = 59 [IPB], n = 16 [controls]; p = 0.025, log-rank test). PB PiggyBac, SB Sleeping Beauty, Av-SA adenovirus-derived splice acceptor, bGEO β-galactosidase/neomycin resistance reporter including the bovine growth hormone polyadenylation signal, En2-SA Engrailed-2 exon-2 splice acceptor, pA SV40 bidirectional polyadenylation signal, Tp transposon, R26 Rosa26, SA splice acceptor, Blm Bloom syndrome RecQ like helicase, nd not done
Fig. 2
Fig. 2
Characterization and classification of DLBCLs from IPB mice. a Immunohistochemical characterization and sub-classification of mouse DLBCLs (n = 25) from ITP2-M;Rosa26PB/+;Blmm3/m3 (IPB) mice. Microscopic images of two representative DLBCL cases, one classified as germinal center B-cell like (GCB) DLBCL (left panel) and the other as non-GCB DLBCL (right panel). Tumors consist of large-sized neoplastic cells, show strong expression of B220/CD45R (B-cell marker), and are negative for CD138 (plasma cell marker). While the GCB DLBCL sample exhibits high expression of Bcl6 and is negative for Mum1/Irf4, the non-GCB DLBCL case shows the opposite expression pattern. Both tumors show high proliferation rates as indicated by Ki-67 immunohistochemistry (IHC). Scale bar, 50 µm. b RNA sequencing-based sub-classification of DLBCLs (n = 25) from IPB mice. For clustering of the expression data, mouse orthologues to human DLBCL classifier genes were used. The heatmap shows z-transformed expression values. Two main clusters (A and B) were identified. IHC-based subtyping (GCB/non-GCB) of the corresponding tumors is indicated at the top of the heatmap. GEP gene expression profiling, ABC activated B-cell like
Fig. 3
Fig. 3
Clonality analysis of DLBCLs by immune repertoire sequencing. a Workflow for B-cell receptor repertoire analysis. Full-length amplification and sequencing of immunoglobulin heavy and light chain variable regions was performed from bulk tumor tissue (n = 30) of ITP2-M;Rosa26PB/+;Blmm3/m3 (IPB) mice. Top image shows exemplary cDNA product after library preparation with amplified variable and constant region of the immunoglobulin heavy chain (light gray). Unique molecular identifiers (UMI; green) and adapters and barcodes for sequencing (dark gray) were introduced during library preparation. Dotted arrows indicate reads for 300 bp paired-end sequencing. Sequenced raw reads were de-multiplexed and a consensus read sequence for each UMI was assembled with MIGEC. All reads containing an identical UMI were collapsed into one read. MiXCR was used for mapping of reads to mouse reference sequences and clonotype assembly based on the complementarity-determining region 3 (CDR3) region. To visualize the clonal structure of individual tumors, we developed CloNet, a pipeline for generation of clonality network plots. b Exemplary clonality network plots derived from four different mouse DLBCL samples. Plots display clonal structures of immunoglobulin heavy and light chains. Each clone (defined by a unique CDR3 sequence) constitutes a node of the clonality network. The size of the node scales with the third root of the count of the reads assigned to it. A link between two nodes was drawn if the clones mapped to identical V and J genes and differed by at most 1 bp in their CDR3 sequence. The complexity of the branching of a clone (i.e. number of subclones) is a measure for the grade of somatic hypermutation. Clones defined by a unique V(D)J rearrangement that contained more than 10% of the total reads are highlighted in color. Two monoclonal (IPB_10.6c and IPB_11.4c) samples, one biclonal (IPB_10.3c) and one oligoclonal (IPB_1.5c) sample are shown. c Proportion of monoclonal (1 clone), biclonal (2 clones), and oligo-/polyclonal (>2 clones) DLBCL samples. BC barcode, V variable gene segment, NDN diversity gene segment, J joining gene segment, C constant gene segment, HC heavy chain, LC light chain, Tr total reads, Cf fraction of clone
Fig. 4
Fig. 4
Genetic analysis of DLBCLs. a Scheme of experimental and analytic workflow. b Overlay of copy number profiles showing cancer-relevant amplifications/deletions in 16 DLBCLs from ITP2-M;Rosa26PB/+;Blmm3/m3 (IPB) mice. A zoomed-in view is provided for Chr11, which harbors frequent amplifications (identified in mouse GCB as well as ABC DLBCLs). The minimal amplified region contains—among other genes—the known DLBCL oncogenes Bcl11a and Rel. c Circos plot visualizing transposon insertion data from 42 IPB-DLBCLs. Rings from inward to outward: Insertion density plot for both orientations (shown in blue and green), number of insertions per common insertion site (CIS; dark yellow bars; axis from 0 to 140), number of contributing samples per CIS (red bars; axis from 0 to 40). Top 50 CIS genes are annotated. d Top 50 CIS genes ranked by number of contributing DLBCL samples. Molecular function (determined by literature search) of CIS genes is indicated. Transcription factors constituted the largest functional gene class (n = 15). Compared to the total number of mouse transcription factors (n = 1603), the enrichment for transcription factors among the top 50 CIS genes is highly significant (p = 1.4  10−5, Fisher’s exact test). Genes present in Cancer Gene Census (CGC) database and/or known for their role in DLBCL (literature search) are represented in dark blue, unknown DLBCL genes by light blue boxes. QiSeq quantitative transposon insertion site sequencing, aCGH array comparative genomic hybridization
Fig. 5
Fig. 5
CIS genes are significantly downregulated in human DLBCL. Volcano plot shows negatively (left) and positively (right) regulated genes in human DLBCL samples relative to non-malignant B cells (centroblasts) (GSE12453). Gray lines indicate log2 fold changes of −0.8 and 0.8. Dark blue colored points represent human orthologues of genes from the top 50 CIS list that are included in the Cancer Gene Census (CGC) database and/or have already implicated roles in DLBCL. Light blue colored points depict candidate genes with unknown function in DLBCL
Fig. 6
Fig. 6
Loss of heterozygosity analysis in tumors from IPB mice. a Loss of heterozygosity (LOH) analysis workflow. Fragment of Pten containing the single nucleotide polymorphism (SNP) rs30424206 was amplified and sequenced in tumors and tails from ITP2-M;Rosa26PB/+;Blmm3/m3 (IPB) mice (n = 10). b Variant frequencies determined by Pten SNP sequencing of tail and tumor tissue samples from six IPB mice. All tumors harbored high-coverage Pten insertions. c Pten IHC  of tumors from IPB mice (n = 10), as well as from DLBCLs generated in a Blm-proficient screen using ATP2-S1;Rosa26PB/+ mice (n = 7). Pten expression was scored semi-quantitatively. Representative microscopic images are shown. Pie charts display proportions of tumor samples with different Pten expression scores. Scale bar, 50 µm; Insets, ×200 magnification
Fig. 7
Fig. 7
A CRISPR/Cas9-based in vivo platform for BCL functional genomics. a Outline of the functional genomic approach for in vivo gene validation. b Kaplan–Meier plot showing survival of mice transplanted with hematopoietic stem/progenitor cells (HSPC) transduced with Trp53 sgRNA, Trp53 shRNA, and non-targeting (NT) sgRNA. p < 0.0001 for both Trp53-sgRNA vs. NT-sgRNA and Trp53-shRNA vs. NT-sgRNA. p < 0.03 for Trp53-sgRNA vs. Trp53-shRNA. p-values (log-rank test) were corrected for multiple testing using the Bonferroni method. c The transposon insertion pattern in Rfx7 predicts that gene-disruption is the cancer-causing mechanism. Each arrow represents an individual insertion. Insertions from all DLBCLs in the cohort are shown. ITP2 transposons can trap genes in either orientation. Insertions are distributed over the whole length of the gene (predicting a tumor suppressor). There is no bias for hot-spot areas of insertions as typically observed for unidirectional "activating" insertions in oncogenes. Consensus coding sequence (Rfx7-201) is displayed. d Kaplan–Meier plot for mice transplanted with HSPCs transduced with Rfx7 sgRNA and NT sgRNA. p < 0.0001, log-rank test. e Transposon insertion pattern in Phip, predicting tumor suppressive function of the gene. Consensus coding sequence (Phip-201) is shown. Each arrow represents an individual insertion. Insertions from all DLBCLs in the cohort are shown. f Heatmap displaying copy number variations on human chromosome 6 in samples from the TCGA-DLBC (n = 48) dataset (TCGA Research Network: http://cancergenome.nih.gov). The position of PHIP is indicated. g Function of Phip as a B-cell lymphoma tumor suppressor was validated using the CRISPR/Cas9-based in vivo functional genomic approach. Kaplan–Meier plot for mice transplanted with HSPCs transduced with Phip sgRNA and non-targeting (NT) sgRNA transplants. p < 0.0001, log-rank test. sgRNA single guide RNA, EFS elongation factor 1-alpha core promoter, eGFP enhanced green fluorescent protein, Mb megabase
Fig. 8
Fig. 8
Clinical relevance of CIS genes in human DLBCL. Association of CIS genes with overall and progression-free survival in a large clinically annotated DLBCL patient cohort (n = 424; GSE31312). For each of the 50 CIS genes, the cohort was stratified into "low" (LE; below median expression) or "high" expression (HE, above median). Kaplan–Meier plots for the top five genes, for which associations (between low gene expression and poor survival) were also observed in a second DLBCL patient cohort (n = 220; GSE10846), are shown. The significance threshold was set to a false discovery rate of 0.05. For genes, for which multiple probes were available, the one giving the signal with the highest variance was selected. Association with overall survival (OS) is shown on the top, and association with progression-free survival (PFS) on the bottom

References

    1. Shaffer AL, III, Young RM, Staudt LM. Pathogenesis of human B cell lymphomas. Annu. Rev. Immunol. 2012;30:565–610. doi: 10.1146/annurev-immunol-020711-075027. - DOI - PMC - PubMed
    1. Ferlay J, et al. Cancer incidence and mortality worldwide: sources, methods and major patterns in GLOBOCAN 2012. Int. J. Cancer. 2015;136:E359–86. doi: 10.1002/ijc.29210. - DOI - PubMed
    1. Sehn LH, Gascoyne RD. Diffuse large B-cell lymphoma: optimizing outcome in the context of clinical and biologic heterogeneity. Blood. 2015;125:22–32. doi: 10.1182/blood-2014-05-577189. - DOI - PubMed
    1. Reddy A, et al. Genetic and functional drivers of diffuse large B cell lymphoma. Cell. 2017;171:481–494. doi: 10.1016/j.cell.2017.09.027. - DOI - PMC - PubMed
    1. Pasqualucci L, et al. Analysis of the coding genome of diffuse large B-cell lymphoma. Nat. Genet. 2011;43:830–7. doi: 10.1038/ng.892. - DOI - PMC - PubMed

Publication types

Substances