. 2019 Mar 29;10(1):1459.
doi: 10.1038/s41467-019-08578-3.

Genomic and transcriptomic changes complement each other in the pathogenesis of sporadic Burkitt lymphoma

Collaborators, Affiliations

Genomic and transcriptomic changes complement each other in the pathogenesis of sporadic Burkitt lymphoma

Cristina López et al. Nat Commun. .

Abstract

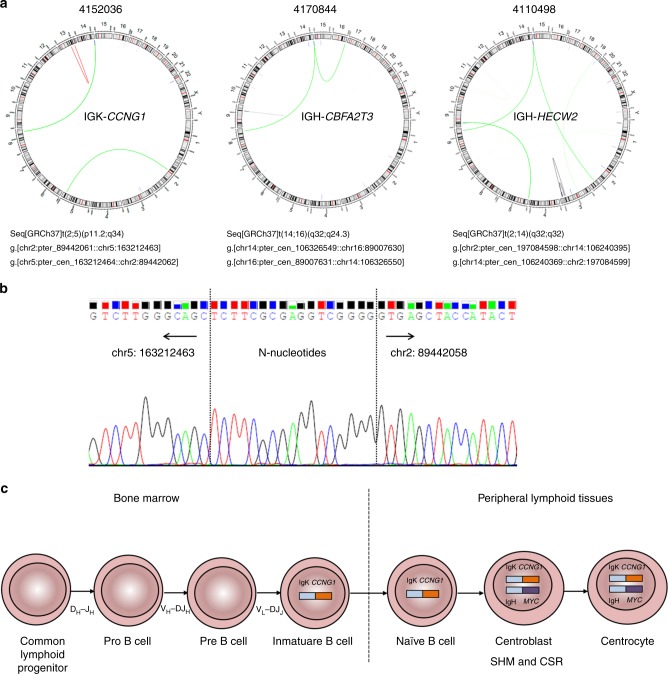
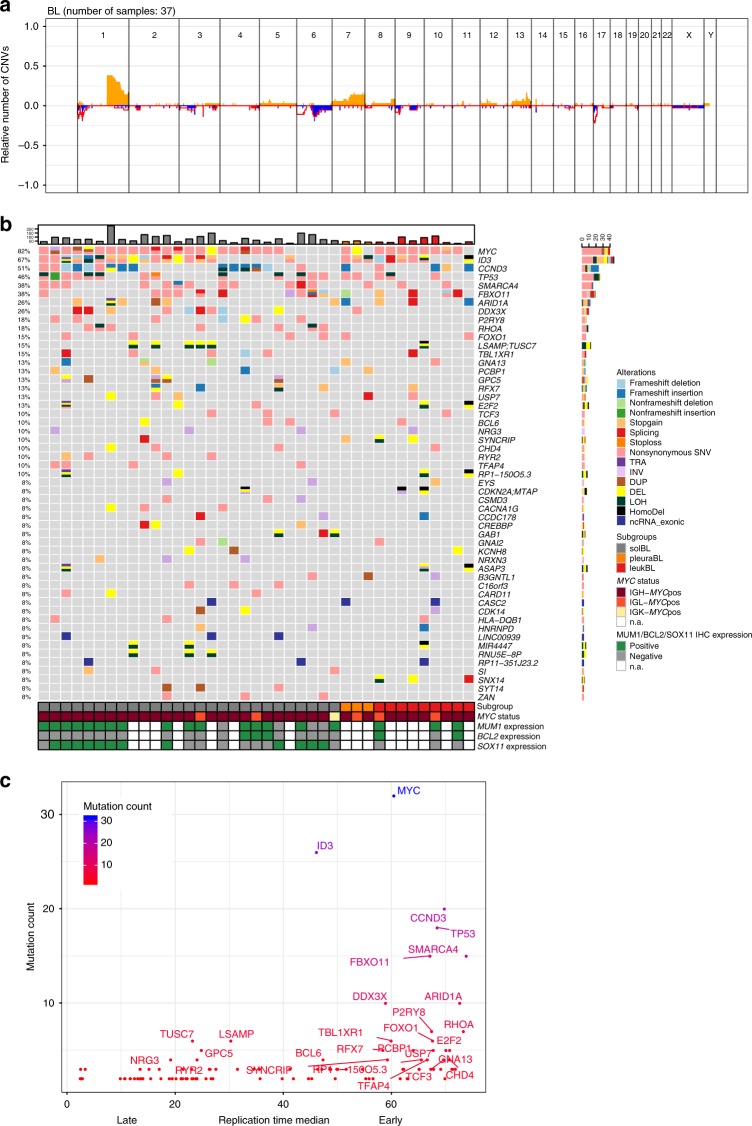
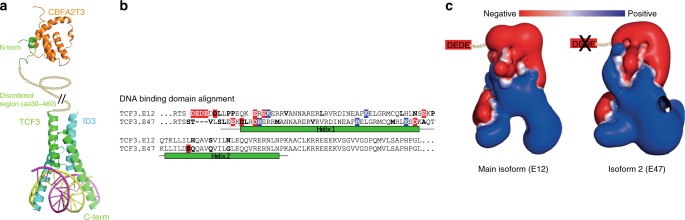
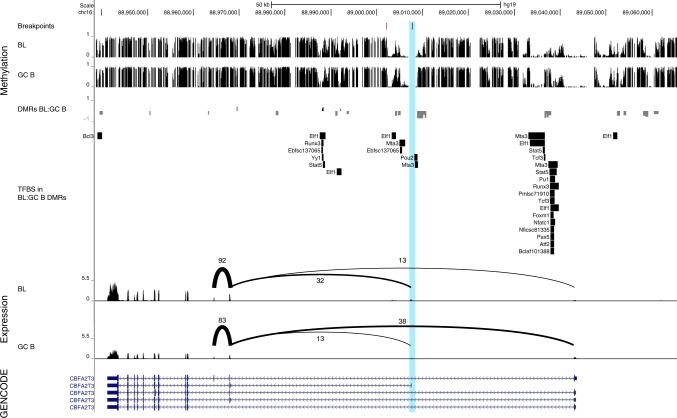
Burkitt lymphoma (BL) is the most common B-cell lymphoma in children. Within the International Cancer Genome Consortium (ICGC), we performed whole genome and transcriptome sequencing of 39 sporadic BL. Here, we unravel interaction of structural, mutational, and transcriptional changes, which contribute to MYC oncogene dysregulation together with the pathognomonic IG-MYC translocation. Moreover, by mapping IGH translocation breakpoints, we provide evidence that the precursor of at least a subset of BL is a B-cell poised to express IGHA. We describe the landscape of mutations, structural variants, and mutational processes, and identified a series of driver genes in the pathogenesis of BL, which can be targeted by various mechanisms, including IG-non MYC translocations, germline and somatic mutations, fusion transcripts, and alternative splicing.


Conflict of interest statement

The authors declare no competing interests.

Figures

Fig. 1
Fig. 1
Integrative analysis of the IG-MYC translocation. a Forest plot comparing breakpoint occurrences in the switch region of the IGH locus between BL cases (39 BL studied herein and additional one adult BL) and 179 non-BL GCB-lymphomas, showing a statistically significant enrichment of breakpoints in the switch IGHA regions in BL (Fisher test). b Distribution of somatic SNVs and breakpoints (Class I and II) in the MYC locus in cases with IGH-MYC translocations correlated with the expression pattern of the MYC transcript (upper panel: canonical transcript; lower panel: alternative transcript). Cases with breakpoints downstream of MYC and/or without available RNA-Seq data are not shown. The genomic coordinates (hg19) on chromosomal region 8q24 are given as x axis on the top. Blue arrows in MYC gene indicate the transcriptional orientation on the forward strand. The scale of the y axis indicates the mean expression of the respective MYC transcript across the cases using a maximum scale of 55 (normalized value of the expression). Note that due to the resolution not all neighboring mutations can be clearly distinguished. c Mean expression of MYC transcripts in normal germinal center B-cells from 5 donors (control) (black) and BL cases with the typical IGH-MYC translocation (n = 18) (dark gray) or its variants, IGK- or IGL-MYC (n = 5) (light gray). d A predominant expression of the translocated allele, irrespectively of canonical or alternative transcript, is determined by allele-specific expression analysis of MYC by comparing the fraction of translocated allele vs the total MYC allele expression in each group of the BL cohort. The box plots give the range of the fractions (per somatic SNV) of translocated allele vs total MYC expression per case
Fig. 2
Fig. 2
Mutational analysis on MYC gene and protein. a Distribution of RGYW/DGYW motifs in the genomic region adjacent to and inside the MYC gene (upper panel), and the dispersion of somatic SNVs, indels and SVs in MYC. Mutations which affect the RGYW/DGYW motifs, are indicated by blue and red dots; gray dots show mutations outside the motifs. b Distribution of MYC mutations (red lollipops) across the MYC protein sequence (Uniprot: P-01106-1), and the location of the post translational modification (PTM) sites (blue lollipops: phosphorylation sites; green lollipops: acetylation sites). Note that the isoform 2 of the MYC protein (Uniprot: P-01106-2) harbors 15 N-terminal amino acids which are not present in the canonical isoform 1
Fig. 3
Fig. 3
IG-non-MYC translocations. a Circo plots of three BL cases with IG-non-MYC translocations; green lines represent translocations, blue lines deletions, red lines duplications, and black lines inversions. The description of the chromosomal translocations affecting IG locus follow the guidelines of ISCN and HGVS nomenclatures using the genomic breakpoints detected by WGS. b Electropherogram depicting the junctional sequence of the IGK-CCNG1 translocation validated using PCR on genomic DNA and Sanger sequencing. The arrows indicate the genomic regions of each chromosomal partner and the discontinued line the exact breakpoint of the translocation. Between both sequences the presence of N-nucleotides was observed. c Schematic display of the potential timing of the IGK-CCNG1 and IGH-MYC translocations during BL development in case 4152036. The IGK-CCNG1 juxtaposition most likely occurred by a mistake during IGK V-J recombination in a B-cell precursor in the bone marrow compartment. The IGH-MYC translocation occurred as a later event during tumor evolution due to a mistake of CSR in a GCB cell
Fig. 4
Fig. 4
Gene dysregulation in BL. a Cumulative imbalance profile of 37/39 BL cases excluding the physiological rearrangement in IGH, IGK, and IGL loci. The Fig. does not include the cases with polyploid genome (4108627) and without copy number aberrations (4110996). Losses are indicated in blue, gains in orange, and copy neutral losses of heterozygosity (LOH) as red line. b Genes recurrently affected by SNVs, SVs, CNAs, and indels in BL (frequency ≥3 cases). The events in recurrently affected genes are shown independent of the transcript form. The affected genes are ordered by frequency, as well as gene name and the cases are displayed according to the BL subgroups (solBL in gray, leukBL in red, and pleuraBL in orange). The cases are also annotated with MUM1, BCL2, and SOX11 expression status analyzed by immunohistochemistry, as well as MYC translocation status. c Plot contrasting mutational load and replication time of recurrently altered genes in BL. The x axis displays the median replication time in five lymphoblastoid B-cell lines (ENCODE cell lines GM12801, GM06990, GM12812, GM12813, and GM12878) and the y axis the mutation count per gene
Fig. 5
Fig. 5
Mutual exclusivity analysis. Heat-map showing the mutual exclusivity of recurrently altered genes in BL. The colors indicate the p-value of the mutual exclusivity analysis. A low p-value indicates that both genes of the respective gene pair are mutated together less frequently than expected
Fig. 6
Fig. 6
TCF3 splicing. a Sashimi plot showing the expression of the 3´ end of TCF3. On the top, the ENST00000592395.5 ensemble isoform displaying both alternative exons is shown. Below, the RefSeq annotations for the isoforms E47 and E12 are shown. Each isoform includes only one of the alternative exons. The three Sashimi plots show the expression and spliced reads of GCB cells (top), BL with ID3 mutations (center), and BL without ID3 mutations (bottom). The numbers indicate the amount of spliced reads between the connected exons. The red arc marks the isoform that includes both alternative exons. Note the slight difference in expression levels between the three plots. The cassette exon of the E12 isoform shows a decrease in inclusion (and expression) from GCB cells (48%) to BL with ID3 mutation (29%) to BL without ID3 mutations (26%). b Ratio of spliced reads that directly go to the E47 exon vs spliced reads that go to the E12 exon starting from the right one of the two central exons shown in Fig. 5a. While half of the spliced reads go to E47 in control (green), most of the ID3 unmutated BL cases have more than two thirds of the spliced reads going to E47 (right box) (p = 0.070) (t test, two sided). In ID3 mutated BL cases (n = 11) (central box), this number lies between the control and the ID3 unmutated cases (n = 9) (p = 0.09) (Wilcoxon rank sum test)
Fig. 7
Fig. 7
The ID3-TCF3-CFBA2T3 complex. a Protein structure of TCF3 (green) in complex with ID3 (blue) and bound to DNA (bottom). The N-terminal region that interacts with CBFA2T3 (orange) is separated by a long disordered/unstructured region (shown as a looped line). b Alignment of the DNA-binding region (residues 527–644) of TCF3 (Uniprot: P15923). The location of the domain is inferred by sequence similarity to the structure from protein databank code 2ypa chain A (a heterodimeric complex involving an equivalent domain from human TAL1 in complex with DNA). Differences between the sequences are highlighted (uncolored and bold for uncharged amino acids; red for negatively charged and blue for positively charged amino acids). Note that many changes alter the charge in one isoform relative to the other, leading to a net gain of four negative charges in isoform E12 relative to isoform E47. c Representations of the electrostatic surface of the E12 (left) and E47 (right) isoforms. The surface of E47 has a more positive electrostatic potential (blue). Also indicated is the loss of four negative (Glu/Asp) residues at the N-terminal portion of the domain, which were not present in the model (as there was no suitable structural template for them). The loss of these four negative charges also means that the E47 isoform is relatively more positively charged
Fig. 8
Fig. 8
Integrative analysis of breakpoint location, DNA methylation, and expression of CBFA2T3. Composite plot showing breakpoint locations (top), DNA methylation (second from top), transcription factor binding sites (TFBS, middle) and observed splicing patterns (second from bottom) of BL and GCB cells at the CBFA2T3 locus. CBFA2T3 is significantly differentially spliced between BL and GCB, with BL predominantly expressing the shorter isoform 2. The TSS of isoform 1 preferred by GCB overlaps with a herein described breakpoint (black mark in blue highlight) and is proximal to a specific breakpoint (red mark) which was previously identified in pediatric mature B-cell leukemia (diagnosed morphologically as B-AL)). In addition, several DMRs between BL and GCB are located in the CBFA2T3 locus. A promoter associated negative cDMR (negative correlation between DMR methylation and gene expression) overlaps, inter alia, with a TCF3 transcription factor binding site, suggesting a regulatory role of TCF3 in CBFA2T3 isoform expression
Fig. 9
Fig. 9
Germline events and mutational signatures. a Germline mutations in genes recurrently altered by somatic mutations in BL. The affected genes are ordered by the incidences as well as names and the BL cases are displayed according to their subgroups (solBL in gray, leukBL in red, and pleuraBL in orange). Moreover, the BL cases are annotated with the MUM1, BCL2, and SOX11 expression status determined by immunohistochemistry, as well as MYC translocation status. b Rainfall plot of a representative BL case (4189998). The nucleotide changes are labeled using different colors. The x axis encodes the genomic coordinate and the y axis the log-scaled intermutation distance. Clusters of hypermutation (Kataegis) can be identified as “rainfalls” reaching very low intermutation distance. As in this representative case, in the other BL cases, the IG and MYC loci exhibited a high density of SNVs. c Absolute exposures of mutational signatures in the BL samples extracted from combined supervised and unsupervised analyses of mutational signatures. The mutational signatures are labeled with different colors and the BL cases are displayed according to their subgroups (solBL in gray, leukBL in red, and pleuraBL in orange). The cases are also annotated for the age group. Heights of the stacked bar plots correspond to the number of SNVs associated to the respective mutational signatures

References

    1. Swerdlow, S. et al. in WHO Classification of Tumours of Haematopoietic and Lymphoid Tissues (ed Swerdlow, S. et al.) (International Agency for Research on Cancer, Lyon, France, 2017).
    1. Burkhardt B, et al. Non-Hodgkin's lymphoma in adolescents: experiences in 378 adolescent NHL patients treated according to pediatric NHL-BFM protocols. Leukemia. 2011;25:153–160. - PubMed
    1. Miles RR, Arnold S, Cairo MS. Risk factors and treatment of childhood and adolescent Burkitt lymphoma/leukaemia. Br. J. Haematol. 2012;156:730–743. - PubMed
    1. Burkitt DP. Classics in oncology. A sarcoma involving the jaws in African children. CA Cancer J. Clin. 1972;22:345–355. - PubMed
    1. Gabarre J, et al. Human immunodeficiency virus-related lymphoma: relation between clinical features and histologic subtypes. Am. J. Med. 2001;111:704–711. - PubMed

Publication types

MeSH terms

Substances