. 2019 Mar 29;10(1):1406.
doi: 10.1038/s41467-019-09455-9.

A gut microbiome signature for cirrhosis due to nonalcoholic fatty liver disease

Affiliations

A gut microbiome signature for cirrhosis due to nonalcoholic fatty liver disease

Cyrielle Caussy et al. Nat Commun. .

Abstract

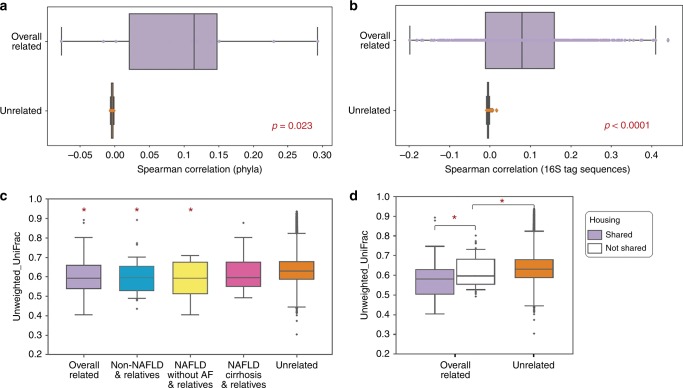
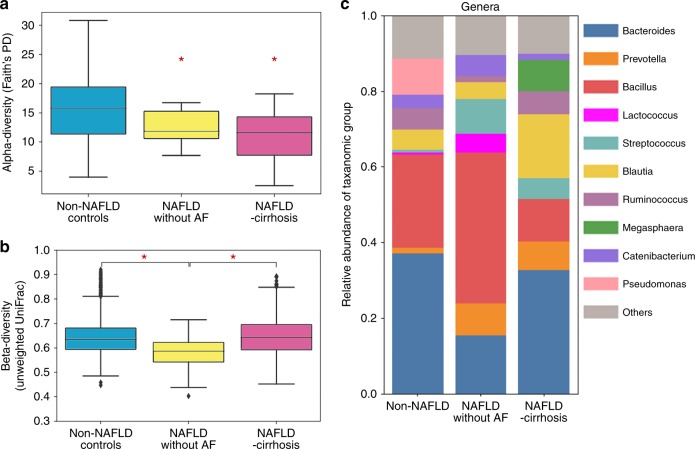
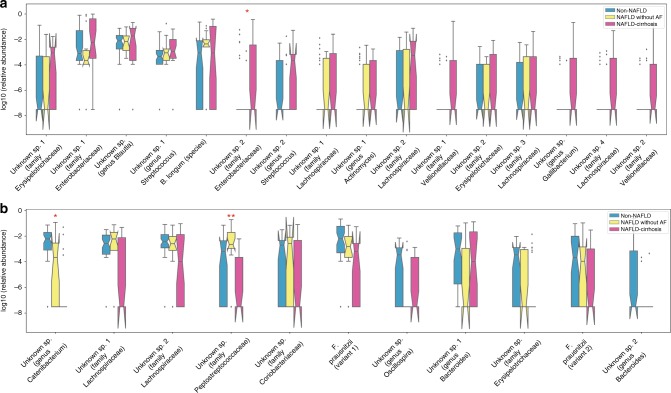
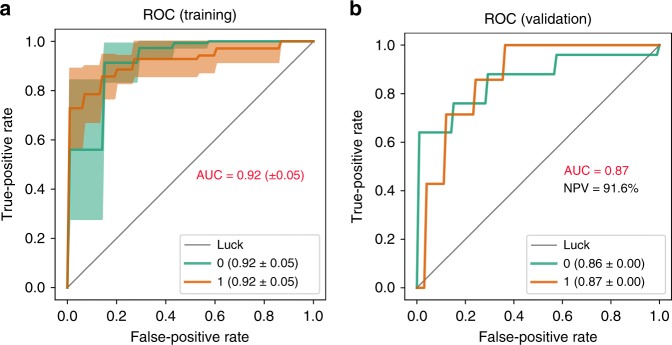
The presence of cirrhosis in nonalcoholic-fatty-liver-disease (NAFLD) is the most important predictor of liver-related mortality. Limited data exist concerning the diagnostic accuracy of gut-microbiome-derived signatures for detecting NAFLD-cirrhosis. Here we report 16S gut-microbiome compositions of 203 uniquely well-characterized participants from a prospective twin and family cohort, including 98 probands encompassing the entire spectrum of NAFLD and 105 of their first-degree relatives, assessed by advanced magnetic-resonance-imaging. We show strong familial correlation of gut-microbiome profiles, driven by shared housing. We report a panel of 30 features, including 27 bacterial features with discriminatory ability to detect NAFLD-cirrhosis using a Random Forest classifier model. In a derivation cohort of probands, the model has a robust diagnostic accuracy (AUROC of 0.92) for detecting NAFLD-cirrhosis, confirmed in a validation cohort of relatives of proband with NAFLD-cirrhosis (AUROC of 0.87). This study provides evidence for a fecal-microbiome-derived signature to detect NAFLD-cirrhosis.


Conflict of interest statement

The authors declare no competing interests.

Figures

Fig. 1
Fig. 1
Familial association and shared microbiome among relatives is driven by shared housing. Distribution of spearman correlation coefficients between relatives in purple (n = 86) and unrelated pairs in orange (n = 18232) in the familial cohort, plotted for each phyla (a) and 16S tag sequences (b). The box plots show the quartiles and whiskers show the rest of the distribution (1.5 inter-quartile range) and the center line corresponds to the median. This analysis was done after filtering rare 16S sequences to avoid spurious correlations due to sparsity (total abundance <10E-6 across all samples in each disease group). The correlation among related individuals was significantly higher at both phylum (p = 0.023) and 16S tag sequences (p = 2.4E-41) levels. Similar plot showing the distribution of unweighted UniFrac distances between related in purple and unrelated pairs stratified by disease status (c). The beta-diversity was significantly lower among related individuals (p = 3.22E-05), non-NAFLD controls and relative in blue (n = 38 pairs) (p = 0.0011) and probands with NAFLD without AF and relatives in yellow (n = 15) (p = 0.0156) when compared to the same among unrelated pairs in orange, while the difference between NALFD-cirrhosis patients and relatives in pink (n = 33) and unrelated pairs in orange was not statistically significant (p > 0.1). When stratified by shared housing (d), beta-diversity was significantly lower among related individuals sharing a house in purple (n = 35 pairs) (p = 0.0455). Additionally, related individuals not sharing a house in white (n = 51 pairs) had significantly lower beta-diversity compared to unrelated pairs in orange (p = 0.028). All p value were determined by two-sided Kruskal-Wallis test. *p value < 0.05. Source data are provided as a Source Data file
Fig. 2
Fig. 2
Gut microbiome alteration in NAFLD-cirrhosis. Comparison between non-NAFLD controls in blue (n = 51), NAFLD without advanced fibrosis in yellow (n = 17), and NAFLD-cirrhosis probands in pink (n = 25) with respect to a alpha-diversity using Faith’s Phylogenetic Diversity. Non-NAFLD controls have significantly higher alpha-diversity compared to probands with NAFLD without AF in yellow (p = 0.0163) and NAFLD-cirrhosis in pink (p = 0.0020). b Similar plot for beta-diversity using unweighted UniFrac distance metric. The beta-diversity among probands with NAFLD without AF in yellow was significantly lower than that among non-NAFLD controls in blue (p = 1.14E-18) and probands with NAFLD-cirrhosis in pink (p = 3.32E-15). The box plots show the quartiles and whiskers show the rest of the distribution (1.5 inter-quartile range) the center liner corresponds to the median. c Gut microbiome composition of non-NAFLD controls, NAFLD without AF and NALFD-cirrhosis probands shows differences at bacterial genus level. All p value were determined by two-sided Kruskal-Wallis test. *p value < 0.05. Source data are provided as a Source Data file
Fig. 3
Fig. 3
Relative abundance of predictive microbial features for the prediction of NAFLD-cirrhosis. The bacterial features most predictive of NAFLD-cirrhosis (n = 25) versus non-NAFLD controls (n = 51) sorted by decreasing importance score in Random Forest classification model. Features increased (a) and decreased (b) in NAFLD-cirrhosis probands are shown. Relative abundance is plotted for each subject group in the cohort (NAFLD-cirrhosis in pink (n = 25), NAFLD without advanced fibrosis in yellow (n = 17) and non-NAFLD controls in blue (n = 51)). The feature table is normalized to a total abundance of 1 per sample and relative abundances are plotted on a log10 scale. Each bacterial feature is a unique 16S tag sequence labeled to the highest possible taxonomic rank assigned using QIIME. The box plots show the quartiles and whiskers show the rest of the distribution (1.5 inter-quartile range). The notches show 95% confidence interval. Features that are differentially abundant in addition to being important predictors are marked by asterisk. Single asterisk (*) represents significant difference between non-NAFLD controls and NAFLD-cirrhosis probands p value < 0.05; Double asterisk (**) represents the same between NAFLD without advanced fibrosis and NAFLD cirrhosis probands p value < 0.05. Differential abundance was tested using permutation-based, ranked mean test, comparing mean difference between the two groups. FDR (<0.1) was controlled using DS-FDR method. Source data are provided as a Source Data file
Fig. 4
Fig. 4
High diagnostic accuracy of a gut-microbiome signature for the detection of NAFLD-cirrhosis. Receiver operating characteristic (ROC) curves evaluating ability to predict advanced Fibrosis using Random Forest classification. Each curve represents the sensitivity and specificity to distinguish subjects with NAFLD-cirrhosis (1, brown line) from non-NALFD controls (0, green line). a Mean ROC curve from cross-validation within training data comprised of NAFLD-cirrhosis probands (n = 24) and non-NAFLD controls (n = 47). Cross-validation was performed by iteratively (10 times) training the Random Forest model with 70:30 train/test split on this training data. b ROC curve representing diagnostic accuracy of Random Forest classification model tested on first-degree relatives of NAFLD-cirrhosis probands (n = 32). The negative predictive value (NPV) of the model was 91.6% and the positive predictive value was 62.5%. Source data are provided as a Source Data file

References

    1. Estes C, Razavi H, Loomba R, Younossi Z, Sanyal AJ. Modeling the epidemic of nonalcoholic fatty liver disease demonstrates an exponential increase in burden of disease. Hepatology. 2018;67:123–133. doi: 10.1002/hep.29466. - DOI - PMC - PubMed
    1. Loomba R, Sanyal AJ. The global NAFLD epidemic. Nat. Rev. Gastroenterol. Hepatol. 2013;10:686–690. doi: 10.1038/nrgastro.2013.171. - DOI - PubMed
    1. Younossi Z, et al. Global burden of NAFLD and NASH: trends, predictions, risk factors and prevention. Nat. Rev. Gastroenterol. Hepatol. 2018;15:11–20. doi: 10.1038/nrgastro.2017.109. - DOI - PubMed
    1. Dulai PS, et al. Increased risk of mortality by fibrosis stage in nonalcoholic fatty liver disease: Systematic review and meta-analysis. Hepatology. 2017;65:1557–1565. doi: 10.1002/hep.29085. - DOI - PMC - PubMed
    1. Friedman SL, Neuschwander-Tetri BA, Rinella M, Sanyal AJ. Mechanisms of NAFLD development and therapeutic strategies. Nat. Med. 2018;24:908–922. doi: 10.1038/s41591-018-0104-9. - DOI - PMC - PubMed

Publication types