. 2019 Mar 29;10(1):1442.
doi: 10.1038/s41467-019-09491-5.

Excessive mechanical loading promotes osteoarthritis through the gremlin-1-NF-κB pathway

Affiliations

Excessive mechanical loading promotes osteoarthritis through the gremlin-1-NF-κB pathway

Song Ho Chang et al. Nat Commun. .

Abstract

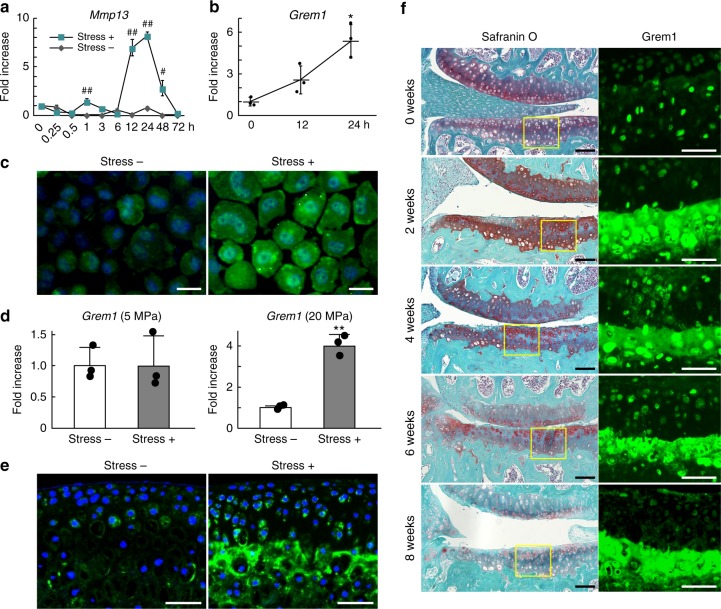
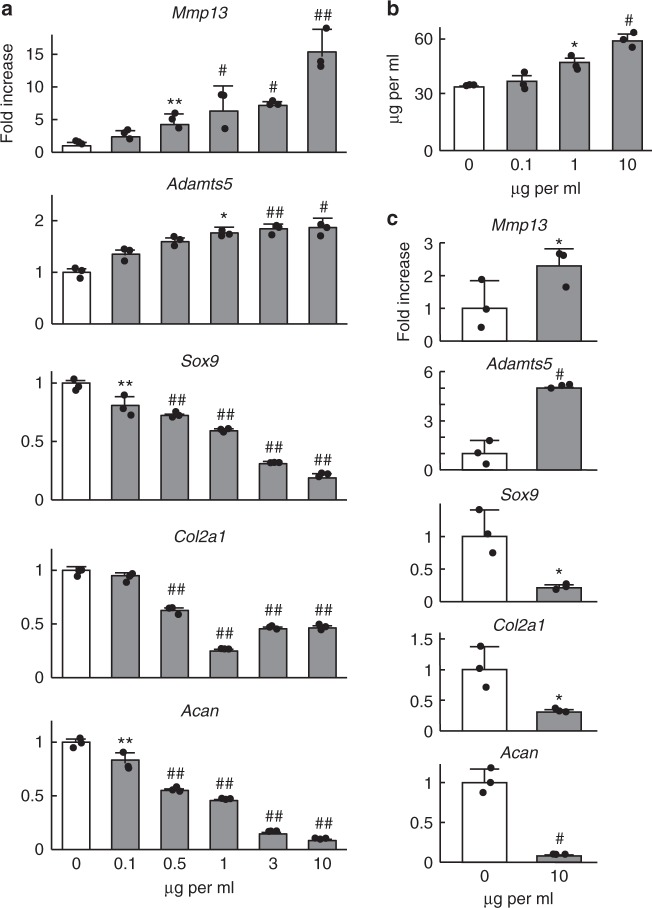
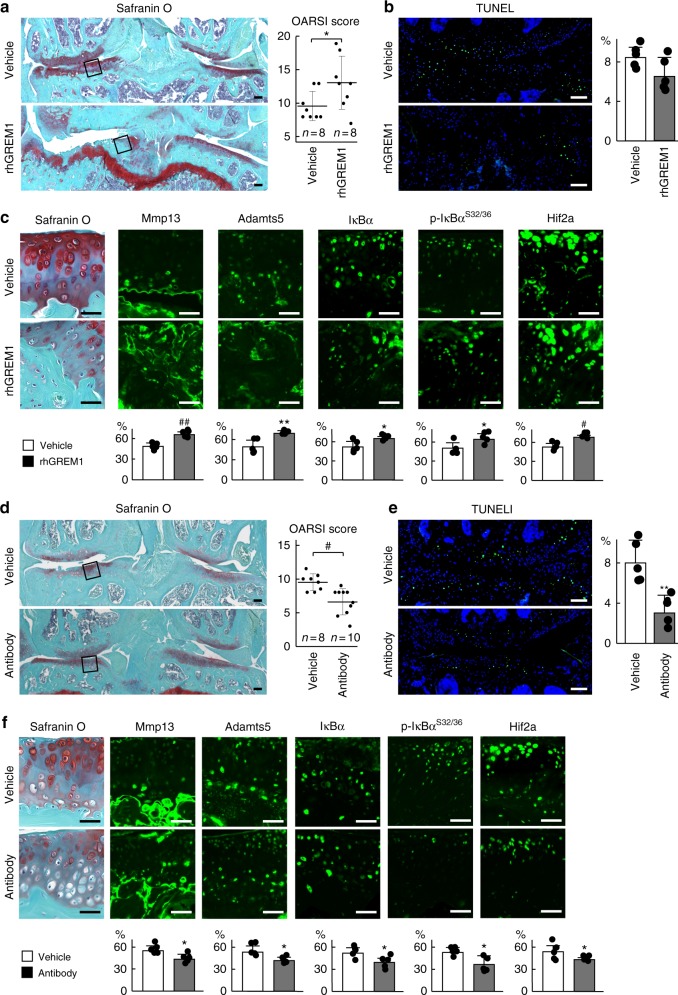
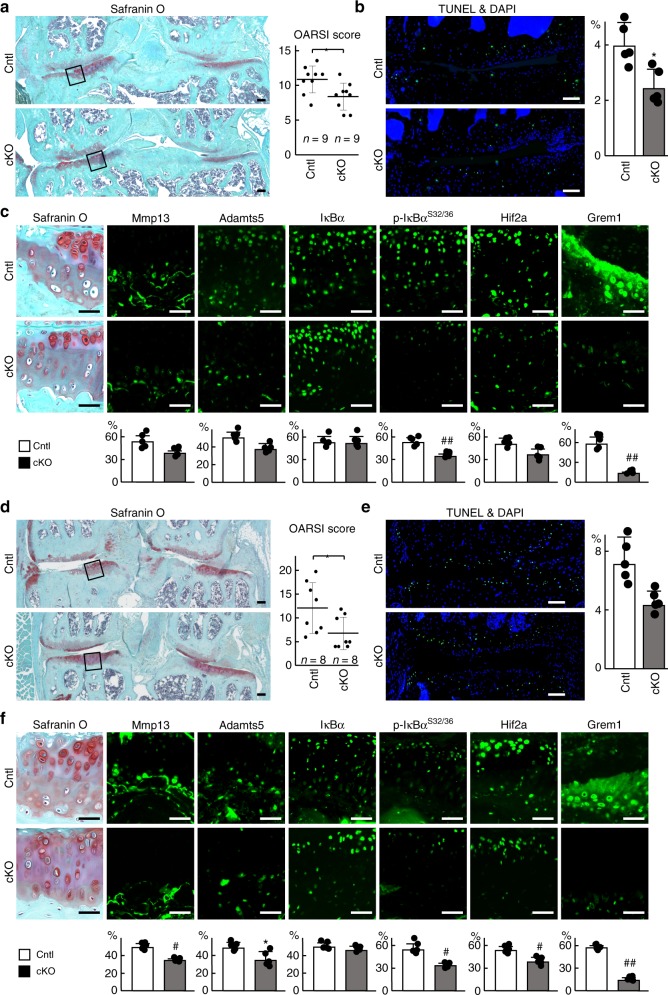
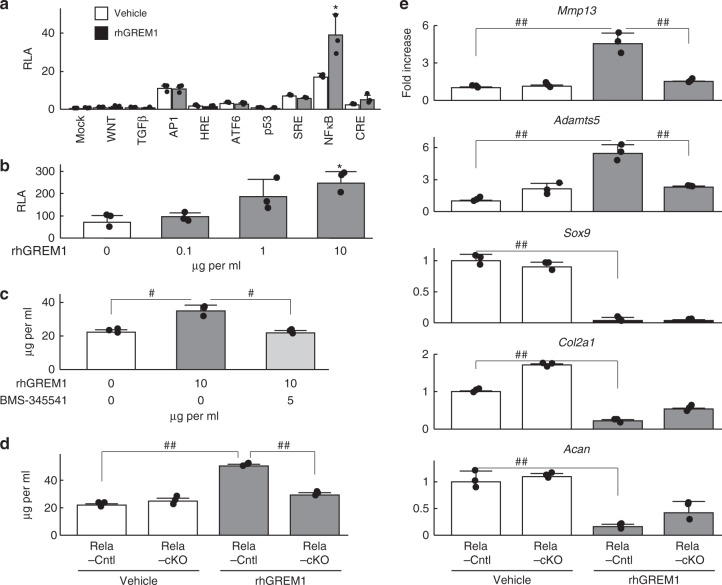
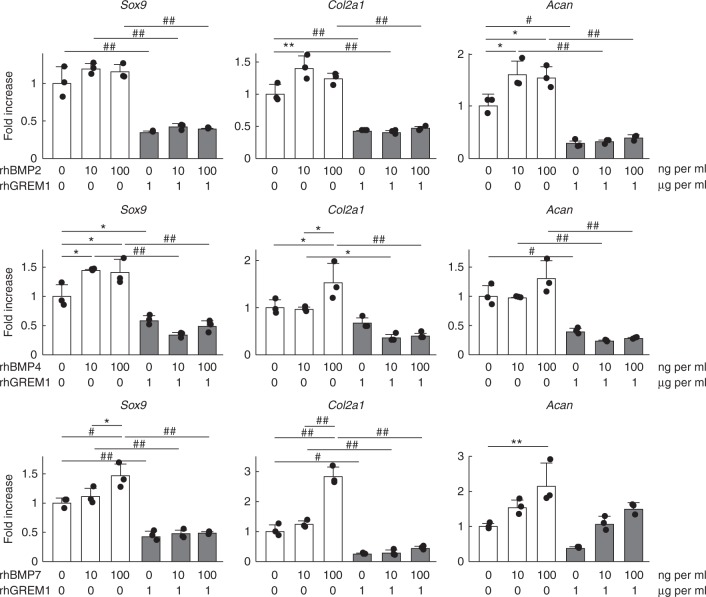
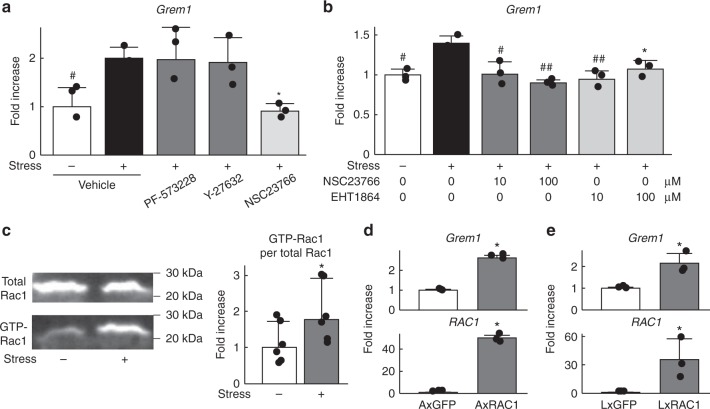
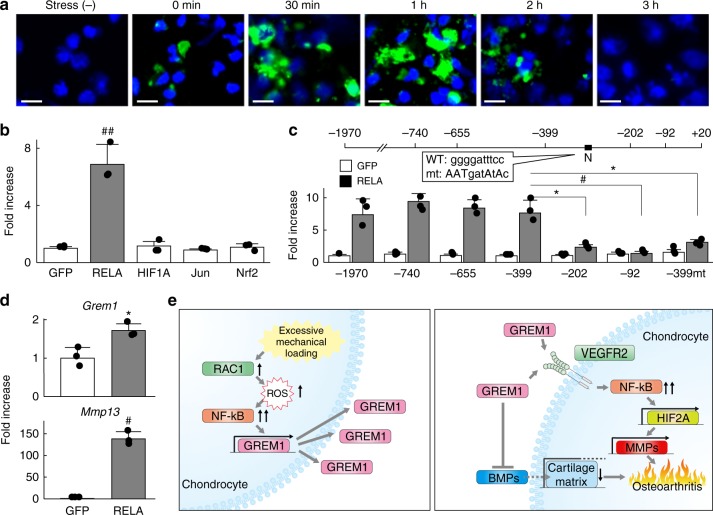
Exposure of articular cartilage to excessive mechanical loading is deeply involved in the pathogenesis of osteoarthritis. Here, we identify gremlin-1 as a mechanical loading-inducible factor in chondrocytes, detected at high levels in middle and deep layers of cartilage after cyclic strain or hydrostatic pressure loading. Gremlin-1 activates nuclear factor-κB signalling, leading to subsequent induction of catabolic enzymes. In mice intra-articular administration of gremlin-1 antibody or chondrocyte-specific deletion of Gremlin-1 decelerates osteoarthritis development, while intra-articular administration of recombinant gremlin-1 exacerbates this process. Furthermore, ras-related C3 botulinum toxin substrate 1 activation induced by mechanical loading enhances reactive oxygen species (ROS) production. Amongst ROS-activating transcription factors, RelA/p65 induces Gremlin-1 transcription, which antagonizes induction of anabolic genes such as Sox9, Col2a1, and Acan by bone morphogenetic proteins. Thus, gremlin-1 plays essential roles in cartilage degeneration by excessive mechanical loading.


Conflict of interest statement

The authors declare no competing interests.

Figures

Fig. 1
Fig. 1
Induction of gremlin-1 by excessive mechanical loading. a Time-course of Mmp13 mRNA levels in mouse primary chondrocytes after tensile stress loading (stress+), or without loading (stress −). Cells were cultured up to 72 h after uniaxial cyclic tensile strain (10%, 0.5 Hz, 30 min). #P< 0.005, ##P< 0.001 versus stress—at each time-point (two-way ANOVA test). b Gremlin-1 mRNA levels in mouse primary chondrocytes after tensile stress loading. *P < 0.05 versus 0 h (one-way ANOVA test). c Gremlin-1 protein expression in mouse primary chondrocytes 24 h after tensile stress loading (stress+), or without loading (stress −). Nuclei were stained with DAPI (blue). Scale bars, 50 µm. d Gremlin-1 mRNA levels in mouse femoral head cartilage after hydrostatic pressure loading (5 or 20 MPa, 0.1 Hz, 30 min). #P< 0.005 versus stress− (Student’s unpaired two-tailed t-test). e Gremlin-1 immunofluorescence in mouse femoral head cartilage after 20 MPa hydrostatic pressure loading. Nuclei were stained with DAPI (blue). Scale bars, 100 µm. f Safranin O staining and gremlin-1 immunofluorescence during the time-course of mouse osteoarthritis development after surgical induction. Inset boxes in safranin O staining indicate regions of immunofluorescence. Scale bars, 100 µm and 50 µm, respectively. All data are expressed as mean ± SD of biologically independent three samples per group
Fig. 2
Fig. 2
Catabolic effects of gremlin-1 in cultured chondrocytes. a mRNA levels of marker genes in primary mouse articular chondrocytes treated with recombinant human gremlin-1 (rhGREM1) for 24 h. b Amount of glycosaminoglycans (GAG) released into the culture medium determined by dimethylmethylene blue assay of wild-type mouse femoral heads cultured with various amounts of rhGREM1 for 3 days. c mRNA levels of marker genes in mouse femoral heads cultured with 10 µg/mL rhGREM1 for 3 days. All data are expressed as mean ± SD of biologically independent three samples per group. *P < 0.05, **P < 0.01, #P < 0.005, ##P < 0.001 versus 0 (vehicle) (one-way ANOVA test)
Fig. 3
Fig. 3
Effects of recombinant human gremlin-1 (rhGREM1) and gremlin-1 antibody in vivo. a Safranin O staining and OARSI scores of mouse knee joints after intra-articular administration (twice a week for 8 weeks) of 10 µL of 10 µg/mL rhGREM1 or vehicle. Both experimental groups consist of n = 8 biologically independent animals. Inset boxes indicate regions of immunofluorescence in (c). Scale bars, 100 µm. b TUNEL staining and rate of TUNEL-positive cells in mouse knee joints after intra-articular administration of rhGREM1 or vehicle. Nuclei were stained with DAPI (blue). Scale bars, 100 µm. n = 5 biologically independent experiments. c Safranin O staining and immunofluorescence of Mmp13, Adamts5, IκBα, phosphorylated IκBα (dual Ser32/36), and HIF-2α proteins in mouse knee joints after intra-articular administration of rhGREM1 or vehicle. Scale bars, 50 µm. The percentage of positive cells in the immunofluorescence is shown below. n = 5 biologically independent experiments. d Safranin O staining and OARSI scores of mouse knee joints after with intra-articular administration (twice a week for 8 weeks) of 10 µL of 10 µg/mL gremlin-1 antibody or vehicle. Both experimental groups consist of biologically independent animals: vehicle n = 8, antibody n = 10. Inset boxes indicate regions of immunofluorescence in (f). Scale bars, 100 µm. e TUNEL staining and rate of TUNEL-positive cells in mouse knee joints after intra-articular administration of gremlin-1 antibody or vehicle. Nuclei were stained with DAPI (blue). Scale bars, 100 µm. n = 5 biologically independent experiments. f Safranin O staining and immunofluorescence of Mmp13, Adamts5, IκBα, phosphorylated IκBα (dual Ser32/36), and HIF-2α proteins in mouse knee joints after intra-articular administration of gremlin-1 antibody or vehicle. Scale bars, 50 µm. The percentage of positive cells in the immunofluorescence is shown below. n = 5 biologically independent experiments. All data are expressed as mean ± SD. *P < 0.05, **P < 0.01, #P < 0.005, ##P < 0.001 versus vehicle (Student’s unpaired two-tailed t-test)
Fig. 4
Fig. 4
Regulation of osteoarthritis development by gremlin-1. a Safranin O staining and OARSI scores of mouse knee joints of Grem1fl/fl (Cntl) and Col2a1-CreERT2;Grem1fl/fl (cKO) mice 8 weeks after surgery. Tamoxifen induction was performed at 7 weeks. Both experimental groups consist of n = 9 biologically independent animals. Inset boxes indicate regions of immunofluorescence in (c). Scale bars, 100 µm. b TUNEL staining and rate of TUNEL-positive cells in mouse knee joints of Cntl and cKO mice 8 weeks after surgery. Nuclei were stained with DAPI (blue). Scale bars, 100 µm. n = 5 biologically independent experiments. c Safranin O staining and immunofluorescence of Mmp13, Adamts5, IκBα, phosphorylated IκBα (dual Ser32/36), HIF-2α, and gremlin-1 proteins in mouse knee joints of Cntl and cKO mice 8 weeks after surgery. Scale bars, 50 µm. The percentage of positive cells in the immunofluorescence is shown below. n = 5 biologically independent experiments. d Safranin O staining and OARSI scores of mouse knee joints of Cntl and cKO mice at 18 months of age. Tamoxifen induction was performed for 5 days at 8 weeks, 6 months, and 12 months. Both experimental groups consist of n = 8 biologically independent animals. Inset boxes indicate regions of immunofluorescence in (f). Scale bars, 100 µm. e TUNEL staining and rate of TUNEL-positive cells in mouse knee joints of Cntl and cKO mice at 18 months of age. Nuclei were stained with DAPI (blue). Scale bars, 100 µm. n = 5 biologically independent experiments. (f) Safranin O staining and immunofluorescence of Mmp13, Adamts5, IκBα, phosphorylated IκBα (dual Ser32/36), HIF-2α, and gremlin-1 proteins in mouse knee joints of Cntl and cKO mice at 18 months of age. Scale bars, 50 µm. The percentage of positive cells in the immunofluorescence is shown below. n = 5 biologically independent experiments. All data are expressed as mean ± SD. *P < 0.05, **P < 0.01, #P < 0.005, ##P < 0.001 versus Cntl (Student’s unpaired two-tailed t-test)
Fig. 5
Fig. 5
NF-κB signalling mediates the catabolic effects of gremlin-1. a Luciferase assay for screening of downstream signalling pathways of gremlin-1 using reporter vectors containing a response element for each pathway or transcription factor. *P < 0.05 versus each vehicle control (one-way ANOVA test). b Activities of luciferase reporter vectors containing an NF-κB motif with rhGREM1 treatment. *P < 0.05 versus 0 (vehicle) (one-way ANOVA test). c Amount of proteoglycan released into culture medium from wild-type mouse femoral heads cultured with or without rhGREM1 (10 µg/mL) and IKK inhibitor BMS-345541 (5 µM) for 3 days. #P < 0.005 (one-way ANOVA test). d Amount of proteoglycan released into culture medium from RelAfl/fl (Rela-Cntl) and Col2a1-Cre;RelAfl/fl (Rela-cKO) mice femoral heads cultured with or without 10 µg/mL rhGREM1. ##P < 0.001 (one-way ANOVA test). e mRNA levels of marker genes in RelA-Cntl and RelA-cKO femoral heads cultured with or without rhGREM1. ##P < 0.001 (one-way ANOVA test). All data are expressed as mean ± SD of biologically independent three samples per group
Fig. 6
Fig. 6
Gremlin-1 antagonizes the anabolic effects of BMPs. mRNA levels of Sox9, Col2a1 and Acan in mouse primary chondrocytes treated with rhBMP2, 4, or 7, and rhGREM1 for 24 h. *P < 0.05, **P < 0.01, #P < 0.005, # #P < 0.001 versus vehicle (one-way ANOVA test). All data are expressed as means ± SD of biologically independent three samples per group
Fig. 7
Fig. 7
Gremlin-1 induction by mechanical stress loading occurs through Rac1 activation. a Gremlin-1 mRNA levels in mouse primary chondrocytes treated with 10 µM inhibitors of FAK (PF-573228), ROCK (Y-27632), or RAC1 (NSC23766) 24 h after cyclic tensile strain loading. n = 3 biologically independent samples. *P < 0.05, #P < 0.005 versus stress+, vehicle (one-way ANOVA test). b Gremlin-1 mRNA levels in mouse primary chondrocytes treated with Rac1 inhibitors NSC23766 or EHT1864 at 24 h after cyclic tensile strain loading. n = 3 biologically independent samples. *P < 0.05, #P < 0.005, ##P < 0.001 versus stress + , vehicle (one-way ANOVA test). c Rac1 pull-down activation assay using mouse primary chondrocytes with or without cyclic tensile strain loading. Quantification of densitometry data are shown below, and ratios of positive Rac1 per total Rac1 are shown as fold-increase in the right graph. n = 5 biologically independent samples. *P < 0.05 versus stress– (Student’s unpaired two-tailed t-test). d Gremlin-1 mRNA levels in mouse primary chondrocytes transduced with an adenoviral vector containing Rac1 or GFP. n = 3 biologically independent samples. *P < 0.05 versus GFP (Student’s unpaired two-tailed t-test). e Gremlin-1 mRNA levels in ATDC5 cells lentivirally overexpressing Rac1 or GFP. n = 3 biologically independent samples. *P < 0.05 versus GFP (Student’s unpaired two-tailed t-test). All data are expressed as means ± SD
Fig. 8
Fig. 8
The ROS- NF-κB pathway enhances transcriptional induction of gremlin-1. a Fluorescence imaging time-course of ROS production in mouse primary chondrocytes after cyclic tensile strain loading. Nuclei were stained with DAPI (blue). Scale bars, 20 µm. b Luciferase assay using ATDC5 cells co-transfected with human GREM1 promoter (from −1970 to +20 bp relative to the transcriptional start site) and each expression vector. ##P < 0.001 versus GFP (one-way ANOVA test). c 5ʹ-deletion and mutation analyses of the luciferase assay. N: NF-κB motif, −399mt: reporter construct from −399 to +20 bp in which NF-κB motif is mutated. *P < 0.05, #P < 0.005 (Student’s unpaired two-tailed t-test). d mRNA levels of Gremlin-1 and Mmp13 in mouse primary chondrocytes transfected with RelA or GFP. *P < 0.05, #P < 0.005 versus GFP (Student’s unpaired two-tailed t-test). e Schematic diagram representing molecular pathways in which excessive mechanical loading induces osteoarthritis development through gremlin-1. All data are expressed as mean ± SD of biologically independent three samples per group

References

    1. Glasson SS, et al. Deletion of active ADAMTS5 prevents cartilage degradation in a murine model of osteoarthritis. Nature. 2005;434:644–648. doi: 10.1038/nature03369. - DOI - PubMed
    1. Stanton H, et al. ADAMTS5 is the major aggrecanase in mouse cartilage in vivo and in vitro. Nature. 2005;434:648–652. doi: 10.1038/nature03417. - DOI - PubMed
    1. Zhu M, et al. Inhibition of beta-catenin signaling in articular chondrocytes results in articular cartilage destruction. Arthritis Rheum. 2008;58:2053–2064. doi: 10.1002/art.23614. - DOI - PMC - PubMed
    1. Echtermeyer F, et al. Syndecan-4 regulates ADAMTS-5 activation and cartilage breakdown in osteoarthritis. Nat. Med. 2009;15:1072–1076. doi: 10.1038/nm.1998. - DOI - PubMed
    1. Lin AC, et al. Modulating hedgehog signaling can attenuate the severity of osteoarthritis. Nat. Med. 2009;15:1421–1425. doi: 10.1038/nm.2055. - DOI - PubMed

Publication types