. 2019 Mar 29;10(1):1412.
doi: 10.1038/s41467-019-09196-9.

Rad52 prevents excessive replication fork reversal and protects from nascent strand degradation

Affiliations

Rad52 prevents excessive replication fork reversal and protects from nascent strand degradation

Eva Malacaria et al. Nat Commun. .

Erratum in

Abstract

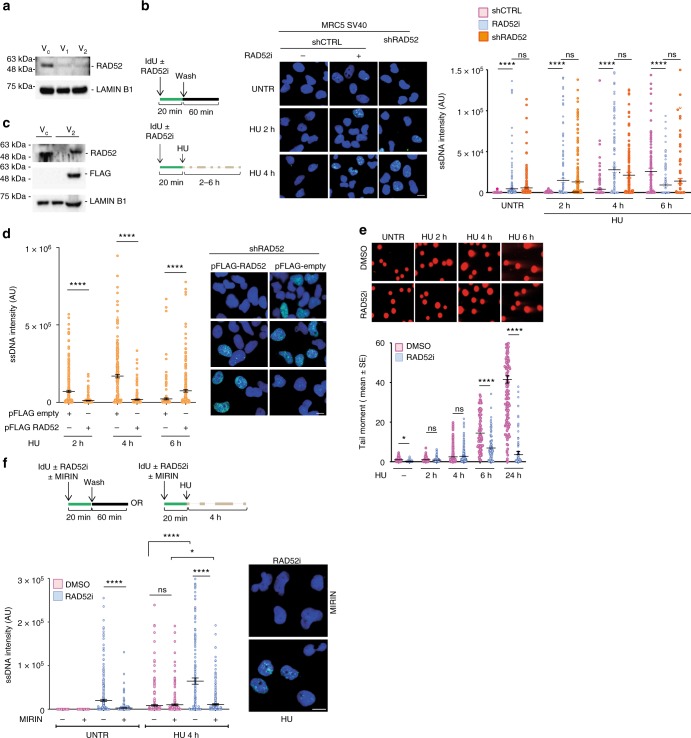
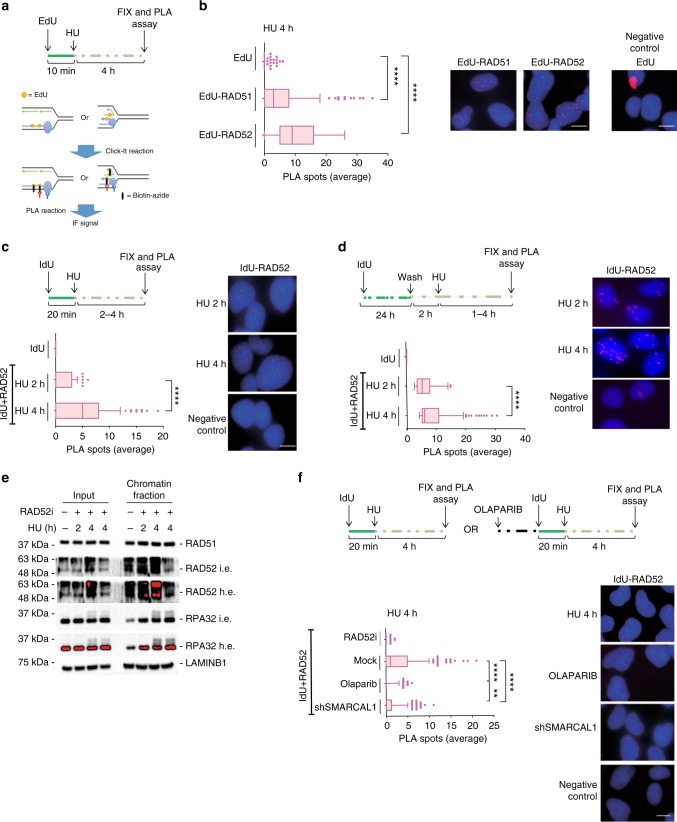
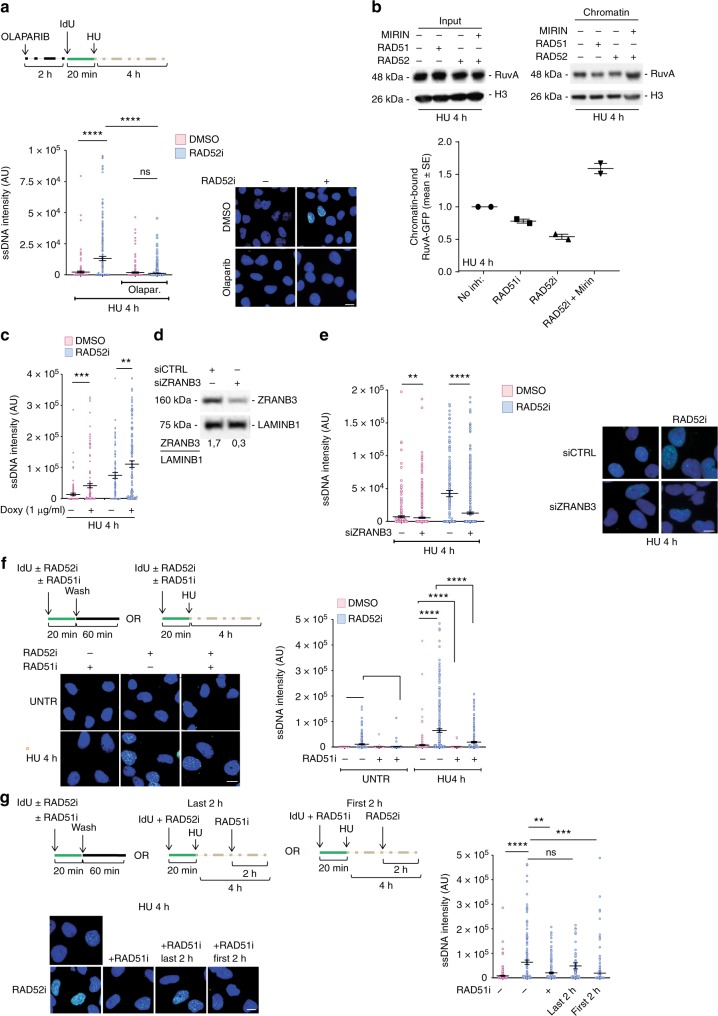
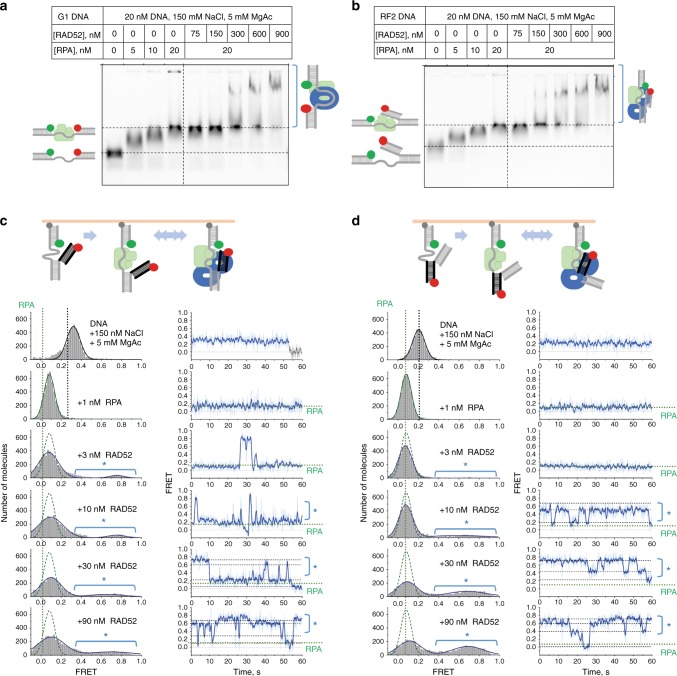
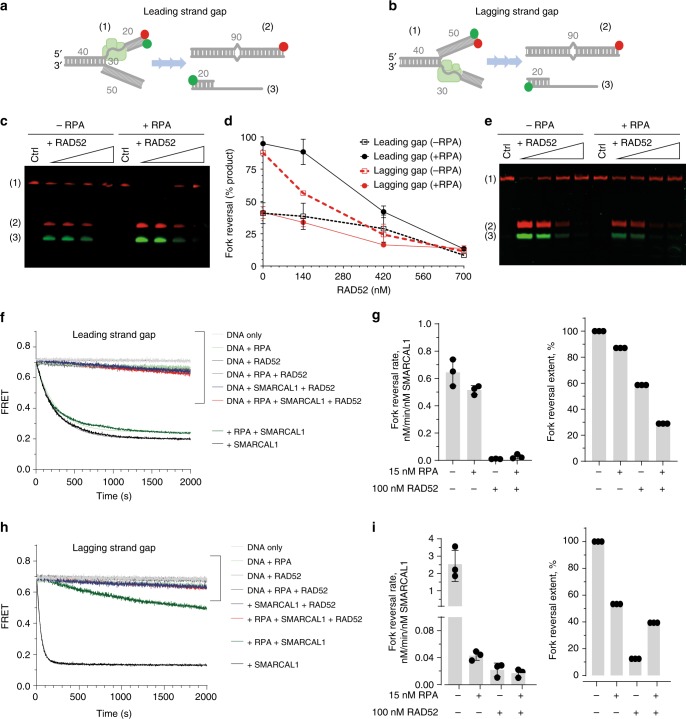
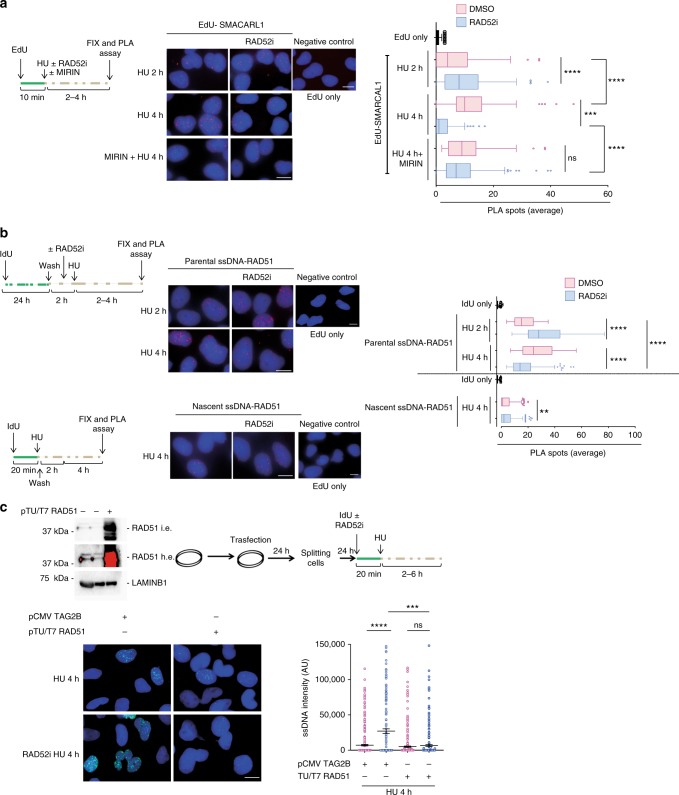
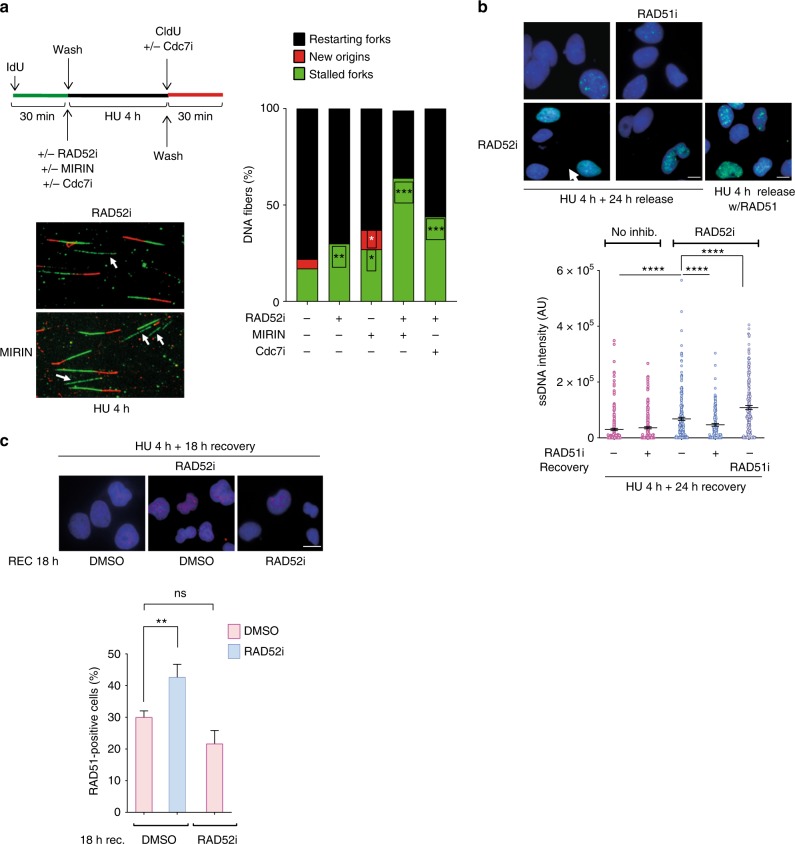
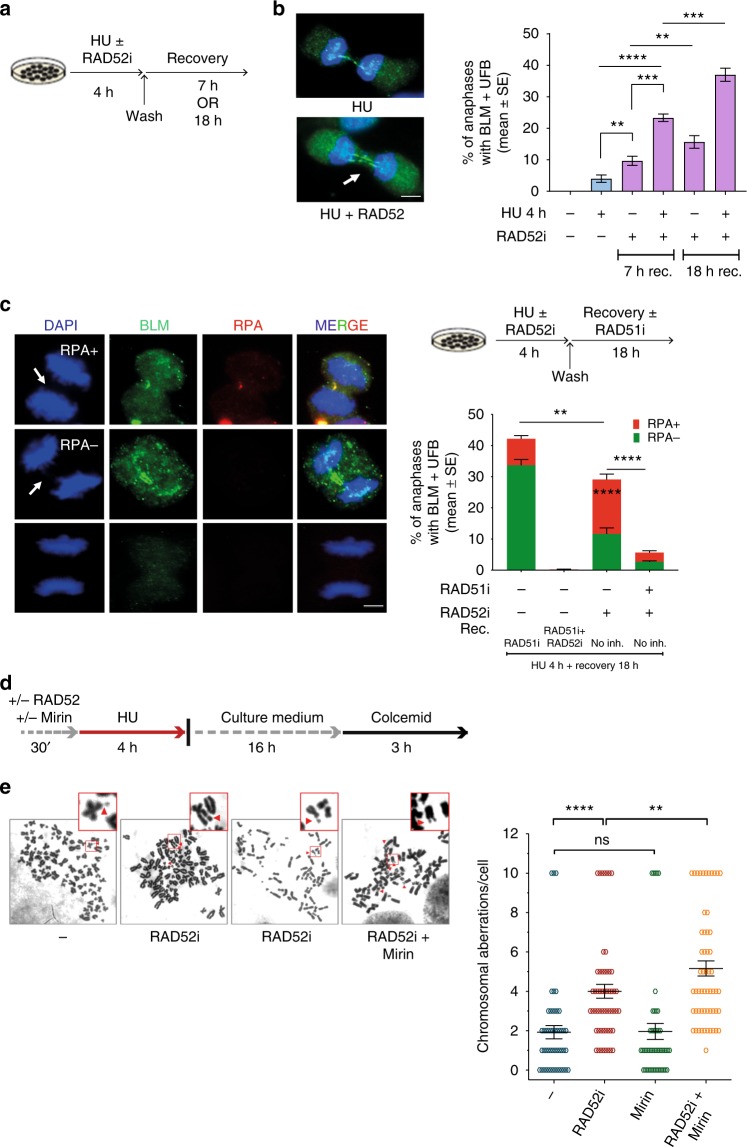
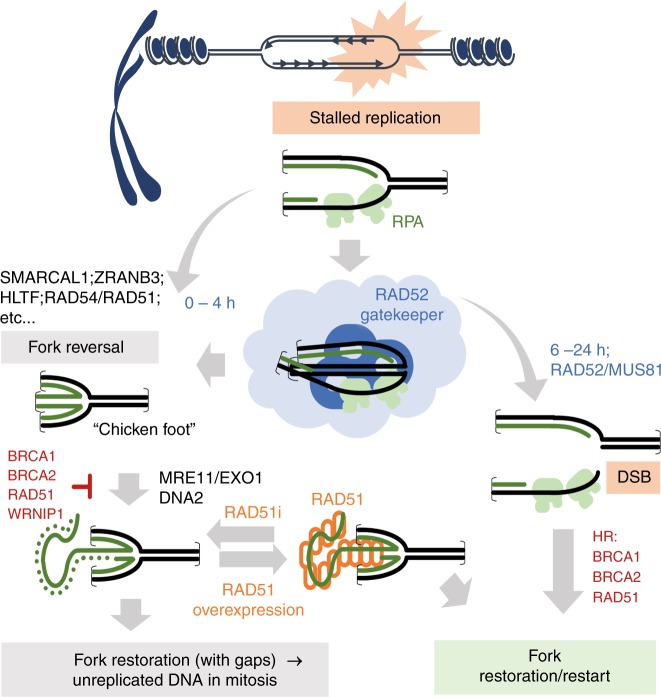
Stabilisation of stalled replication forks prevents excessive fork reversal and their pathological degradation, which can undermine genome integrity. Here we investigate a physiological role of RAD52 at stalled replication forks by using human cell models depleted of RAD52, a specific small-molecule inhibitor of the RAD52-ssDNA interaction, in vitro and single-molecule analyses. We demonstrate that RAD52 prevents excessive degradation of reversed replication forks by MRE11. Mechanistically, RAD52 binds to the stalled replication fork, promotes its occlusion and counteracts loading of SMARCAL1 in vitro and in vivo. Loss of the RAD52 function results in a slightly-defective replication restart, persistence of under-replicated regions and chromosome instability. Moreover, the RAD52-inhibited cells rely on RAD51 for completion of replication and viability upon replication arrest. Collectively, our data suggest an unexpected gatekeeper mechanism by which RAD52 limits excessive remodelling of stalled replication forks, thus indirectly assisting RAD51 and BRCA2 in protecting forks from unscheduled degradation and preventing genome instability.


Conflict of interest statement

The authors declare no competing interests.

Figures

Fig. 1
Fig. 1
Loss of RAD52 causes MRE11-dependent accumulation of nascent ssDNA. a Western blot shows level of RAD52 protein in cells were infected with two different viruses (V1 or V2) containing short hairpin RNA (shRNA) sequences against RAD52. LAMIN B1 was used as loading control. C = control virus. b Analysis of nascent ssDNA after 2 mM hydroxyurea (HU) treatment. On top: schematic of the experiment. Graph shows the intensity of ssDNA staining for single nuclei. Values are presented as means ± SE (ns = not significant; ****P < 0.0001; Mann–Whitney test; N = 184). Representative images are shown. c Western blot analysis of FLAG-RAD52 transfection. LAMIN B1 was used as a loading control. d Cells were transfected with FLAG-RAD52 or FLAG-empty 48 h before to perform nascent ssDNA immunostaining. Dot plots show the mean intensity of ssDNA staining for single nuclei from each cell line after treatment with HU 2 mM. Values are presented as means ± SE (****P < 0.0001; Mann–Whitney test; N = 184). Representative images are shown. e Cells were treated with 2 mM HU at different time points and collected to perform neutral comet assay. Data are presented as mean tail moment ± SE from two independent experiments. N = 93 (ns = not significant; *P < 0.1; ****P < 0.0001; Mann–Whitney test). Representative images are shown. f Cells were treated as indicated in the schemes. Graph shows the mean intensity of ssDNA staining for single nuclei from each cell line. The intensity of the anti-iododeoxyuridine (IdU) immunofluorescence was measured in at least 100 nuclei from two independent experiments. Values are presented as means ± SE (ns = not significant; *P < 0.1; ****P < 0.0001; Mann–Whitney test; N = 290). Representative images of ssDNA formation are given. Scale bar represents 5 µm. Source data are provided as a Source Data file
Fig. 2
Fig. 2
RAD52 is recruited at perturbed replication forks. a Experimental scheme of in situ fork recruitment assay by EdU-proximity ligation assay (PLA). PLA was performed using anti-biotin and anti-RAD52(1) antibodies. Controls were subjected to PLA with anti-biotin only (EdU). b The graph shows the mean number of PLA spots per cell. Values are presented as means ± SE (****P < 0.0001; Mann–Whitney test; N = 149). Representative images are shown. c Analysis of nascent ssDNA–RAD52 interaction by native iododeoxyuridine (IdU)-PLA. On top, schematic of the assay. The graph shows the mean number of PLA spots per cell. PLA performed with anti-IdU only served as negative control. Values are presented as means ± SE (****P < 0.0001; Mann–Whitney test; N = 135). Representative images are shown. d Analysis of parental ssDNA-RAD52 by native IdU-PLA. DNA was labelled as described in the scheme. Graph shown the mean of PLA spots per cell ± SE. PLA performed with anti-IdU only served as negative control. Values are presented as means ± SE (****P < 0.0001; Mann–Whitney test; N = 134). Representative images are shown. e Analysis of chromatin recruitment of RAD52 and RPA32 after replication arrest. Input represents 10% of cell suspension lysed before fractionation. LAMIN B1 was used as a loading control. L.e. = short exposure; H.e. = long exposure. f Analysis of DNA–protein interactions by in situ PLA assay. Cells were treated as in the scheme. Graph shown the mean of PLA spots per cell ± SE. As PLA performed with IdU only—negative control—did not show spots it was not included in the graph, but it is provided as representative image. Values are presented as means ± SE (**P < 0.01; ****P < 0.0001; Mann–Whitney test; N = 257). Representative images are shown. Scale bar represents 5 µm. Source data are provided as a Source Data file
Fig. 3
Fig. 3
Accumulation of nascent ssDNA in RAD52i cells is dependent on fork reversal. a Cells were treated as indicated in the scheme. Graph shows the mean intensity of ssDNA staining at least 100 nuclei. Values are presented as means ± SE (ns = not significant; ****P < 0.0001; Mann–Whitney test; N = 475). b Analysis of RuvA recruitment in chromatin after replication stress. H3 was used as a loading control. c Cells were infected with tetracycline-inducible virus (V1) containing short hairpin RNA (shRNA) sequences direct against SMARCAL1 to produce MRC5 shSMARCAL1 inducible cells lines. Cells were treated or not with doxycicline for 40 h then was labelled with iododeoxyuridine (IdU) to detect nascent ssDNA in presence or not of RAD52 inhibitor and or 2 mM hydroxyurea (HU) for 4 h. Graph shows the mean intensity of ssDNA staining at least 100 nuclei. Values are presented as means ± SE (**P < 0.1; ***P < 0.001; Mann–Whitney test; N = 135). d Cells were transfected with scrambled siRNA (siCTRL) or siRNA directed against ZRANB3. Western blot analysis shows level of protein. LAMIN B1 was used as a loading control. e Graph shows the main intensity of ssDNA staining for single nuclei from untreated or treated cells. Values are presented as means ± SE (**P < 0.1; ****P < 0.0001; Mann–Whitney test; N = 142). Representative images are given. f Analysis of nascent ssDNA in cells inhibited or not for RAD51 and/or RAD52. Graph shows the main intensity of ssDNA staining for single nuclei from untreated or treated cells. Values are presented as means ± SE (****P < 0.0001; Mann–Whitney test; N = 278). g Experimental scheme of nascent ssDNA. Analysis of IdU intensity in cells treated or with RAD51 in combination or not with RAD52 inhibitor. When indicated the inhibitors were added at different time point. Dot plots show the mean intensity of ssDNA staining for single nuclei from each cell line after treatment with HU for 4 h. Mean values are represented as horizontal black lines ± SE; N = 164. (ns = not significant; **P < 0.1; ***P<0.001; ****P < 0.0001; Mann–Whitney test; N = 475). Scale bar represents 5 µm. Source data are provided as a Source Data file
Fig. 4
Fig. 4
RAD52 promotes formation of a reversal-resistant fork structure. a, b Electrophoretic mobility shift analysis of the RPA and RAD52 binding to G1 DNA (a) and a model replication fork, RF1 (b). DNA substrates were incubated with the indicated concentrations of RPA and RAD52. The complexes and the unbound DNA were then separated by electrophoresis in 0.8% TAE agarose. c, d Single-molecule analysis of the replication fork-like structures in the presence of RPA and RAD52. RF2 (c), which reports on the conformation and motion of the leading strand (black) arm relative to the lagging strand arm tethered to the surface, and RF3 (d), which reports on the relative position and dynamics of the parental duplex (black) relative to the surface-tethered lagging strand arm, were immobilised on the surface of the TIRFM flow cell. The Cy3 dye (green circle) was excited by 532 nm TIR illumination, while the Cy5 dye (red circle) was excited via Förster resonance energy transfer (FRET) from Cy3. Fluorescence of the Cy3 and Cy5 dyes was recorded separately and used to calculate FRET efficiency. FRET distributions in the left column of each panel were obtained from combining three short movies and represent the overall FRET states of each substrates under the indicated conditions. Dotted green lines show the FRET distribution for each substrate in the presence of RPA only overlaid over the distribution in the presence of RPA and RAD52. Regions of the distributions marked by a blue star indicate states where the Cy5-labelled arm is brought close to the Cy3-labelled lagging strand arm. Movies recorded for 1 min were used to evaluate the conformational dynamics of the RF2 and RF3 under each experimental condition. Representative single-molecule FRET trajectories are shown in the right column by their respective FRET distributions. Source data are provided as a Source Data file
Fig. 5
Fig. 5
RAD52 prevents fork reversal by SMARCAL1. a, b Cartoon depiction of the DNA substrates and the reversal reaction employing synthetic fork with a 30 nt gap on the leading (a) and lagging (b) strand, respectively. The lengths of the dsDNA and ssDNA features are marked in grey. Green circles depict Cy3 dyes, red circles depict Cy5 dyes. The substrate and the products of the fork reversal reactions are separated on the agarose gels after deproteinization. All reactions were carried out in the presence of 3 nM of forked DNA. ce Representative gels and quantification of the fork reversal reactions by 20 nM SMARCAL1 in the presence of increasing concentrations of RAD52. Reactions were initiated by addition of SMARCA1 and stopped at 15 min. Only Cy5 channel data were used for quantification. f Representative fork reversal time courses for the DNA substrate containing a leading strand gap. Solid faint lines behind the experimental data indicate fits to a single exponential. g The rates of the fork reversal reactions and their extents were calculated by fitting the data to exponential decay functions as described in the Methods section. The resulting rates are shown for three independent experiments. h, i The same as f, g, but for the substrate with a lagging strand gap. Source data are provided as a Source Data file
Fig. 6
Fig. 6
RAD52 affects fork recruitment of SMARCAL1 and RAD51. a Analysis of SMARCAL1 fork recruitment by in situ EdU-proximity ligation assay (PLA). Cells were treated as indicated. The graph shows the number of PLA spots per cell. As a negative control for the PLA, cells were incubated with only the anti-biotin antibody (EdU only). Values are presented as means ± SE (ns not significant; ***P < 0.001; ****P < 0.0001; Mann–Whitney test; N = 145). Representative images are shown. b Analysis of nascent and parental iododeoxyuridine (IdU)-RAD51 PLA. Cells were treated as in the scheme. The graph shows the number of PLA spots per cell ± SE. As a negative control for the PLA, cells were incubated with only the anti-IdU antibody (IdU only). Values are presented as means ± SE (**P < 0.01; ****P < 0.0001; Mann–Whitney test. Nascent DNA N = 170; Parental ssDNA N = 379). Representative images are shown. c Analysis of nascent ssDNA formation in RAD51 overexpressing cells. On top, western blot analysis showing RAD51 overexpression and the experimental scheme used. The graph shows the intensity of ssDNA staining in at least 100 nuclei from two independent experiments. Values are presented as means ± SE (ns not significant; ***P < 0.001; ****P < 0.0001; Mann–Whitney test; N = 436). Representative images are shown. Scale bar represents 5 µm. Source data are provided as a Source Data file
Fig. 7
Fig. 7
Loss of RAD52 leads to persistence of unreplicated DNA. a Analysis of replication fork restart using DNA fibre assay. Cells were treated as indicated in the scheme on the top. The graph shown the percentage of each event. Representative images of DNA fibres fields are presented. Arrows denote stalled forks. (*P < 0.05; **P < 0.01; ***P < 0.001; ANOVA test; N = 140). b Analysis of the persistence of parental ssDNA (template gaps) during recovery from replication arrest. Cells were treated as indicated and analysed by the native iododeoxyuridine (IdU) assay. The graph shows the intensity of ssDNA staining in at least 100 nuclei from two independent experiments. Values are presented as means ± SE (****P < 0.0001; Mann–Whitney test; N = 141). Representative images are shown. c Analysis of RAD51 nuclear foci. Cells were treated with 2 mM hydroxyurea (HU), in the presence or not of the RAD52i, for 4 h and recovered as indicated, without or with RAD52i. The graph shows the percentage of nuclei with RAD51 foci. Data are presented as mean ± SE from three independent experiments. (ns, not significant; **P < 0.01; ANOVA test; N = 145). Representative images are shown. Scale bar represents 5 µm. Source data are provided as a Source Data file
Fig. 8
Fig. 8
Loss of RAD52 leads to enhanced genome instability. a Experimental scheme used for analysis of UFBs. b Quantification of BLM-positive UFBs in cells treated as in a. The graph shows the percentage of anaphases with BLM-positive UFBs. Representative images of anaphase cells with BLM-positive UFB (green) are shown on the right. (**P<0.1; ***P < 0.001; ****P < 0.0001; Mann–Whitney test; N = 50). c Analysis of UFBs in cells treated as shown in the experimental scheme on the top. Quantification of anaphase/telophase cells with BLM/RPA-positive UFBs. The graph shows the percentage of anaphases with BLM-positive UFBs. Representative images of an anaphase cell stained with BLM (green) as control, RPA (red), and DAPI (blue) are shown in the bottom of the panel. Minimum of 50 ana/telophase cells were scored per experiment; arrows indicate position of UFB. (**P < 0.01; ****P < 0.0001; Mann–Whitney test). d, e Analysis of chromosomal aberrations in cells treated as shown in the experimental scheme. Dot blot shows the number of chromosomal aberrations per cell. Data are presented as means of three independent experiments. Horizontal black lines represent the mean ± SE (ns not significant; **P < 0.01; ****P < 0.0001; two-tailed Student’s t-test; N = 57). Representative images of Giemsa-stained metaphases are given. Arrows indicate chromosomal aberrations. Insets show an enlarged portion of the metaphases for a better evaluation of chromosomal aberrations. Scale bar represents 5 µm. Source data are provided as a Source Data file
Fig. 9
Fig. 9
Multiple roles of RAD52 at perturbed replication forks. Model representing multiple roles of RAD52 at perturbed replication forks. In response to replication fork perturbation, RAD52 plays crucial roles both upstream replication fork remodelling and downstream, when integrity of remodelled forks is undermined. The role upstream replication fork remodelling is crucial to limit reversal of replication fork, which may be deleterious if unscheduled. These two independent roles of RAD52 are carried out also through distinct protein partners, and may be relevant under either normal or pathological replication perturbation (see text for details)

References

    1. Neelsen KJ, Lopes M. Replication fork reversal in eukaryotes: from dead end to dynamic response. Nat. Rev. Mol. Cell Biol. 2015;16:207–220. doi: 10.1038/nrm3935. - DOI - PubMed
    1. Quinet A, Lemaçon D, Vindigni A. Replication fork reversal: players and guardians. Mol. Cell. 2017;68:830–833. doi: 10.1016/j.molcel.2017.11.022. - DOI - PMC - PubMed
    1. Kolinjivadi Arun Mouli, Sannino Vincenzo, de Antoni Anna, Técher Hervé, Baldi Giorgio, Costanzo Vincenzo. Moonlighting at replication forks - a new life for homologous recombination proteins BRCA1, BRCA2 and RAD51. FEBS Letters. 2017;591(8):1083–1100. doi: 10.1002/1873-3468.12556. - DOI - PubMed
    1. Poole LA, Cortez D. Functions of SMARCAL1, ZRANB3, and HLTF in maintaining genome stability. Crit. Rev. Biochem. Mol. Biol. 2017;52:696–714. doi: 10.1080/10409238.2017.1380597. - DOI - PMC - PubMed
    1. Bhat KP, Cortez D. RPA and RAD51: fork reversal, fork protection, and genome stability. Nat. Struct. Mol. Biol. 2018;25:446–453. doi: 10.1038/s41594-018-0075-z. - DOI - PMC - PubMed

Publication types