. 2019 Apr;51(4):694-704.
doi: 10.1038/s41588-019-0375-1. Epub 2019 Mar 29.

Genomic subtyping and therapeutic targeting of acute erythroleukemia

Affiliations

Genomic subtyping and therapeutic targeting of acute erythroleukemia

Ilaria Iacobucci et al. Nat Genet. 2019 Apr.

Abstract

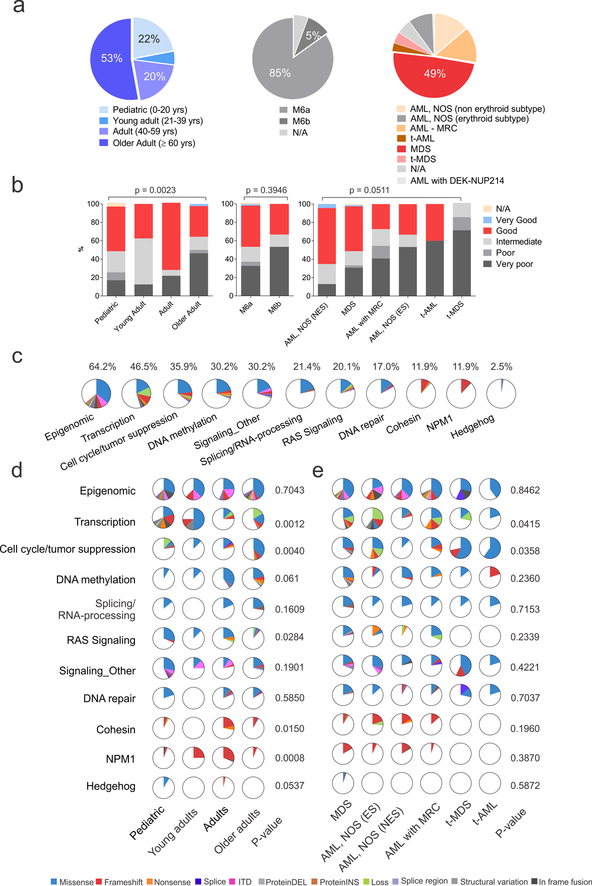
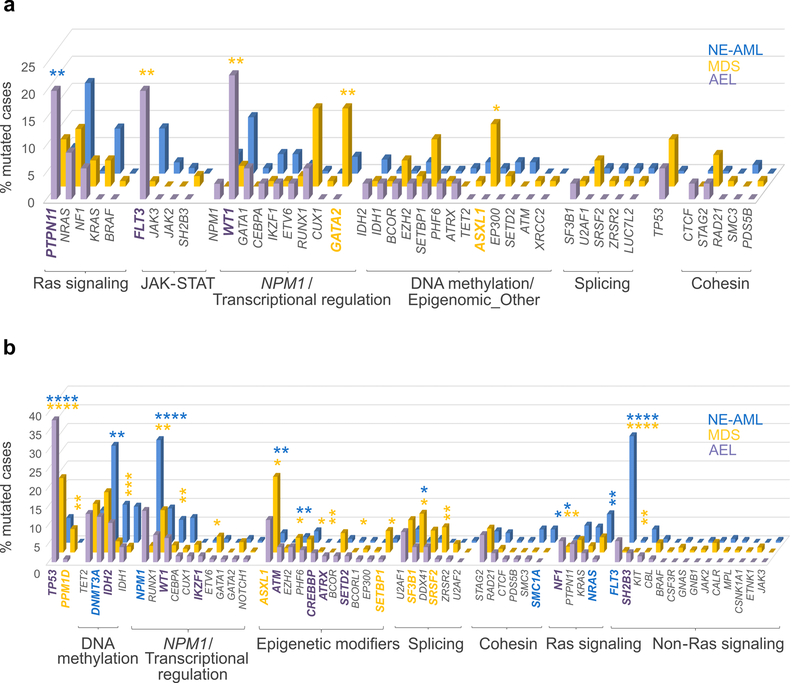
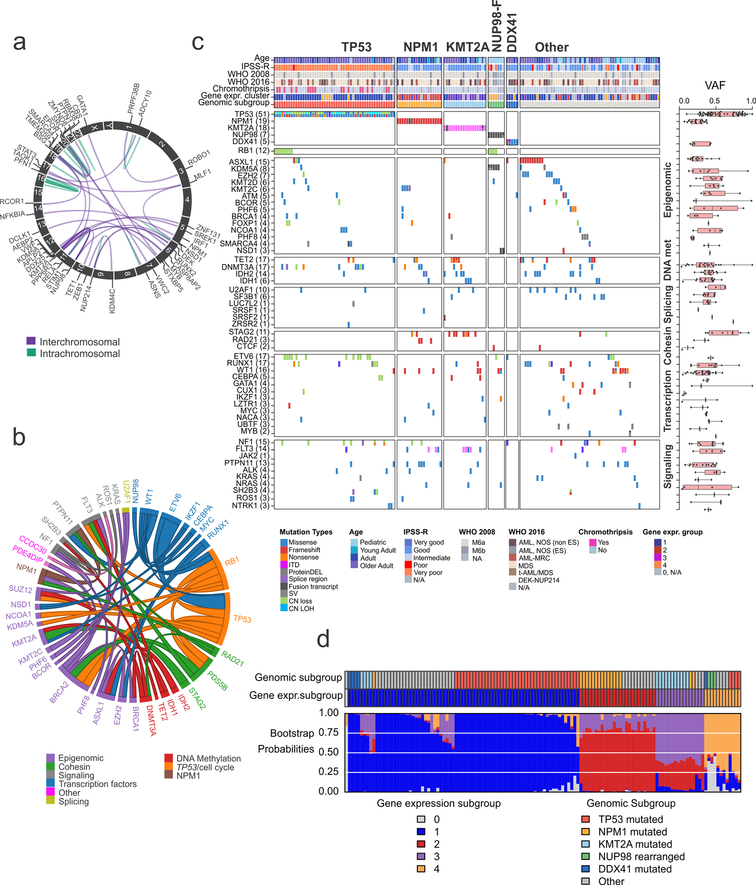
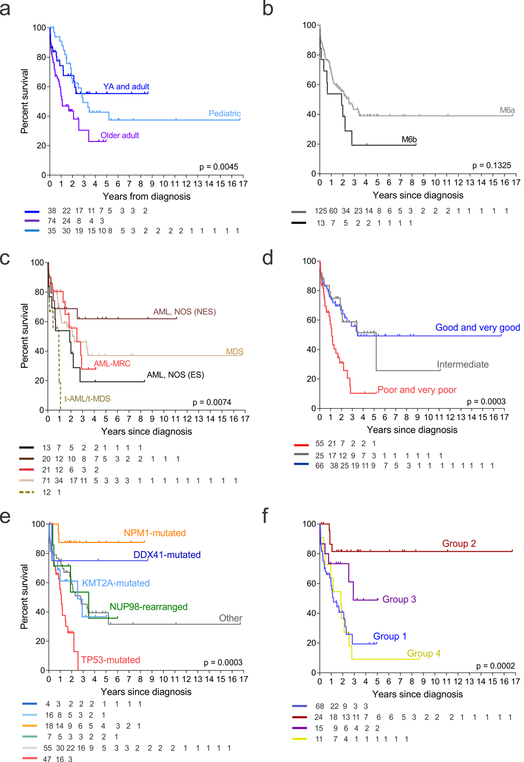
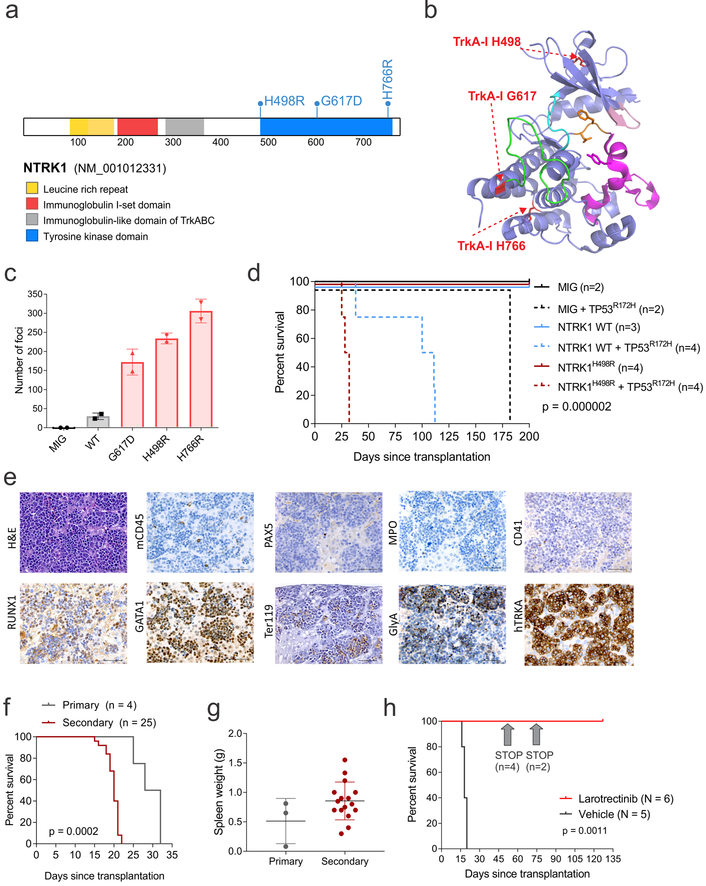
Acute erythroid leukemia (AEL) is a high-risk leukemia of poorly understood genetic basis, with controversy regarding diagnosis in the spectrum of myelodysplasia and myeloid leukemia. We compared genomic features of 159 childhood and adult AEL cases with non-AEL myeloid disorders and defined five age-related subgroups with distinct transcriptional profiles: adult, TP53 mutated; NPM1 mutated; KMT2A mutated/rearranged; adult, DDX41 mutated; and pediatric, NUP98 rearranged. Genomic features influenced outcome, with NPM1 mutations and HOXB9 overexpression being associated with a favorable prognosis and TP53, FLT3 or RB1 alterations associated with poor survival. Targetable signaling mutations were present in 45% of cases and included recurrent mutations of ALK and NTRK1, the latter of which drives erythroid leukemogenesis sensitive to TRK inhibition. This genomic landscape of AEL provides the framework for accurate diagnosis and risk stratification of this disease, and the rationale for testing targeted therapies in this high-risk leukemia.


Figures

Figure 1.
Figure 1.. Demographic, clinical and genomic patient’s characteristics.
(a) Distribution of patients according to age (left), WHO 2008 criteria (middle) and revised WHO 2016 criteria. (b) Revised International Prognostic Scoring System (IPSS-R)-based cytogenetic risk according to age (left panel), WHO 2008 (middle) and WHO 2016 (right panel) criteria (n= 159 biologically independent samples). Two-sided P values are from exact-Chi-square test (age and WHO 2008) and Chi-square test (WHO 2016) (c) Pie charts showing the distribution of the recurrently mutated pathways in the whole AEL cohort. (d) Pie charts showing the distribution of the recurrently mutated pathways according to age (n= 159 biologically independent samples) and WHO 2016 criteria (e) (n= 149 biologically independent samples). The similarity of somatic alteration prevalence in different leukemia subtypes was evaluated by two-sided Chi-Square test. See also Supplementary Tables 8 for numbers and P values for each pathway and gene. Abbreviations: yrs, years; N/A, information not available; ns, not significant; AML, NOS acute myeloid leukemia, not otherwise specified; NES, non erythroid subtype; ES, erythroid subtype; t-AML, therapy-related AML; t-MDS, therapy-related MDS.
Figure 2.
Figure 2.. Mutation rates in AEL (WHO 2008), non-erythroid AML and MDS patients.
(a) Comparison of mutation rates in pediatric (0–20 years) AEL (n=35 biologically independent samples), MDS (n=104 biologically independent samples) and non erythroid AML (n=192 biologically independent samples) patients. (b) Comparison of mutation rates in adult AEL (n=124 biologically independent samples), MDS (n=1410 biologically independent samples) and non-erythroid AML (n=197 biologically independent samples) patients. Mutated genes are grouped according to their function and the order within each group is based on the mutation frequency in AEL patients (from largest to smallest). Only cases for which sequencing data were available for all three cohorts are reported in the figure. Data are from non-silent SNV, indel or internal tandem duplication (ITD) sequence mutations. Frequency of mutations in the different leukemia subtypes were compared by two-sided Fisher’s exact tests (see Supplementary Tables 17–18 for numbers for each group and P values for each gene). P values are from Fisher’s exact test. *, P-value ≤ 0.05; **, P-value ≤ 0.01; ***, P-value ≤ 0.001; ****, P-value ≤ 0.0001. P values in purple are from AEL v MDS; those in blue are from: AEL v non erythroid AML (NE-AML). Genes whose mutation frequency is statistically different among the different myeloid entities are in bold and their color depends on the subtype with the higher frequency (purple: AEL, yellow: MDS and blue: NE-AML).
Figure 3.
Figure 3.. Genomic classification of AEL.
(a) Schematic chimeric inter- (purple) and intra- (green) chromosomal in frame fusions in AEL. Gene labels are shown for interchromosomal fusions. (b) Pairwise gene associations with a Fisher’s exact test P value < 0.05. Different functional annotation categories are in different colors. The size of the ribbon is proportional to the number of cases (n= 159 biologically independent samples). (c) Heatmap showing the 5 genomic AEL subgroups (TP53, TP53-mutated AEL; NPM1, NPM1-mutated AEL; KMT2A, KMT2A-mutated or rearranged AEL; NUP98-F, AEL with NUP98 fusions; DDX41, DDX41-mutated AEL) and “other”, lacking a recurrent exclusive mutated gene and/or fusion gene (n= 159 biologically independent samples). (d) Color map of genomic subgroups, expression subgroup, and expression subgroup bootstrap probabilities. Each column of the color map corresponds to one patient (n= 130 biologically independent samples). The top row indicates the genomic subgroup of each patient according to the color legend at the bottom right. The middle row indicates the expression subgroup according to the color legend at the bottom left. The third row provides the expression subgroup bootstrap assignment probabilities according to the color legend at the bottom left. The primary assignment bootstrap probability was greater than 50% in 128 of 130 subjects; the mean primary assignment bootstrap probability across all subjects was 82.6%. Abbreviations: gene expr. group, gene expression group; mut: mutated; CN LOH: copy neutral loss of heterozygosity.
Figure 4.
Figure 4.. Association with clinical outcome.
Kaplan–Meier survival curves with overall survival distributions according to age (a), WHO 2008 (b) and 2016 classification criteria (c), IPSS-R cytogenetic risk (d), genomic subgroups (e) and gene expression groups (f) (n= 147 independent individuals). At risk numbers for each analysis are provided in the figures. Outcome associations were analyzed with the log-rank test. Abbreviations: AML, NOS acute myeloid leukemia, not otherwise specified; NES, non erythroid subtype; ES, erythroid subtype; t-AML, therapy-related AML; t-MDS, therapy-related MDS.
Figure 5.
Figure 5.. NTRK1 mutations in AEL.
(a) NTRK1 mutations in AEL. (b) Structural modeling of NTRK1 mutations (in red) (PDB 4F0I). The structure is represented similar to that of ref. with the DFG-motif in orange, the activation segment in magenta, the kinase insert domain in green, the hinge in cyan, and the G-loop in pink. (c) Focus formation assay in NIH/3T3 cells. Number of foci are from 2 week culture and two replicates. Mean and S.D. are shown. (d) Kaplan–Meier survival curves from mice transplanted with wild-type (WT, plain lines) or TP53R172H (dotted lines) HSPCs expressing NTRK1, NTRK1H498R or empty vector (MIG). (e) Hematoxylin and eosin staining and IHC of liver from a representative primary tumor with NTRK1H498R/TP53R172H induced erythroid leukemia. Scale bars represent 50 μm. This experiment was performed in an independent mouse obtaining similar results. (f) Kaplan–Meier survival curves of primary and secondary recipient mice. Outcome associations were analyzed with the log-rank test. (g) Spleen weight from primary (n = 3) and secondary (n=16) recipient mice with NTRK1H498R/TP53R172H induced leukemia. The mean expression is shown by the horizontal line in the scatter dot plot and the error bars represent the S.D. (h) Kaplan–Meier survival curves in mice treated with larotrectinib (n=6) or vehicle (n=5). In the drug-treated group larotrectinib was stopped after 49 (n=4 mice) and 69 (n=2 mice) days. Outcome associations between treated (n=6) and untreated (n=5) mice were analyzed with the log-rank test.

References

    1. Cancer Genome Atlas Research, N. Genomic and epigenomic landscapes of adult de novo acute myeloid leukemia. N Engl J Med 368, 2059–74 (2013). - PMC - PubMed
    1. Papaemmanuil E et al. Genomic Classification and Prognosis in Acute Myeloid Leukemia. N Engl J Med 374, 2209–21 (2016). - PMC - PubMed
    1. Cervera N et al. Molecular characterization of acute erythroid leukemia (M6-AML) using targeted next-generation sequencing. Leukemia 30, 966–70 (2016). - PubMed
    1. Grossmann V et al. Acute erythroid leukemia (AEL) can be separated into distinct prognostic subsets based on cytogenetic and molecular genetic characteristics. Leukemia 27, 1940–3 (2013). - PubMed
    1. Ping N et al. Exome sequencing identifies highly recurrent somatic GATA2 and CEBPA mutations in acute erythroid leukemia. Leukemia 31, 195–202 (2017). - PubMed

Publication types

Supplementary concepts