. 2019 Apr;7(7):e14045.
doi: 10.14814/phy2.14045.

A mathematical model of parathyroid gland biology

Affiliations

A mathematical model of parathyroid gland biology

Gudrun Schappacher-Tilp et al. Physiol Rep. 2019 Apr.

Abstract

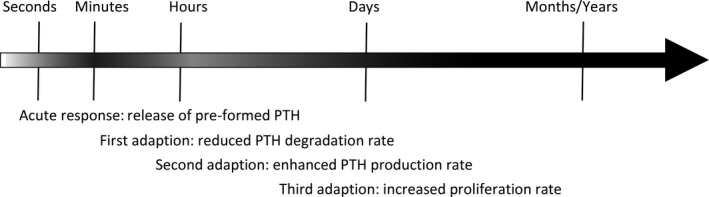
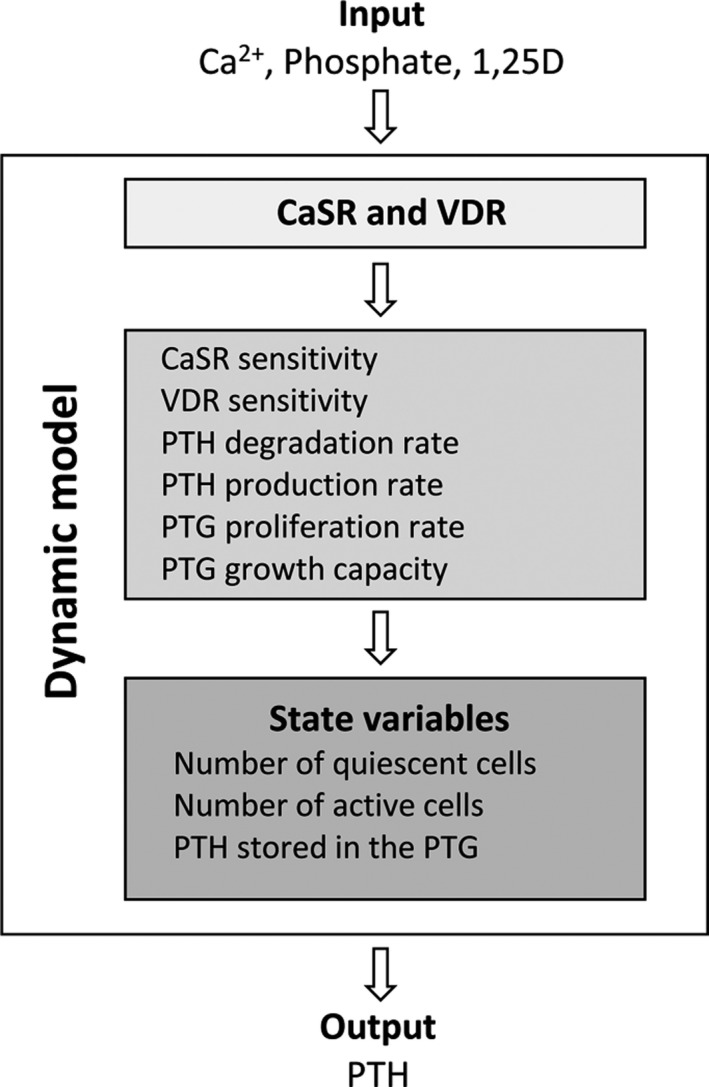
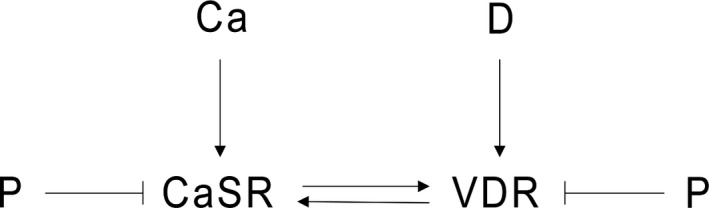
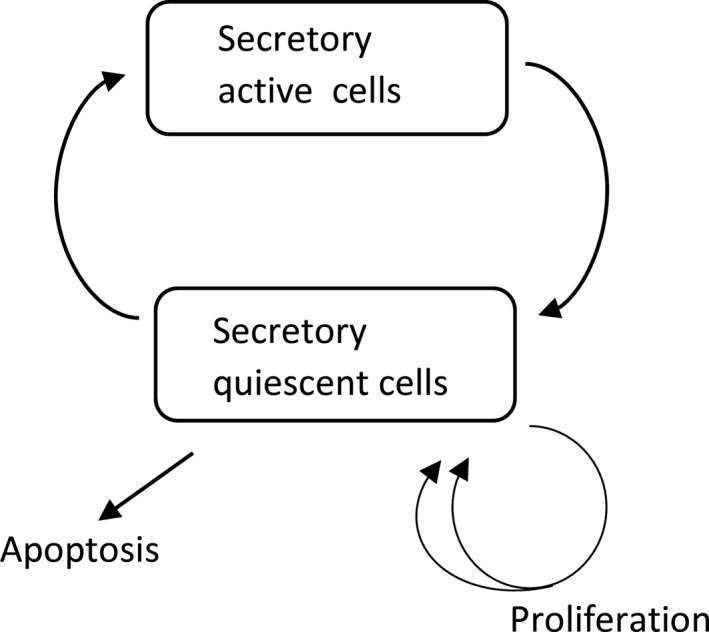
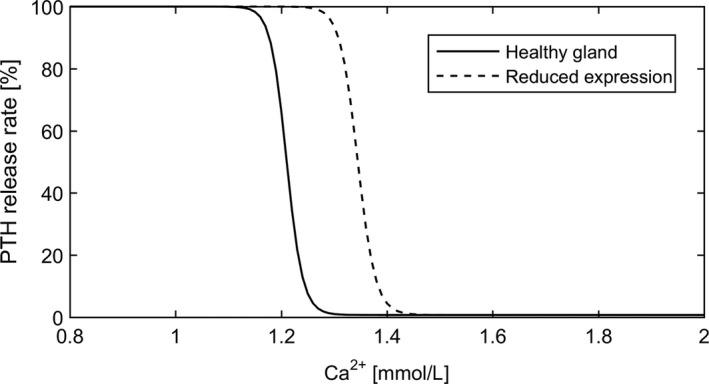
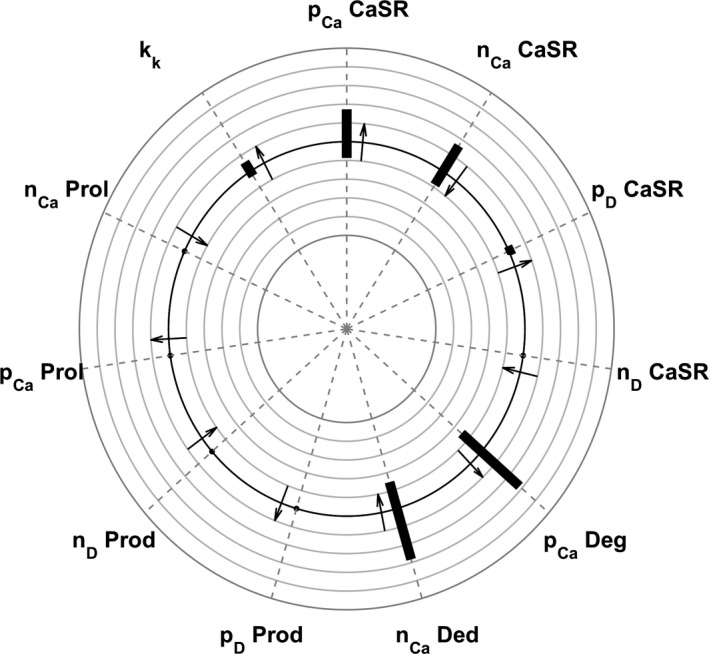
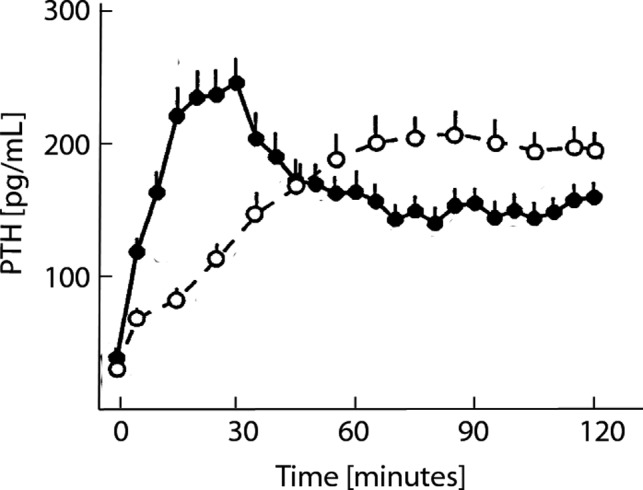
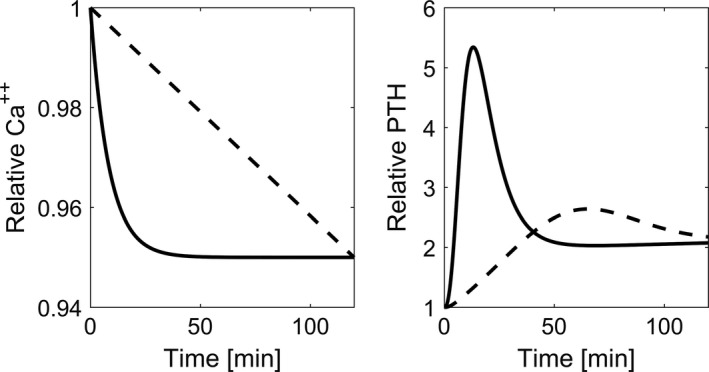
Altered parathyroid gland biology in patients with chronic kidney disease (CKD) is a major contributor to chronic kidney disease-mineral bone disorder (CKD-MBD). This disorder is associated with an increased risk of bone disorders, vascular calcification, and cardiovascular events. Parathyroid hormone (PTH) secretion is primarily regulated by the ionized calcium concentration as well as the phosphate concentration in the extracellular fluid and vitamin D. The metabolic disturbances in patients with CKD lead to alterations in the parathyroid gland biology. A hallmark of CKD is secondary hyperparathyroidism, characterized by an increased production and release of PTH, reduced expression of calcium-sensing and vitamin D receptors on the surface of parathyroid cells, and hyperplasia and hypertrophy of these cells. These alterations happen on different timescales and influence each other, thereby triggering a cascade of negative and positive feedback loops in a highly complex manner. Due to this complexity, mathematical models are a useful tool to break down the patterns of the multidimensional cascade of processes enabling the detailed study of subsystems. Here, we introduce a comprehensive mathematical model that includes the major adaptive mechanisms governing the production, secretion, and degradation of PTH in patients with CKD on hemodialysis. Combined with models for medications targeting the parathyroid gland, it provides a ready-to-use tool to explore treatment strategies. While the model is of particular interest for use in hemodialysis patients with secondary hyperparathyroidism, it has the potential to be applicable to other clinical scenarios such as primary hyperparathyroidism or hypo- and hypercalcemia.

Keywords: Calcium-sensing receptor; Mathematical model; Parathyroid gland; Parathyroid hormone.


Conflict of interest statement

Peter Kotanko holds stock in Fresenius Medical Care.

Figures

Figure 1
Figure 1
Schematic timeline for PTH secretory rate summarizing results presented in (Habener 1981; Brown et al. 1985; Schwarz et al. 1993; Tokumoto et al. 2005; Goodman and Quarles 2008). Darker color indicates higher PTH secretory rate. The adaptive mechanisms of the parathyroid gland operate on different time scales ensuring elevated PTH secretion over a long period of time.
Figure 2
Figure 2
The model inputs are the plasma ionized calcium concentration, plasma phosphate concentration as well as plasma 1,25D concentration. The model output is the PTH concentration.
Figure 3
Figure 3
Expression of the CaSR and VDR. While there is a positive feedback loop between the VDR and CaSR, CaSR and VDR expressions are suppressed by phosphate.
Figure 4
Figure 4
Sketch of the PTG. Cells in the secretory quiescent state can proliferate or undergo apoptosis.
Figure 5
Figure 5
PTH release rate as a function of Ca2+. A reduced expression of CaSR results in a shift of the release function. In this example, CS equals 90% of the actual ionized calcium concentration.
Figure 6
Figure 6
Sensitivity plot of PTH predictions to changes in various parameters. The plot depicts the maximum deviation from reference PTH values as the ratio between the calculated PTH and the reference PTH. The smallest circle corresponds to a relative deviation of 0.5, the largest circle to a relative deviation of 1.5. Arrows pointing outward indicate that higher parameter values lead to higher PTH values; arrows pointing inward indicate that higher parameter values lead to smaller PTH values.
Figure 7
Figure 7
Experimental data reported in Estepa et al. (1999), Figure 2B (adjusted and reproduced with permission of Kidney International). Ionized calcium concentrations were reduced by 0.4 mmol/L either in 30 min followed by a 90‐min hypocalcemic clamp (fast reduction, solid dots) or in 120 min (slow reduction, open dots). The fast Ca2+ reduction leads to a prominent peak in PTH levels. However, PTH levels during the hypocalcemic clamp following the fast reduction were significantly lower than PTH levels in the slow induction group.
Figure 8
Figure 8
Time versus Ca2+ and predicted PTH concentrations during induced hypocalcemia. While PTH response shows a prominent peak when the rate of calcium reduction is high (solid line), the peak is almost diminished when the rate of change is low (dashed line).
Figure 9
Figure 9
Clinical data adapted from (Schwarz et al. 1998), Figure 1(a), with permission by Clinical Endocrinology. Time versus Ca2+ (dotted line) and PTH (solid line) concentrations during induced hypocalcemia, normocalcemia, and subsequent hypocalcemia.
Figure 10
Figure 10
Time versus prescribed Ca2+ (dotted line) and predicted PTH concentrations (solid line) during simulated induced hypocalcemia, normocalcemia, and subsequent hypocalcemia.
Figure 11
Figure 11
Time versus prescribed Ca2+ (dotted line) and predicted PTH (solid line) concentrations during simulated induced chronic hypocalcemia. The timescale is logarithmic; the black vertical lines indicate 1 h, 1 day, and 1 month.
Figure 12
Figure 12
PTH (mean and range) as a function if time reported in Rutherford et al. (1977), Figure 5. Adapted and reproduced with the permission of the Journal of Clinical Investigation. PTH was reported every 6 months. The slope of increase was significantly lower if phosphate intake was reduced according to the fall in glomerular filtration rate.
Figure 13
Figure 13
Time versus phosphate (dashed line) and 1,25D concentrations (dotted line) and the corresponding PTH concentrations (solid line) simulating experimental setup reported in Rutherford et al. (1977). High phosphate levels (left panel) lead to significantly higher PTH values than moderate elevated phosphate levels (right panel).

References

    1. Ben‐Dov, I. Z. , Galitzer H., Lavi‐Moshayoff V., Goetz R., Kuro‐o M., Mohammadi M., et al. 2007. The parathyroid is a target organ for FGF23 in rats. J. Clin. Invest. 117:4003–4008. - PMC - PubMed
    1. Benzekry, S. , Lamont C., Beheshti A., Tracz A., Ebos J. M. L., Hlatky L., et al. 2014. Classical mathematical models for description and prediction of experimental tumor growth. PLoS Comput. Biol. 10:e1003800. - PMC - PubMed
    1. Block, G. , Martin K., de Francisco A., Turner S., Avram M., Suranyi M., et al. 2004. Cinacalcet for secondary hyperparathyroidism in patients receiving hemodialysis. N. Engl. J. Med. 350:1516–1525. - PubMed
    1. Borrego, M. , Felsenfeld A., MartinMalo A., Almaden Y., Concepcion M., Aljama P., et al. 1997. Evidence for adaptation of the entire PTH‐calcium curve to sustained changes in the serum calcium in haemodialysis patients. Nephrol. Dial. Transplant. 12:505–513. - PubMed
    1. Brea, J. , Castro M., Giraldo J., Lopez‐Gimenez J. F., Fernando Padin J., Quintian F., et al. 2009. Evidence for distinct antagonist‐revealed functional states of 5‐hydroxytryptamine(2A) receptor homodimers. Mol. Pharmacol. 75:1380–1391. - PubMed

Publication types

MeSH terms