. 2019 Mar 30;18(1):64.
doi: 10.1186/s12943-019-0976-4.

Crosstalk between cancer cells and tumor associated macrophages is required for mesenchymal circulating tumor cell-mediated colorectal cancer metastasis

Affiliations

Crosstalk between cancer cells and tumor associated macrophages is required for mesenchymal circulating tumor cell-mediated colorectal cancer metastasis

Chen Wei et al. Mol Cancer. .

Abstract

Background: Tumor-associated macrophages (TAMs) are major components of tumor microenvironment that frequently associated with tumor metastasis in human cancers. Circulating tumor cell (CTC), originating from primary tumor sites, is considered to be the precursors of tumor metastasis. However, the regulatory mechanism of TAMs in CTC-mediated tumor metastasis still remains unclear.

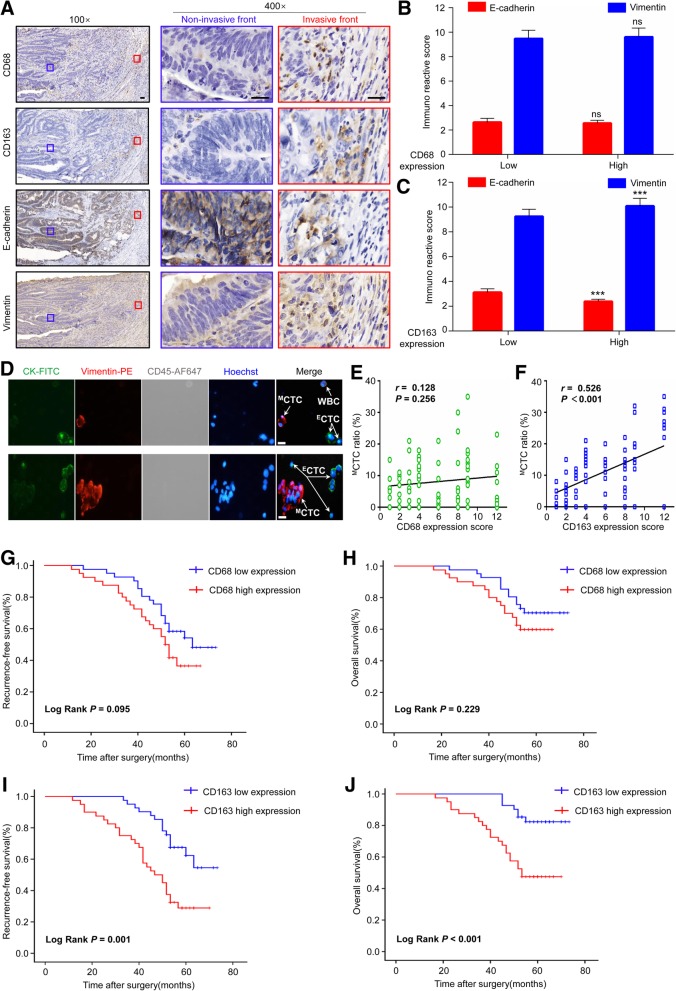
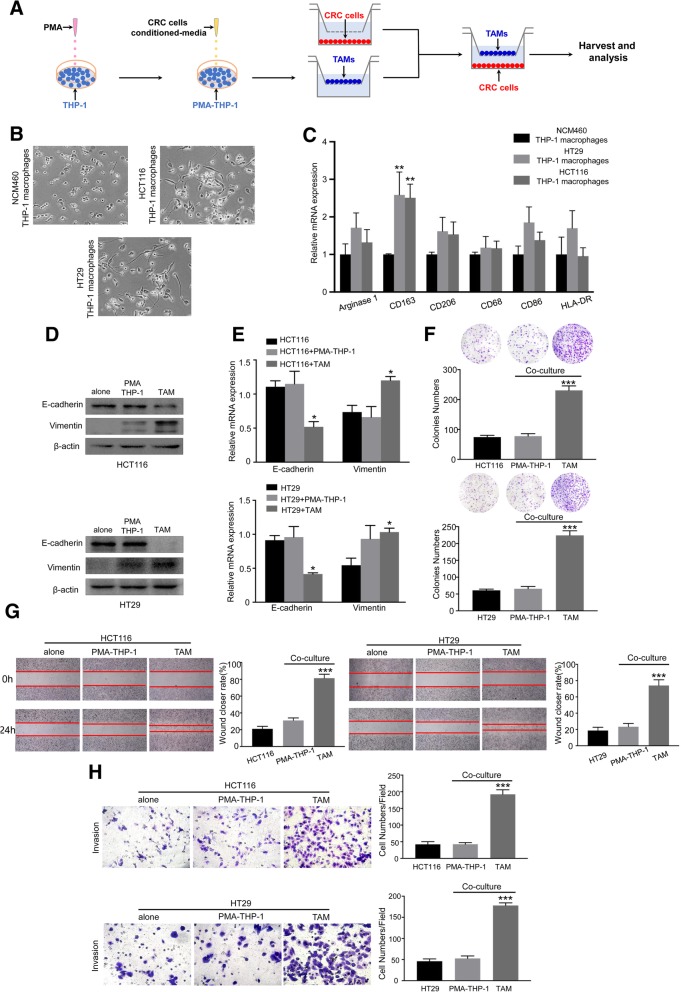
Methods: Immunohistochemical staining was used to detect the macrophages infiltration (CD68 and CD163), epithelial-mesenchymal transition (EMT) markers (E-cadherin and Vimentin) expression in serial sections of human colorectal cancer (CRC) specimens. Then, the correlations between macrophages infiltration and clinicopathologic features, mesenchymal CTC ratio, and patients' prognosis were analyzed. A co-culture assay in vitro was used to evaluate the role of TAMs on CRC EMT, migration and invasion, and ELISA, luciferase reporter assay and CHIP were performed to uncover the underlying mechanism. Furthermore, an in vivo model was carried out to confirm the effect of TAMs on mesenchymal CTC-mediated metastasis.

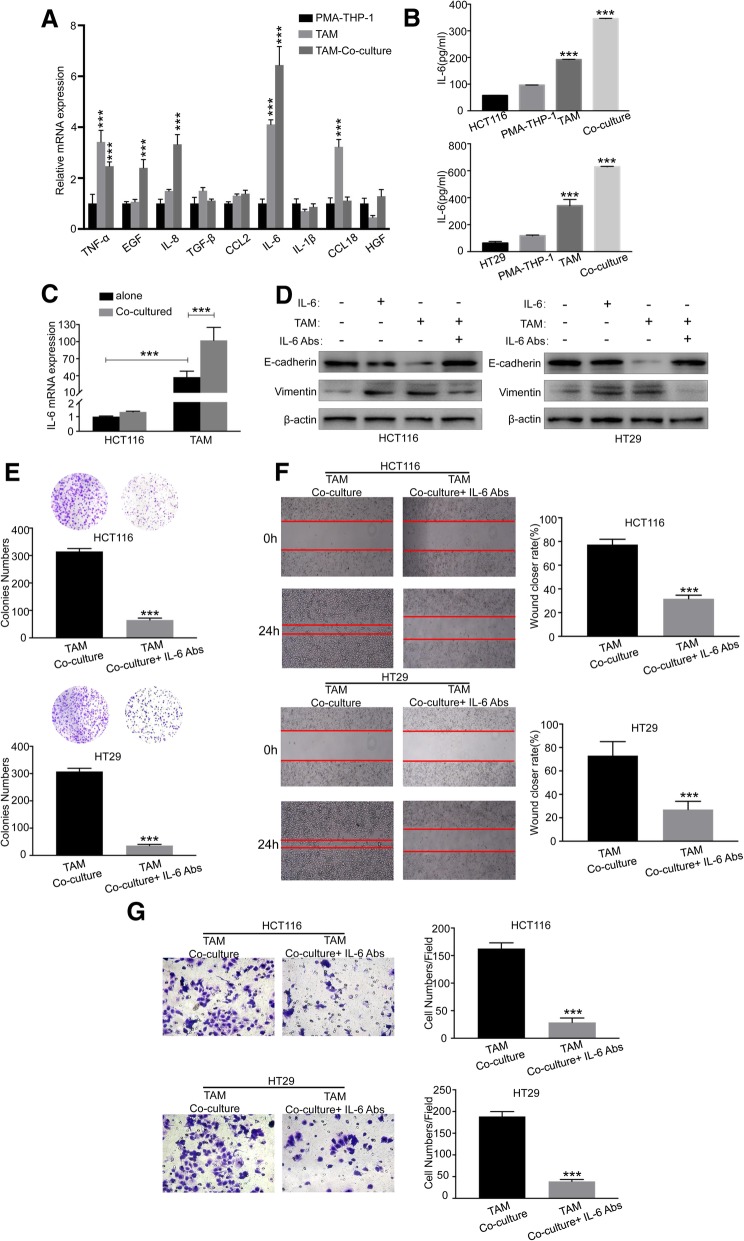
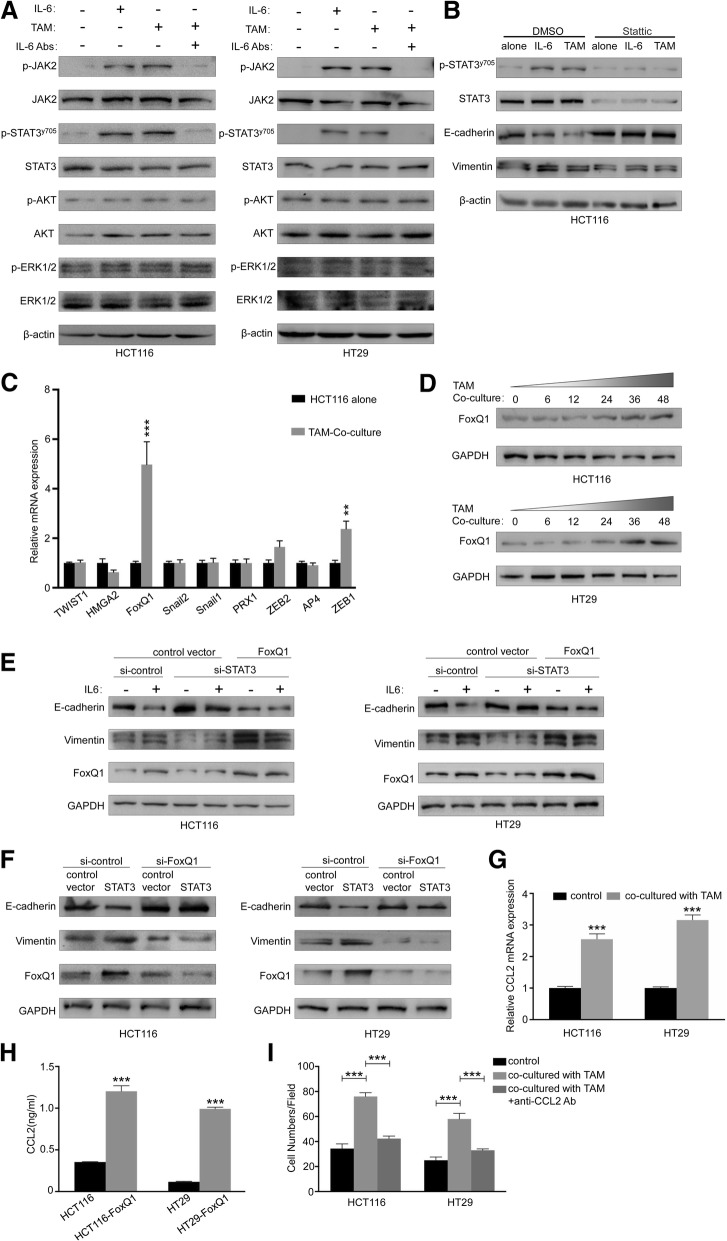
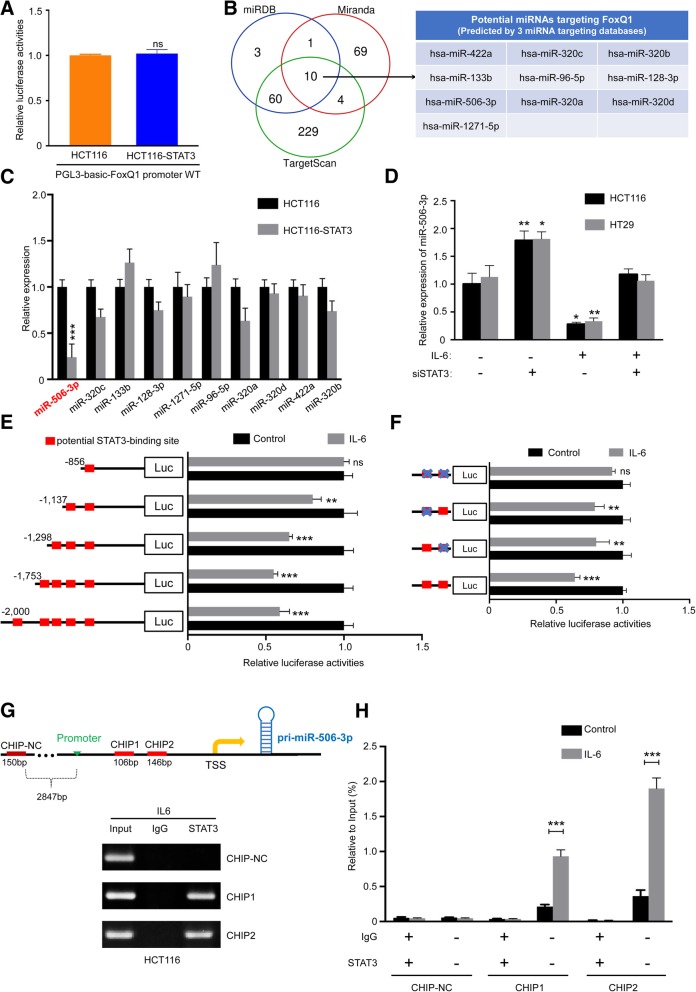
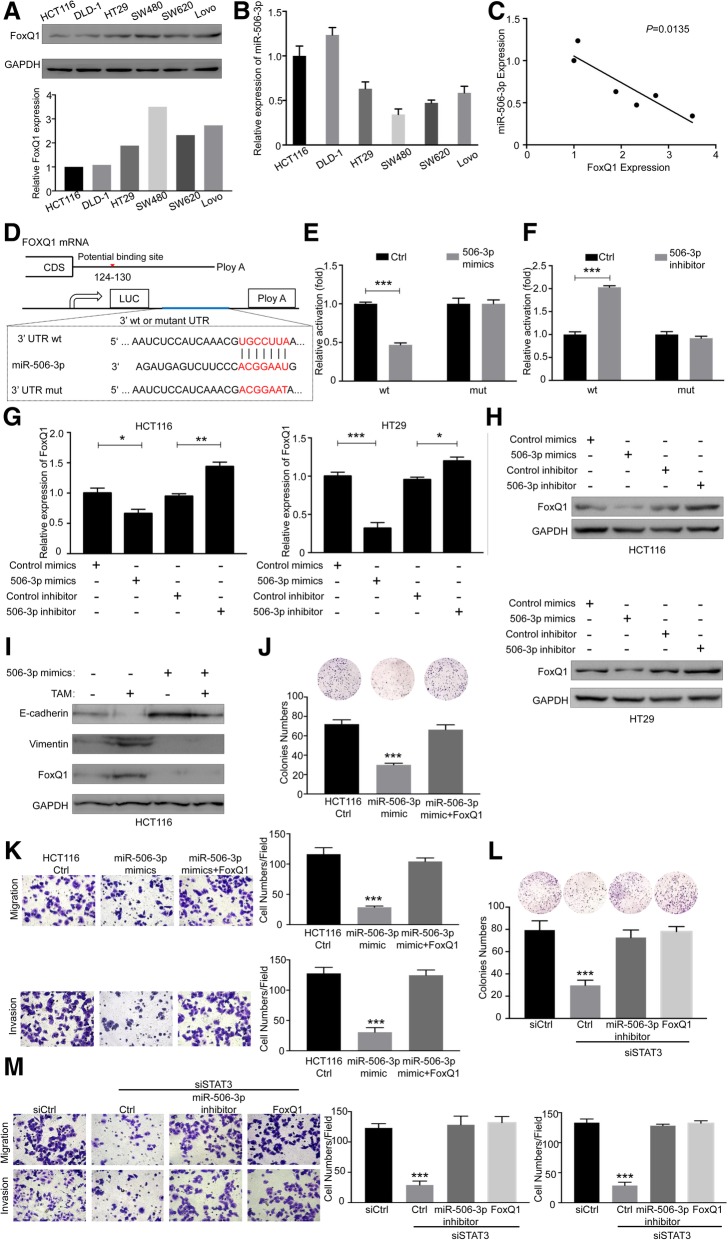
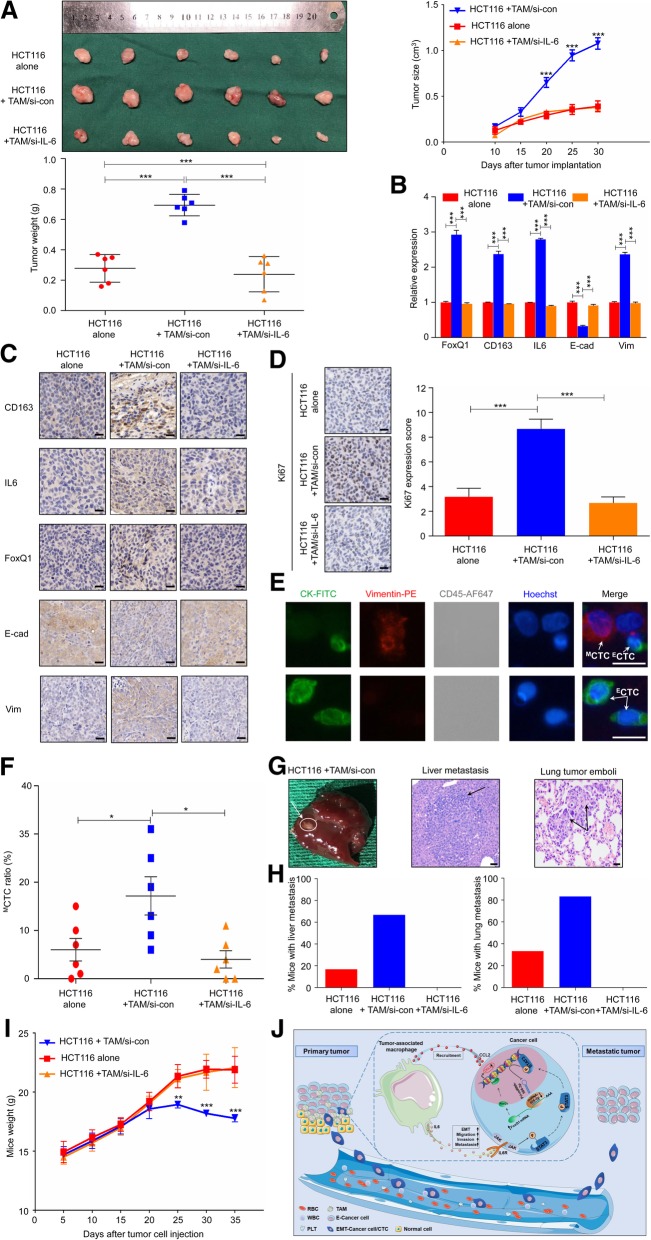
Results: Clinically, CD163+ TAMs infiltrated in invasive front was associated with EMT, mesenchymal CTC ratio, and poor prognosis in patients with CRC. CRC-conditioned macrophages regulated EMT program to enhance CRC cells migration and invasion by secreting IL6. TAMs-derived IL6 activated the JAK2/STAT3 pathway, and activated STAT3 transcriptionally inhibited the tumor suppressor miR-506-3p in CRC cells. miR-506-3p, a key miRNA regulating FoxQ1, was downregulated in CRC cells, resulting in increased FoxQ1 expression, which in turn led to the production of CCL2 that promoted macrophage recruitment. Inhibition of CCL2 or IL6 broke this loop and reduced macrophage migration and mesenchymal CTC-mediated metastasis, respectively.

Conclusions: Our data indicates that TAMs induce EMT program to enhance CRC migration, invasion, and CTC-mediated metastasis by regulating the JAK2/STAT3/miR-506-3p/FoxQ1 axis, which in turn leads to the production of CCL2 that promote macrophage recruitment, revealing a new cross-talk between immune cells and tumor cells in CRC microenvironment.

Keywords: Circulating tumor cell; Colorectal cancer; EMT; Metastasis; Prognosis; Tumor-associated macrophages.


Conflict of interest statement

Ethics approval and consent to participate

This study was approved by the Zhongnan Hospital of Wuhan University ethics committee and written informed consent was obtained from all patients. All animal studies were approved by the Institutional Animal Care and Use Committee of the Zhongnan Hospital of Wuhan university.

Consent for publication

Not applicable.

Competing interests

The authors declare that they have no competing interests.

Publisher’s Note

Springer Nature remains neutral with regard to jurisdictional claims in published maps and institutional affiliations.

Figures

Fig. 1
Fig. 1
CD163+ TAMs at invasive front is correlated with EMT phenotype, MCTC ratio, and poor prognosis in CRC patients. (a) Representative IHC staining for CD68, CD163, E-cadherin, and Vimentin in the invasive front and non-invasive front of serial sections from a human CRC sample. (b-c) Expression of E-cadherin and Vimentin in human CRC samples with low or high CD68 and CD163 expression at invasive front, respectively. (d) Representative CTC images from included patient 5 and 27, respectively. Four-color immunocytochemistry method based on FITC-labeled anti-CK, PE-labeled anti-Vimentin, AF647-labeled anti-CD45, and Hoechst nuclear staining was applied to identify and enumerate CTCs from non-specially trapped WBCs. Scale bar, 20 μm. (e-f) Association of CD68 and CD163 expression at invasive front witth MCTC ratio, respectively. (g-h) Association of CD68 expression at invasive front with the patients’ recurrence-free survival and overall survival in CRC, respectively. (i-j) Association of CD163 expression at invasive front with the patients’ recurrence-free survival and overall survival in CRC, respectively. Error bars, SEM. ns, not significant; ***P < 0.001
Fig. 2
Fig. 2
CD163+ TAMs induce EMT to promote migration and invasion of CRC cells. (a) Schema for representing the experiment procedures. (b) PMA-treated THP-1 macrophages were cultured with NCM460-, HCT116- or HT29-conditioned media for 48 h. The representative bright-field images of macrophages treated by the respective conditioned media are shown. (magnification, ×200). (c) RT-PCR analyzed the expression of the markers of pan-macrophage (CD68), M1 (arginase 1, CD86, HLA-DR) and M2 (CD163, CD206) macrophages in PMA-treated THP-1 macrophages incubated with the conditioned media from NCM460, HCT116 and HT29 for 48 h; Error bars, SEM. (d) The effect of the TAMs on the EMT of CRC cells (HCT116 and HT29) was analyzed by Western blot analysis. (e) RT-PCR for analyzing the expression of E-cadherin and Vimentin in CRC cells (HCT116 and HT29) alone or co-cultured with macrophages (PMA-treated THP-1 macrophages or TAMs) for 48 h; Error bars, SEM. (f), (g) and (h) Cell proliferation, migration and invasion capacity of CRC cells (HCT116 and HT29) alone or co-cultured with macrophages (PMA-treated THP-1 macrophages or TAMs) was determined by the colony formation, wound healing assay and transwell coculture system, respectively. Representative photographs of migratory or invaded cells (magnification, × 200) are shown; Error bars, SD. **P < 0.01; ***P < 0.001
Fig. 3
Fig. 3
IL6 is required for TAMs-induced EMT of CRC cells. (a) Relative expression levels of representative EMT/inflammation related-cytokines were detected in TAMs co-cultured with HCT116 as determined by RT-PCR; Error bars, SEM. (b) ELISA assay of IL6 protein secretion of CRC cells (HCT116 and HT29) and various macrophages; Error bars, SD. (c) IL6 mRNA expression in HCT116 and TAMs with or without 48 h of coculture. Error bars, SEM. (d) Expression of EMT markers E-cadherin and Vimentin in CRC cells (HCT116 and HT29) alone, IL6-supplemented CRC cells, TAMs-co-cultured CRC cells, and IL6 depleted TAMs-co-cultured CRC cells were analyzed by Western blot. (e) Colony formation assay was used to quantify the number of spheres of IL6 depleted TAMs-co-cultured CRC cells (HCT116 and HT29) and its control; Error bars, SD. (f) Migration of IL6 depleted TAMs-co-cultured CRC cells (HCT116 and HT29) and its control was measured by wound-healing assay. Error bars, SD. (g) Invasion of IL6 depleted TAMs-co-cultured CRC cells (HCT116 and HT29) and its control was measured by transwell (magnification, × 200); Error bars, SD. ***P < 0.001
Fig. 4
Fig. 4
STAT3/FoxQ1 contributes to TAMs-induced EMT and macrophages attraction. (a) Western blot analysis of CRC cells (HCT116 and HT29) alone, IL6-supplemented CRC cells, TAMs-co-cultured CRC cells, and IL6 depleted TAMs-co-cultured CRC cells. (b) Western blot analysis of HCT116 cells alone, IL6-supplemented HCT116, TAMs-co-cultured HCT116 in the presence or absence of Stattic (15 μM). (c) Relative expression levels of representative EMT related factors were detected in HCT116 with or without 48 h of TAMs co-culture as determined by RT-PCR. Error bars, SEM. (d) Western blot of FoxQ1 from whole-cell lysates extracted from CRC cells (HCT116 and HT29) co-cultured with TAMs for the indicated times. (e) Western blot of colorectal cancer cells (HCT116 and HT29) transfected with FoxQ1 expression vector or empty vector and indicated siRNAs (si-STAT3) and incubated with IL6 for 48 h afterwards. (f) Western blot of CRC cells (HCT116 and HT29) transfected with STAT3 expression vector or empty vector and indicated siRNAs (si-FoxQ1). (g) CCL2 mRNA expression in CRC cells (HCT116 and HT29) with or without 48 h of TAMs co-culture; Error bars, SD. (h) ELISA assay of CCL2 protein secretion of CRC cells (HCT116 and HT29) transfected with FoxQ1 expression vector or empty vector. Error bars, SD. (i) THP-1 cells migration towards CRC cells (HCT116 and HT29) alone and TAMs-co-cultured CRC cells with or without anti-CCL2 Ab; Error bars, SD. ***P < 0.001
Fig. 5
Fig. 5
STAT3 activation downregulates miR-506-3p expression. (a) Overexpression of STAT3 didn’t cause an increase in FoxQ1 promoter luciferase activity in HCT116 cells. (b) Three independent miRNA target databases were used to predict the potential miRNAs. (c) Relative expression levels of representative nine potential miRNAs were detected in HCT116 transfected with STAT3 expression vector or empty vector as determined by RT-PCR. Error bars, SEM. (d) CRC cells (HCT116 and HT29) were infected with indicated siRNAs (si-STAT3) and treated with IL6 (50 ng/ml) or control for 48 h, and expression of miR-506-3p was examined using RT-PCR; Error bars, SEM. (e) Serially truncated and mutated miR-506-3p promoter constructs were cloned to pGL3-Basic luciferase reporters and transfected into HCT116 cells. The relative luciferase activities were determined after IL6 (50 ng/ml) treatment for 1 h; Error bars, SD. (f) Selective mutation analyses identified STAT3-responsive regions in the miR-506-3p promoter in HCT116 cells; Error bars, SD. (g) ChIP assay demonstrated the direct binding of STAT3 to the miR-506-3p promoter, including nonspecific control (N.C), CHIP1, and CHIP2 in HCT116 cells. Input, 5% of total lysate. (h) RT-PCR of the ChIP products confirmed the direct binding capacity of STAT3 to the miR-506-3p promoter in HCT116 cells. Input, 5% of total lysate; Error bars, SD. ns, not significant; *P < 0.05; **P < 0.01; ***P < 0.001
Fig. 6
Fig. 6
miR-506-3p downregulated FoxQ1 expression by directly binding its 3′UTR, and miR-506-3p/FoxQ1 is essential for STAT3-mediated CRC cell growth, migration, and invasion. (a) Western blot for FoxQ1 in six human CRC cell lines normalized as to expression of GAPDH. (b) RT-PCR results of miR-506-3p in indicated CRC cell lines normalized as to expression of U6; Error bars, SD. (c) Negative correlation between levels of FoxQ1 and miR-506-3p in CRC cell lines(r = 0.82). (d) Schematic representation of the FoxQ1 3′UTR. Mutations were generated at the predicted miR-506-3p–binding sites. (e) Luciferase assays demonstrated that expression of FoxQ1 3′UTR (WT or mutant form) by HEK293T cells transfected with miR-506-3p mimics or with control mimics. Error bars, SD. (f) Luciferase assays demonstrated that expression of FoxQ1 3′UTR (WT or mutant forms) by HEK293T cells transfected with miR-506-3p inhibitor or with control inhibitor. Error bars, SD. (G) CRC cells (HCT116 and HT29) were transfected with miR-506-3p mimics or inhibitor at a final concentration of 100 and 200 nmol/L, respectively. The levels of FoxQ1 mRNA were analyzed by RT-PCR at 48 h post transfection; Error bars, SEM. (h) Levels of FoxQ1 protein were analyzed by Western blot at 72 h post transfection. (i) The levels of E-cadherin and Vimentin were analyzed by Western blot at 48 h post miR-506-3p mimics transfection with or without TAMs co-culture. (j) HCT116 cells transfected with miR-506-3p mimics alone or in combination with FoxQ1 and their proliferation were analyzed by colony formation assays. Error bars, SD. (k) HCT116 cells transfected with miR-506-3p mimics alone or in combination with FoxQ1 were subjected to transwell migration and invasion assays. (magnification, × 200). Error bars, SD. (l) HCT116 cells transfected with STAT3 siRNA or with control siRNA alone or in combination with miR-506-3p inhibitor or FoxQ1 were subjected to colony formation assays. Error bars, SD. (m) HCT116 cells transfected with STAT3 siRNA or with control siRNA alone or in combination with miR-506-3p inhibitor or FoxQ1 were subjected to transwell migration and invasion assays. (magnification, × 200). Error bars, SD. *P < 0.05; **P < 0.01; ***P < 0.001
Fig. 7
Fig. 7
TAMs enhanced CRC tumorigenesis and metastasis in vivo. (a) The morphological characteristics of tumor xenograft, tumor size and tumor weight in the HCT116 alone, HCT116 + TAM/si-con and HCT116 + TAM/si-IL6 groups. Error bars, SD. (b) The relative expression of FoxQ1, CD163, IL6, E-cadherin and Vimentin mRNA of tumors from the HCT116 alone, HCT116 + TAM/si-con and HCT116 + TAM/si-IL6 groups; Error bars, SD. (c) IHC analyzed the expression of FoxQ1, CD163, IL6, E-cadherin and Vimentin protein of tumors from the HCT116 alone, HCT116 + TAM/si-con and HCT116 + TAM/si-IL6 groups; Scale bar, 200×. (d) IHC analyzed Ki67 expression in tumor from the HCT116 alone, HCT116 + TAM/si-con and HCT116 + TAM/si-IL6 groups; Scale bar, 200×. (e) Representative CTC images from two mice, respectively. Scale bar, 20 μm. (f) The MCTC ratio of mice blood from the HCT116 alone, HCT116 + TAM/si-con and HCT116 + TAM/si-IL6 groups. (g) Representative images of metastatic lesions in the liver from mice in the HCT116 + TAM/si-con groups at 30 days after implantation, and representative hematoxylin and eosin–stained sections of metastatic nodules in liver and lung are shown. Scale bar, 200×. (h) Percentage of mice with metastasis is indicated from HCT116 alone, HCT116 + TAM/si-con and HCT116 + TAM/si-IL6 groups (n = 6 per group). (i) Weight of nude mice was monitored every 5 days after being injected with HCT116 alone, HCT116 + TAM/si-con and HCT116 + TAM/si-IL6 via the tail veins; (j) Schematic illustration of the crosstalk between TAMs and cancer cells in the tumor microenvironment. Our study illustrated a crosstalk between TAMs and cancer cells in the CRC microenvironment. IL6, secreted by TAMs, binds to the IL6 receptor (IL6R) on the cancer cell surface to phosphorylate STAT3. pSTAT3 is translocated to the nucleus to regulate expression of a number of miRNAs, including miR-506-3p, which facilitates the EMT program to mediate MCTC generation, thereby enhancing the migration, invasion, and metastatic potential of CRC cells through miR-506-3p/FoxQ1 axis. In a positive feedback loop, FoxQ1 promoted the secretion of CCL2 from TAMs-educated CRC cells, which increase the recruitment of macrophages. Error bars, SD. *P < 0.05; **P < 0.01; ***P < 0.001

References

    1. Siegel RL, Miller KD, Jemal A. Cancer statistics, 2015. Ca A Cancer Journal for Clinicians. 2015;65:5–29. doi: 10.3322/caac.21254. - DOI - PubMed
    1. Pantel K, Brakenhoff RH. Dissecting the metastatic cascade. Nat Rev Cancer. 2004;4:448–456. doi: 10.1038/nrc1370. - DOI - PubMed
    1. Au SH, Storey BD, Moore JC, Tang Q, Chen YL, Javaid S, Sarioglu AF, Sullivan R, Madden MW, O'Keefe R. Clusters of circulating tumor cells traverse capillary-sized vessels. Proc Natl Acad Sci U S A. 2016;113:4947. doi: 10.1073/pnas.1524448113. - DOI - PMC - PubMed
    1. Yang C, Zhang N, Wang S, Shi D, Zhang C, Liu K, Xiong B. Wedge-shaped microfluidic chip for circulating tumor cells isolation and its clinical significance in gastric cancer. J Transl Med. 2018;16:139. doi: 10.1186/s12967-018-1521-8. - DOI - PMC - PubMed
    1. Wang S, Zhang C, Wang G, Cheng B, Wang Y, Chen F, Chen Y, Feng M, Xiong B. Aptamer-mediated transparent-biocompatible nanostructured surfaces for hepotocellular circulating tumor cells enrichment. Theranostics. 2016;6:1877. doi: 10.7150/thno.15284. - DOI - PMC - PubMed

Publication types

MeSH terms

Substances