. 2019 May 16;74(4):674-687.e11.
doi: 10.1016/j.molcel.2019.02.031. Epub 2019 Mar 27.

MYC Recruits SPT5 to RNA Polymerase II to Promote Processive Transcription Elongation

Affiliations

MYC Recruits SPT5 to RNA Polymerase II to Promote Processive Transcription Elongation

Apoorva Baluapuri et al. Mol Cell. .

Abstract

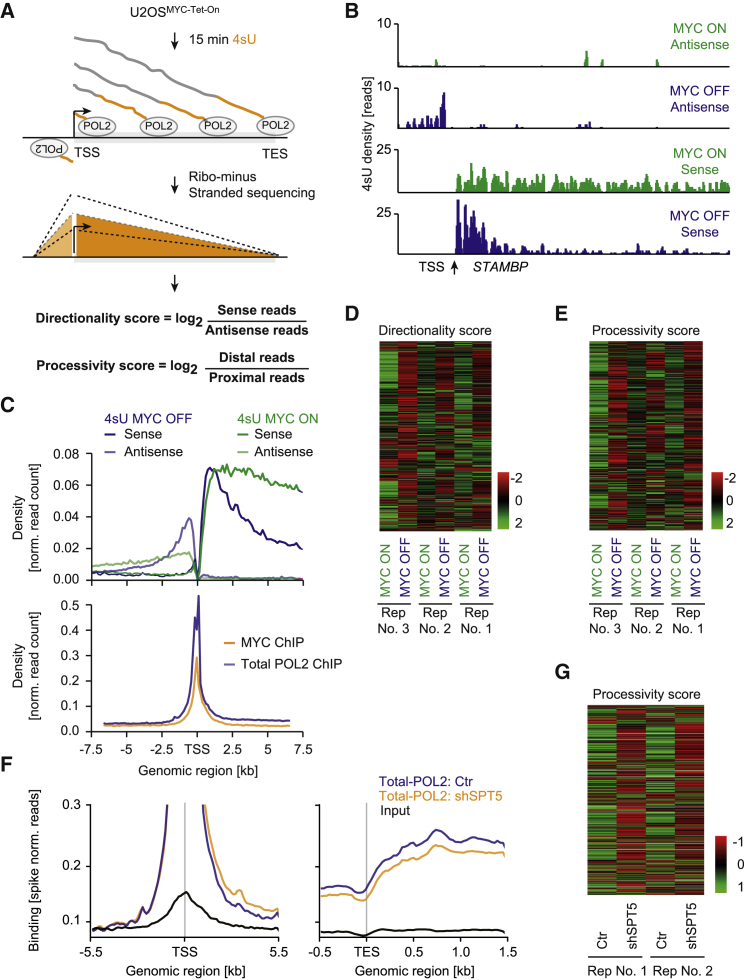
The MYC oncoprotein binds to promoter-proximal regions of virtually all transcribed genes and enhances RNA polymerase II (Pol II) function, but its precise mode of action is poorly understood. Using mass spectrometry of both MYC and Pol II complexes, we show here that MYC controls the assembly of Pol II with a small set of transcription elongation factors that includes SPT5, a subunit of the elongation factor DSIF. MYC directly binds SPT5, recruits SPT5 to promoters, and enables the CDK7-dependent transfer of SPT5 onto Pol II. Consistent with known functions of SPT5, MYC is required for fast and processive transcription elongation. Intriguingly, the high levels of MYC that are expressed in tumors sequester SPT5 into non-functional complexes, thereby decreasing the expression of growth-suppressive genes. Altogether, these results argue that MYC controls the productive assembly of processive Pol II elongation complexes and provide insight into how oncogenic levels of MYC permit uncontrolled cellular growth.

Keywords: MYC; RNA polymerase II; SPT5; SPT6; SUPT5H; directionality; elongation rate; processivity; transcription; tumorigenesis.


Figures

None
Graphical abstract
Figure 1
Figure 1
MYC Mediates Changes in Pol II Complex Composition (A) Graphic displaying the method used to identify Pol II-associated proteins. T-lymphomaMYC-Tet-Off cells were stably transfected either with a lentiviral vector expressing HA-tagged RPB3 or an empty lentiviral vector. Cells were harvested, nuclei were isolated, nuclear membranes were lysed, and chromatin-associated proteins were solubilized and used as input for HA-directed immunoprecipitation (IP). Eluted fraction was used in label-free quantitative mass spectrometry (qMS). (B) Volcano plot of the Pol II interactome with transcription elongation factors marked in orange. The x axis displays the enrichment (log2FC) of proteins in HA-RPB3-expressing cells compared to control cells (Ctr). The y axis shows the significance (p value) of enrichment calculated from five biological replicate experiments. (C) Volcano plot showing proteins changing their association with Pol II in response to MYC depletion in T-lymphomaMYC-Tet-Off cells. The x axis displays the enrichment of proteins (log2FC) between cells expressing (ON) and depleted of (OFF) MYC. Positive values indicate the protein requires MYC to associate with Pol II (e.g., TCEA3 or SPT5). The y axis shows the significance (p value) of enrichment calculated from four biological replicate experiments. Pol II-interacting proteins are shown as orange circles whose size indicates overall enrichment. The insert shows an immunoblot of MYC in T-lymphomaMYC-Tet-Off cells treated with doxycycline (MYC OFF) or ethanol (MYC ON, Vinculin: loading control). (D) Enrichment-values (FC) for SPT5 in the Pol II interactome in the absence and presence of MYC in the four experiments used for the analysis shown in (C). See also Figure S1.
Figure 2
Figure 2
MYC-Dependent Recruitment of SPT5 to Pol II on Chromatin (A and B) Immunoblot showing the solubility of MYC in lysed T-lymphomaMYC-Tet-Off cells in low-salt buffer (A) and in an optimized extraction buffer with benzonase (B) (Vinculin: loading control). (C) Volcano plot of the MYC interactome with uncharacterized interaction partners in orange. The x axis displays the enrichment (log2FC) of proteins in HA-MYC-expressing cells compared to control cells. The y axis shows the significance (p value) of enrichment calculated from three biological replicate experiments. (D) Venn diagram depicting the intersection between the Pol II interactome (Figure 1B) and the MYC interactome. (E) Enrichment values (normalized intensity) for SPT5 in the MYC interactome in three experiments (Ctr: control cells not expressing HA-MYC). (F) Immunoblot of MYC in U2OSMYC-Tet-On cells showing endogenous levels, depletion of MYC by siRNA (MYC OFF), and restoration of physiological levels (MYC ON) in cells treated with doxycycline (Dox, Vinculin: loading control). (G) Immunofluorescence images of proximity ligation assays (PLAs) between pS2-Pol II and SPT5 in the absence (MYC OFF, siMYC) and presence (MYC ON, siCtr) of MYC in U2OSMYC-Tet-On and HMLE cells (yellow dots: intensity centers of proximity pairs; blue: Hoechst stained nuclei; magenta: Phalloidin staining; scale bar: 5 μm). (H) Quantitative analysis of PLAs between pS2-Pol II and SPT5 shown in (G). (I) Genome browser pictures of the NPM1 gene. SPT5 ChIP-RX sequencing experiments were performed in the presence (green) and absence (blue) of MYC (input: black) in U2OS cells. Data for MYC binding (orange) was re-analyzed from a published dataset (Lorenzin et al., 2016). (J) Density plot demonstrating the loss of SPT5 on chromatin in the absence of MYC at single gene level. Each white dot represents a single gene value, which is overlaid on a color gradient indicating the density (SPT5 ChIP-RX sequencing experiments as shown in I). The y axis displays the change of SPT5 binding between the presence and absence of MYC (log2FC), and the x axis depicts overall SPT5 binding normalized to gene length (TSS, transcriptional start site; TES, transcriptional end site; norm. normalized). See also Figure S2.
Figure 3
Figure 3
MYC Recruits SPT5 by Binding to its N-terminal Region (A) Immunoblots of endogenous SPT5 IP from HEK293 cells and co-precipitated MYC. Beads coupled to non-specific IgG were used as control. (B) Immunofluorescence images from PLAs. FLAG-SPT5 and HA-MYC were stably co-expressed in U2OS cells by lentiviral transduction, and cells expressing only one protein were used as controls. Proximity between MYC and SPT5 was analyzed with anti-FLAG and anti-HA antibodies (yellow dots: intensity centers of proximity pairs; blue: Hoechst-stained nuclei; magenta: Phalloidin staining; scale bar: 5 μm). (C) Immunoblots of IP experiments. FLAG-SPT5 and HA-MYC were overexpressed by transient transfection in HEK293 cells. FLAG-SPT5 was precipitated and co-precipitating HA-MYC was analyzed by immunoblotting. Cells not expressing FLAG-SPT5 or beads coupled to non-specific IgG were used as controls ( indicates the antibody heavy chain). (D) Immunoblots of IP experiments. FLAG-SPT5, HA-MYC (WT), and an HA-tagged N-terminal deletion mutant of MYC144–439 (MUT) were overexpressed by transient transfection in HEK293 cells. HA-MYC was precipitated and co-precipitating FLAG-SPT5 was analyzed by immunoblotting. Cells not expressing HA-MYC were used as controls. (E) Scheme of FLAG-tagged SPT5 deletion mutants (K: KOW domain; CTR: C-terminal repeat region). (F) Immunoblots of IP experiments. HA-MYC, FLAG-SPT5, and FLAG-tagged deletion mutants of SPT5 shown in (E) were overexpressed by transient transfection in HEK293 cells. HA-MYC was precipitated and co-precipitating FLAG-SPT5 was detected by immunoblotting. Cells not expressing HA-MYC were used as controls ( indicates signal from IgG chains). (G) Recombinant proteins from pull-down assays visualized by silver staining and immunoblotting. SPT5 (together with SPT4), GST-Myc1–163, and GST were isolated from E. coli (left, silver staining). GST or GST-Myc1–163 were coupled to sepharose and incubated with SPT5. Input and eluted proteins were visualized with antibodies detecting GST or SPT5 (right, immunoblot). See also Figure S3.
Figure 4
Figure 4
CDK7 Activity Is Required for Transfer of SPT5 from MYC to Pol II (A and B) Immunofluorescence images of PLAs between SPT5 and MYC (A) or SPT5 and total Pol II (B) in cells treated with CDK inhibitors (DRB, THZ1, LDC4297, LDC067) or DMSO vehicle. (C) Quantification of PLAs shown in (A). The number of proximity pairs upon inhibitor treatment was quantified in independent experiments and normalized to the DMSO condition. (D) Quantification of PLAs shown in (B). The number of proximity pairs upon inhibitor treatment was quantified in independent experiments and normalized to the DMSO condition. (E) Immunoblots of endogenous SPT5 precipitated from HEK293 cells treated with LDC4297 or DMSO. Co-precipitated total Pol II and SPT4 were analyzed by immunoblotting. Beads coupled to non-specific IgG were used as controls. (F) Immunoblots of immunoprecipitation experiments. FLAG-SPT5 and HA-MYC were overexpressed by transient transfection in HEK293 cells. HA-MYC was immunoprecipitated and incubated with recombinant CDK7, and co-precipitating FLAG-SPT5 was analyzed by immunoblotting. Cells not expressing HA-MYC were used as control. (G) Immunoblot of TFIIEβ depleted cells. U2OS cells were treated with an siRNA against TFIIEβ or a non-targeting control (Vinculin: loading control). (H and I) Immunofluorescence images (H) and quantification (I) of PLAs between SPT5 and total Pol II. U2OS cells were treated with LDC4297 or an siRNA against CDK7 after depletion of TFIIEβ and in control cells. The number of proximity pairs was quantified and its change in TFIIE-depleted cells to control cells was calculated as fold change (FC). For (A), (B), and (H): yellow dots: intensity centers of proximity pairs; blue: Hoechst stained nuclei; magenta: Phalloidin staining; scale bar: 5 μm. See also Figure S4.
Figure 5
Figure 5
MYC-Mediated Transfer of SPT5 Is Required to Maintain Pol II Processivity (A) Schematic of 4sU sequencing. Nascent transcripts were labeled with 4sU in U2OSMYC-Tet-On cells, converted into strand-specific cDNA and sequenced. Directionality scores were calculated by dividing reads from TSS-TES by TSS-1.5 kb gene regions for all transcribed genes in U2OS cells in the absence and presence of MYC. Processivity scores were calculated by dividing distal (5–7 kb after TSS) by proximal (1-2 kb after TSS) reads. (B) Genome browser pictures of nascent RNA. Example of 4sU signal at the STAMBP gene from U2OS cells in the presence and absence of MYC. (C) Average read density of 4sU sequencing experiments (upper panel) in U2OS cells in the absence and presence of MYC. Curves show the spatial distribution of reads independently aligned to sense and antisense strands within 7.5 kb of the TSS for genes longer than 8 kb. Comparison to MYC and Pol II binding in the same region originating from ChIP-sequencing data (lower panel) is shown as average read density (Walz et al., 2014). (D) Heatmap with normalized directionality scores for three replicates calculated in the presence and absence of MYC. Negative values indicate reduced promoter directionality. (E) Heatmap with normalized processivity scores for three replicates calculated in the absence and presence of MYC. Negative values indicate reduced Pol II processivity. (F) Average read density of Pol II ChIP-sequencing experiments around transcriptional start sites (TSS, left) and transcriptional end sites (TES, right). ChIP-RX sequencing was performed with antibodies precipitating total Pol II in U2OS cells depleted of SPT5 by doxycycline-induced shRNA (orange) and control cells (blue; black line: input). (G) Heatmap of normalized processivity scores for two replicates of total Pol II ChIP sequencing in the absence (shSPT5) and presence (Ctr) of SPT5. See also Figure S5.
Figure 6
Figure 6
MYC Is Required to Globally Maintain High Transcription Elongation Rates (A) Schematic of 4sU-DRB sequencing. U2OSMYC-Tet-On cells were treated with DRB to inhibit Pol II molecules from starting transcriptional elongation. DRB was washed out, and nascent transcripts were labeled with 4sU, isolated, converted into cDNA, and sequenced. (B) Genome browser pictures of the FBXW11 gene in a 4sU-DRB sequencing experiment. The wave front indicates the location of Pol II 10 min after release from DRB inhibition in the presence (57 kb) and absence (36 kb) of MYC. (C) Density profile of 4sU-DRB sequencing reads for 3,732 genes (50–100 kb long) 10 min after DRB release. The reads were aligned to each TSS and averaged. (D) Heatmaps of normalized 4sU reads (10 min after DRB release) in the absence and presence of MYC sorted for elongation rates. (E) Pol II elongation rates in the presence and absence of MYC measured at a 10 min release time point. (F) Scatterplot analyzing the correlation between MYC-mediated changes in Pol II directionality and processivity. Mean values of bins containing an equal number of genes are shown. The x axis displays the change in promoter directionality by comparing the directionality score (log2FC) in the presence and absence of MYC (MYC ON, MYC OFF) based on 4sU sequencing experiments. The y axis depicts the change in the processivity score. (G) Scatterplot of the correlation between MYC-mediated changes in Pol II elongation rates (y axis) and in gene regulation (x axis) in 4sU-DRB-sequencing experiments. Mean values of bins containing an equal number of genes are shown (r: correlation coefficient). See also Figure S6.
Figure 7
Figure 7
Oncogenic MYC Levels Sequester SPT5 away from Pol II (A) Immunoblot of U2OSMYC-Tet-On cells depleted of MYC (MYC OFF: siMYC), in the “MYC ON” condition (siMYC, doxycycline) with oncogenic levels (MYC-HIGH: doxycycline) and untreated to show endogenous levels (Endo.). (B) Pol II elongation rates in the absence (OFF) and presence of MYC (ON) and at oncogenic MYC levels (HIGH). (C and D) Immunofluorescence images of PLAs between MYC and SPT5 (C) and pS2-Pol II and SPT5 (D) in U2OSMYC-Tet-On cells at normal and oncogenic levels of MYC. (E) Metagene analysis of SPT5 ChIP-RX-sequencing experiments in U2OSMYC-Tet-On cells at normal (green) and oncogenic (red) levels of MYC (Input: black; norm., normalized; TSS, transcriptional start site; TES, transcriptional end site). (F) Immunofluorescence images of PLAs between pS2-Pol II and SPT6 in U2OSMYC-Tet-On cells at normal and oncogenic levels of MYC. (G) Gene set enrichment analyses of gene-expression profiles from different types of tumors using a set of genes with low directionality scores in high MYC conditions (n = 300) and comparing high- and low-grade tumors. (NES, normalized enrichment score). A positive NES value indicates activation of the respective gene set in low-grade tumors. (H) Normalized gene expression of 300 genes with low directionality scores in high MYC in tumors of different medulloblastoma types (top) and neuroblastoma stages (bottom). (I) Kaplan-Meier survival curves for patients with medulloblastoma (top) and neuroblastoma (bottom), stratified by the expression of 300 genes with the lowest directionality score in high MYC. (J) Model of MYC function during transcriptional elongation: in growing cells (middle), MYC binds SPT5, recruits it to promoters and transfers it to the transcriptional machinery before transcription elongation. As a consequence, SPT5-loaded Pol II produces full-length transcripts via fast, processive, and directional transcription. In resting cells (left), SPT5 is insufficiently recruited and Pol II loses directionality and processivity, resulting in an increase of antisense and abortive transcripts. In cancer cells with high MYC levels (right), a significant fraction of SPT5 is sequestered by soluble MYC and, as a consequence, transcription is reduced at genes that belong to known MYC-repressed genes. For (C), (D), and (F): yellow dots: intensity centers of proximity pairs; blue: Hoechst stained nuclei; magenta: Phalloidin staining; scale bar: 5 μm. See also Figure S7.

References

    1. Adelman K., Lis J.T. Promoter-proximal pausing of RNA polymerase II: emerging roles in metazoans. Nat. Rev. Genet. 2012;13:720–731. - PMC - PubMed
    1. Albert T.K., Rigault C., Eickhoff J., Baumgart K., Antrecht C., Klebl B., Mittler G., Meisterernst M. Characterization of molecular and cellular functions of the cyclin-dependent kinase CDK9 using a novel specific inhibitor. Br. J. Pharmacol. 2014;171:55–68. - PMC - PubMed
    1. Ardehali M.B., Yao J., Adelman K., Fuda N.J., Petesch S.J., Webb W.W., Lis J.T. Spt6 enhances the elongation rate of RNA polymerase II in vivo. EMBO J. 2009;28:1067–1077. - PMC - PubMed
    1. Aygün O., Svejstrup J., Liu Y. A RECQ5-RNA polymerase II association identified by targeted proteomic analysis of human chromatin. Proc. Natl. Acad. Sci. USA. 2008;105:8580–8584. - PMC - PubMed
    1. Bernecky C., Plitzko J.M., Cramer P. Structure of a transcribing RNA polymerase II-DSIF complex reveals a multidentate DNA-RNA clamp. Nat. Struct. Mol. Biol. 2017;24:809–815. - PubMed

Publication types

MeSH terms