. 2019 Jul;16(7):865-878.
doi: 10.1080/15476286.2019.1600934. Epub 2019 Apr 19.

Systematic evaluation of the microRNAome through miR-CATCHv2.0 identifies positive and negative regulators of BRAF-X1 mRNA

Affiliations

Systematic evaluation of the microRNAome through miR-CATCHv2.0 identifies positive and negative regulators of BRAF-X1 mRNA

Andrea Marranci et al. RNA Biol. 2019 Jul.

Abstract

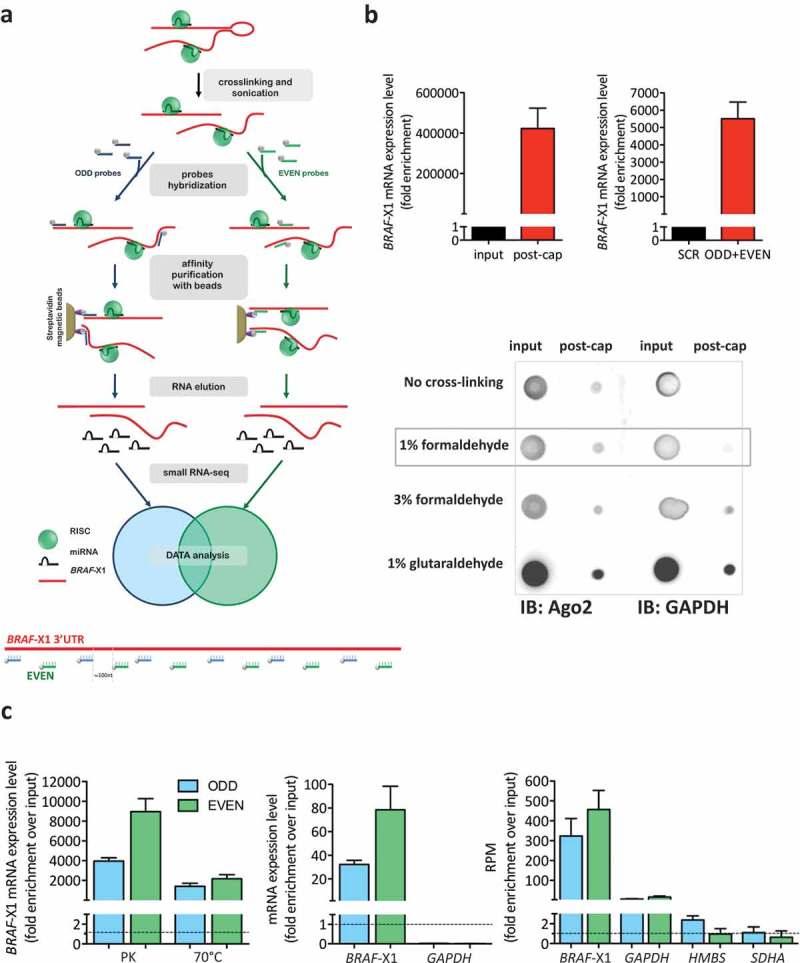
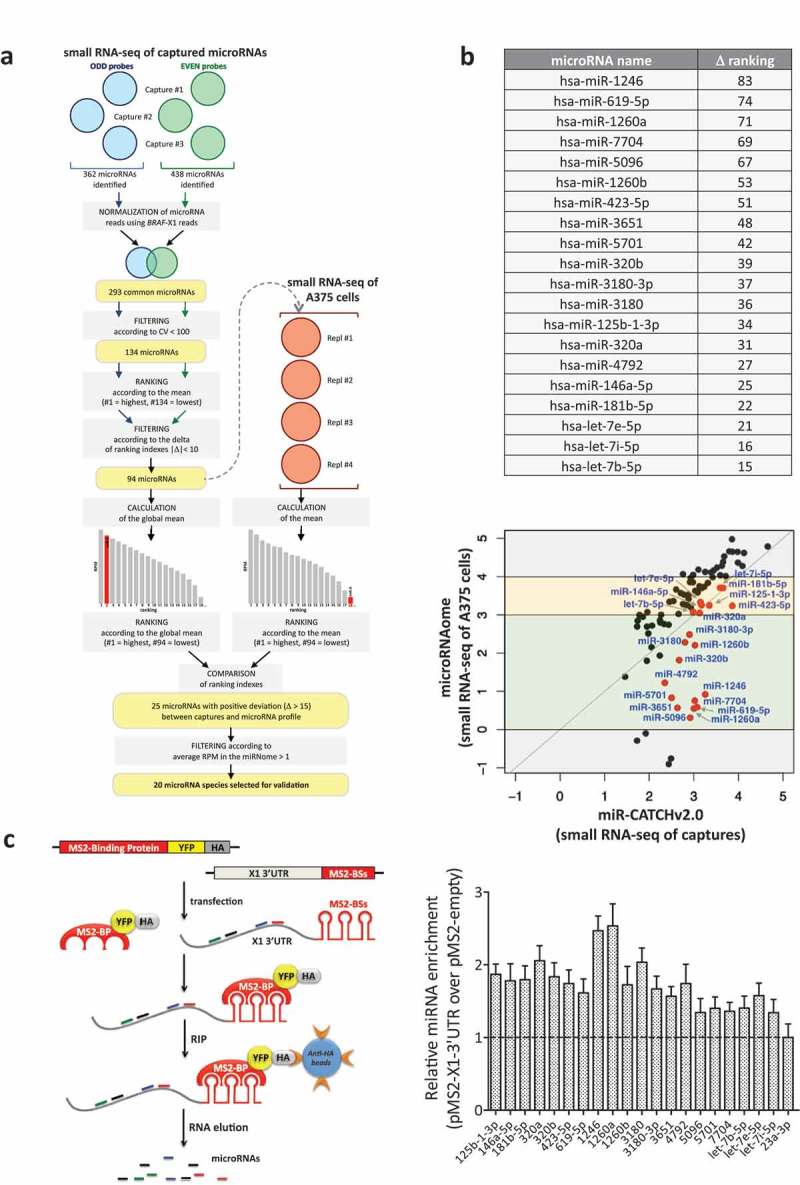
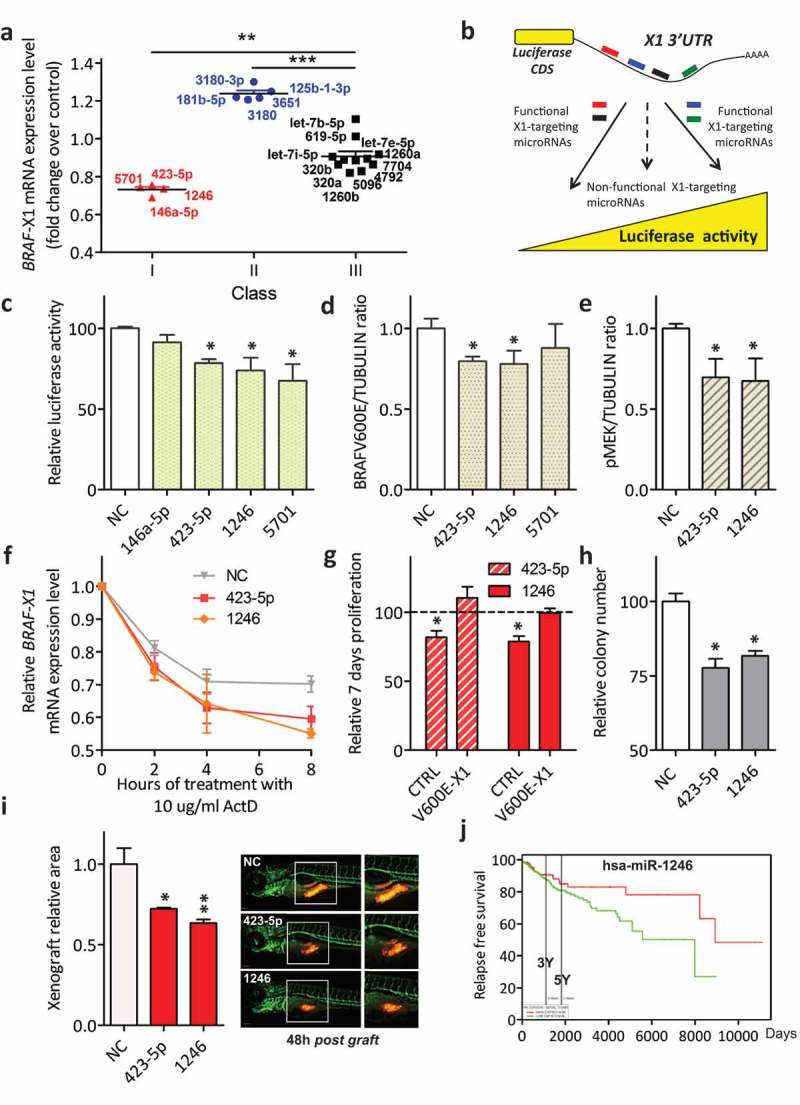
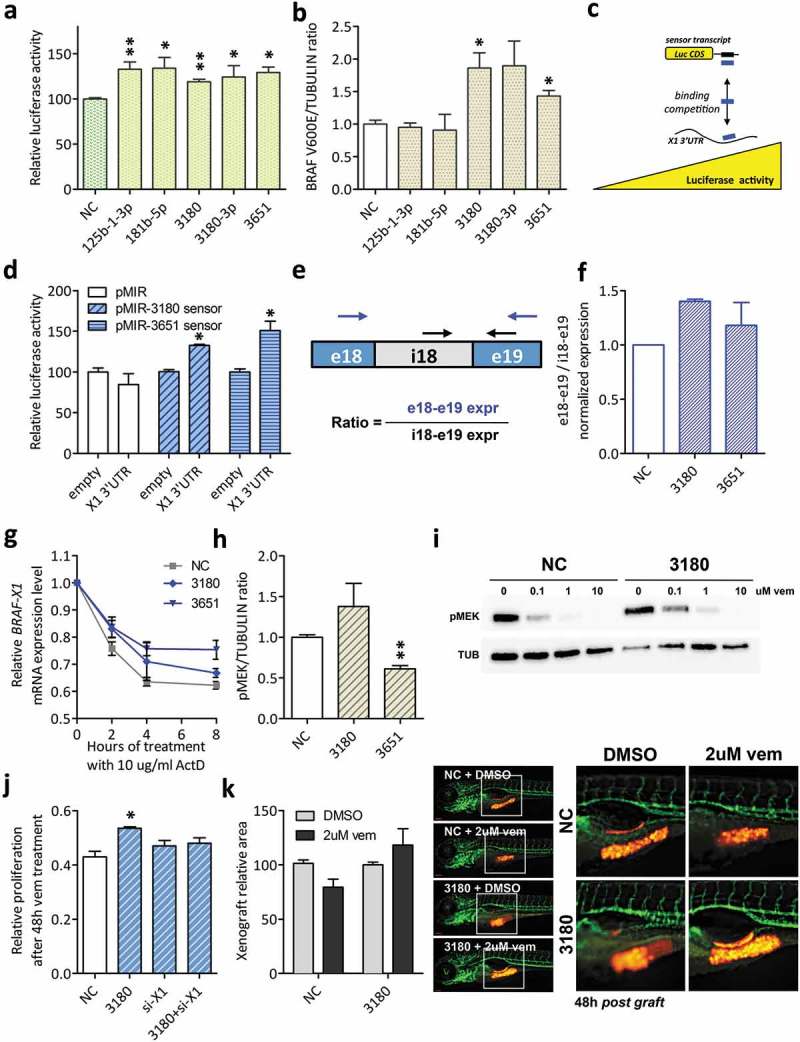
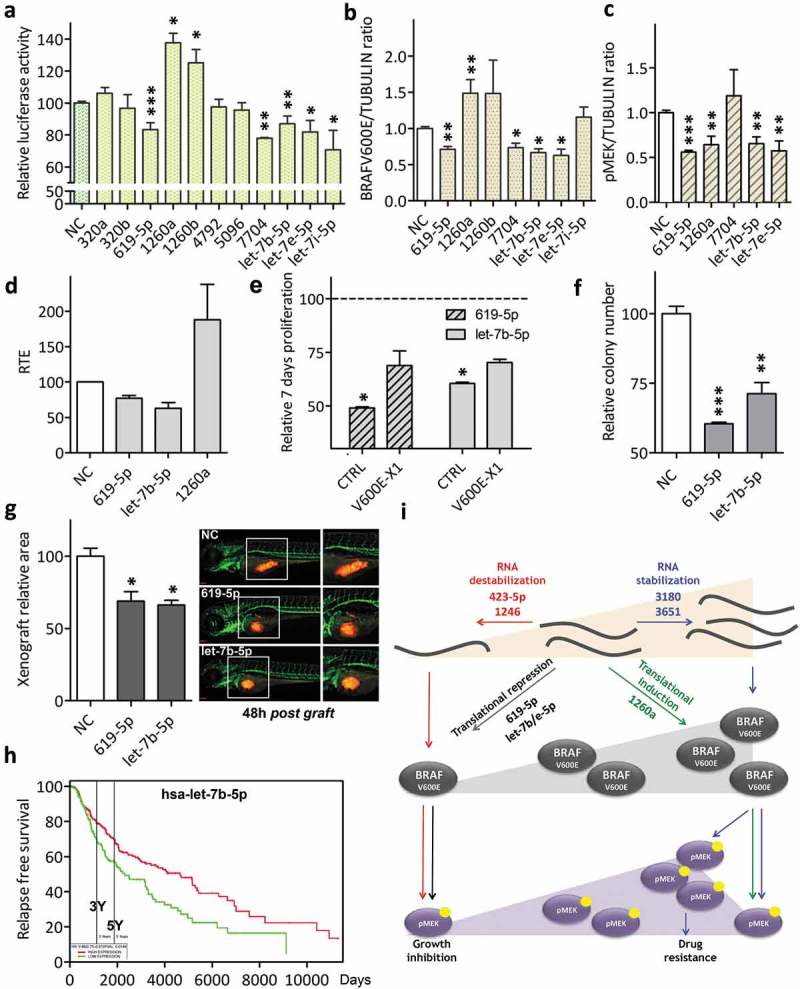
Here we present miR-CATCHv2.0, an implemented experimental method that allows the identification of the microRNA species directly bound to an RNA of interest. After cross-linking of microRNA::RNA::Ago2 complexes using formaldehyde, the RNA is fragmented using sonication and then subjected to affinity purification using two sets of biotinylated tiling probes (ODD and EVEN). Finally, enriched microRNA species are retrieved by means of small RNA sequencing coupled with an ad hoc analytical workflow. In BRAFV600E mutant A375 melanoma cells, miR-CATCHv2.0 allowed us to identify 20 microRNAs that target X1, the most abundant isoform of BRAF mRNA. These microRNAs fall into different functional classes, according to the effect that they exert (decrease/increase in BRAFV600E mRNA and protein levels) and to the mechanism they use to achieve it (destabilization/stabilization of X1 mRNA or decrease/increase in its translation). microRNA-induced variations in BRAFV600E protein levels are most of the times coupled to consistent variations in pMEK levels, in melanoma cell proliferation in vitro and in sensitivity to the BRAF inhibitor vemurafenib in a xenograft model in zebrafish. However, microRNAs exist that uncouple the degree of activation of the ERK pathway from the levels of BRAFV600E protein. Our study proposes miR-CATCHv2.0 as an effective tool for the identification of direct microRNA-target interactions and, by using such a tool, unveils the complexity of the post-transcriptional regulation to which BRAFV600E and the ERK pathway are subjected in melanoma cells.

Keywords: -X1 mRNA; Direct microRNA-target binding; ERK signalling; affinity purification; melanoma; transcript stability; transcript translation.


Figures

Figure 1.
Figure 1.
Optimization of miR-CATCHv2.0 experimental method. (a). (upper) Workflow of miR-CATCHv2.0. Cells are cross-linked and sonicated. Two independent sets of biotinylated tiling probes (ODD probes and EVEN probes) are hybridized to the target mRNA (BRAF-X1 3ʹUTR). microRNA::mRNA::Ago2 complexes are then purified using magnetic streptavidin beads. After stringent washes, RNA is eluted using proteinase K and subjected to small RNA-seq. (lower) Design of antisense biotinylated tiling probes. The probes are located approximately 100nt apart along BRAF-X1 3ʹUTR and are grouped into ‘ODD’ and ‘EVEN’ sets based on their position. (b). (upper) The capture performed with tiling probes allows to obtain a strong enrichment in BRAF-X1 compared to un-captured samples (input, left) or a scrambled probe (SCR, right). (lower) Effects of different cross-linking reagents on the purification of Ago2. After cross-linking with the indicated reagents, cells were subjected to sonication (12 rounds on cells cross-linked with 1% formaldehyde, 18 rounds on cells cross-linked with 3% formaldehyde, 18 rounds on cells cross-linked with 1% glutaraldehyde). Immunoblot assay shows that cross-linking performed with 1% formaldehyde allows effective Ago2 purification with the lowest background (measured as GAPDH purification). (c). (left) The release of BRAF-X1 mRNA from cross-linked proteins is more effective when treatment with proteinase K (PK) is used rather than heating at 70°C. (middle, right). Both the ODD and the EVEN pools of probes can capture BRAF-X1 mRNA, as measured by qRT-PCR (middle) and by counting the reads belonging to BRAF-X1 in the small RNA-seq (right). The levels of the unrelated GAPDH, HMBS and SDHA mRNAs are measured to show that the capture is selective for the intended mRNA.The graphs in this figure represent the mean ± SEM of three independent experiments.
Figure 2.
Figure 2.
Identification of X1-binding microRNAs from small RNA-seq data. (a). Description of the analytical steps followed in order to select the microRNAs to be validated (see text for details). (b). (upper) List of the 20 selected microRNAs, ordered by difference in ranking index between the small RNA-seq of A375 cells and the small RNA-seq of captured microRNAs (see column N in Supplementary Table S3). (lower) Expression levels (log10(RPM mean)) of the 94 microRNAs in the small RNA-seq of the captures (X axis) and of A375 cells (Y axis). As indicated by the red dots, which represent the 20 selected microRNAs, overall our analytical approach prioritizes for experimental analysis the microRNA species that have intermediate expression levels in A375 cells (yellow and green middle boxes), while it discards those that are expressed at very high or very low levels (top and bottom grey boxes, respectively). (c). (left) Cartoon describing the MS2-tagged RNA affinity purification (MS2-TRAP) assay (modified from [24]). This assay is based on the use of two plasmids. The pMS2-X1-3ʹUTR plasmid (right) expresses 12 copies of the MS2 binding site (BS), which is characterized by a defined secondary structure; furthermore, the presence of a multiple cloning site upstream of the MS2-BSs allows the insertion and co-expression of BRAF-X1 3ʹUTR. The other plasmid is called pMS2-BP (left) and expresses the MS2-Binding Protein (MS2-BP) fused with YFP and the HA-Tag. The MS2-BP, which is able to bind to MS2-BS, can be efficiently immunoprecipitated using the anti-HA antibody. Upon the co-transfection of the two plasmids inside the cells, a ribonucleoproteic complex is formed between the MS2-BP-YFP-HA chimerical protein and the BRAF-X1 3ʹUTR/MS2-BSs, to which endogenous microRNAs are physically bound. Such complex can be immunoprecipitated using anti-HA sepharose beads, so that, upon RNA extraction, the bound microRNAs can be quantified by qRT-PCR. (right) The qRT-PCR detection of the microRNAs identified by miR-CATCHv2.0 was performed on BRAF-X1 3ʹUTR immunoprecipitated using the MS2-TRAP assay. miR-23a-3p, which is depleted in the captures compared to the microRNA profile of A375 cells, is taken as negative control. The graphs in this figure represent the mean ± SEM of three independent experiments.
Figure 3.
Figure 3.
Classification of BRAFV600E-X1-binding microRNAs and functional validation of those that cause a decrease in BRAFV600E-X1 mRNA levels (Class I). (a). The 20 microRNAs identified using miR-CATCHv2.0 were transiently transfected as si-miRNAs into A375 cells and were stratified in three different classes, according to the effect that they elicit on BRAFV600E-X1 mRNA levels 24 h later. Class I microRNAs (red) cause a ≥ 20% decrease in BRAFV600E-X1 mRNA levels compared to si-NC; Class II microRNAs (blue) cause a ≥ 20% increase in BRAFV600E-X1 mRNA levels; Class III microRNAs (black) do not alter BRAFV600E-X1 mRNA levels. (b). Schematic representation of the Luciferase reporter assay. The pMIR-X1-3ʹUTR plasmid, in which the X1 3ʹUTR is cloned downstream of a Luciferase CDS, is transfected in HCT116 Dicer-/- cells together with the appropriate si-miRNAs. If a si-miRNA is functional, a decrease or increase in Luciferase activity is observed. (c). miR-423-5p, miR-1246 and miR-5701 Class I microRNAs are functional because they cause a decrease in Luciferase activity. (d-e). Quantification of BRAFV600E (d) and pMEK (e) protein levels, as detected by immunoblot 48 h after the transfection of si-miR-423-5p, si-miR-1246 and si-miR-5701 in A375 melanoma cells. (f). Real-time PCR quantification of BRAF-X1 mRNA in A375 cells that were first transfected with the indicated siRNAs and 24 h later treated with 10 ug/ml Actinomycin D (ActD) for the indicated number of hours. (g). Effect of the overexpression of miR-423-5p and miR-1246 on the proliferation of A375 melanoma cells and dependency on BRAFV600E-X1. Compared to si-NC, the transfection of si-miR-423-5p and si-miR-1246 causes a decrease in cell proliferation. Such a decrease is abrogated by the concomitant overexpression of the microRNA-insensitive BRAFV600E-X1 CDS, which indicates that it depends on the targeting of this protein. CTRL: A375 cells stably infected with the empty pCW lentiviral vector, transfected with si-miR-619-5p or si-let-7b-5p and induced with 2 ug/ml doxycycline for 48 h. V600E-X1: A375 cells stably infected with pCW-BRAFV600E-X1-CDS lentiviral vector, transfected with si-miR-619-5p or si-let-7b-5p and induced with 2 ug/ml doxycycline for 48 h. The proliferation of A375 cells stably infected with pCW-BRAFV600E-X1-CDS lentiviral vector, transfected with si-NC and induced with 2 ug/ml doxycycline for 48 h did not show a statistically significant difference compared to the proliferation of A375 cells stably infected with the empty pCW lentiviral vector, transfected with si-NC and induced with 2 ug/ml doxycycline for 48 h (which was taken as reference for all the other experimental conditions). (h). Effect of the overexpression of miR-423-5p and miR-1246 on the colony forming ability of A375 melanoma cells. (i). Effect of the overexpression of miR-423-5p and miR-1246 on the growth of A375-mCherry cells xenografted in zebrafish embryos. About 48 h after the transfection with si-miR-423-5p or si-miR-1246, cells were injected in 48 h post fertilization embryos and allowed to grow for an additional 48 h. At the end of this period, the size of the red cell masses was measured. The pictures are taken from 1 out of 3 independent experiments performed, all with comparable outcome. Scale bar: 100 um. The graphs in this figure represent the mean ± SEM of three independent experiments. *p < 0.05, **p < 0.01, ***p < 0.001. (j). In the skin cutaneous melanoma dataset available at TCGA, patients with higher levels of miR-1246 (above the mean, red) show a better relapse free survival than patients with lower levels of miR-1246 (below the mean, green). n = 501. Samples above the mean: 160, 19 events. Samples below the mean: 341, 60 events. p = 0.0499.
Figure 4.
Figure 4.
Functional validation of BRAFV600E-X1-binding microRNAs that cause an increase in BRAFV600E-X1 mRNA levels (Class II). (a). Luciferase assay performed in HCT116 Dicer-/- cells indicates that miR-125b-1-3p, miR-181b-5p, miR-3180, miR-3180-3p and miR-3651 are functional, as they cause an increase in reporter gene activity. (b). Quantification of BRAFV600E protein levels, as detected by immunoblot 48 h after the transfection of si-miR-125b-1-3p, si-miR-181b-5p, si-miR-3180, si-miR-3180-3p and si-miR-3651 in A375 melanoma cells. (c–d). Sensor constructs for miR-3180 and miR-3651. (c). Schematic representation of the use of sensor constructs for X1-binding microRNAs. If the X1 3ʹUTR binds to a given microRNA species, the corresponding sensor transcript is released and an increase in Luciferase activity is observed. Blue rectangle: microRNA under study. Black rectangle: sequence complementary to that of the microRNA, expressed downstream of Luciferase CDS. (d). The sensor constructs for miR-3180 and miR-3651 show an increase in Luciferase activity in the presence of the X1 3ʹUTR, confirming its ability to bind to these microRNAs. (e–f). The ratio between the expression level of exon 18 – exon 19 (taken as measure of mature BRAFV600E-X1 mRNA) and the expression level of intron 18 – exon 19 (taken as measure of BRAFV600E-X1 primary transcript) increases in the presence of si-miR-3180 and si-miR-3651. In (e), the position of the qRT-PCR primer pairs used is indicated by arrows (blue for e18-e19 and black for i18-e19). In (f), the results of real-time PCR analysis performed on A375 cells transfected with the indicated siRNAs are reported. (g). Real-time PCR quantification of BRAF-X1 mRNA in A375 cells that were first transfected with the indicated siRNAs and 24 h later treated with 10 ug/ml Actinomycin D (ActD) for the indicated number of hours. (h). Quantification of pMEK protein levels, as detected by immunoblot 48 h after the transfection of si-miR-3180 and si-miR-3651 in A375 melanoma cells. (i). Immunoblot of pMEK performed on A375 cells that were transfected with si-NC or si-miR-3180 and 48 h later treated with the indicated doses of vemurafenib for 1 h. (j). Effect of the overexpression of si-miR-3180 on the proliferation of A375 melanoma cells in presence of vem and dependency on BRAFV600E-X1. A375 cells were transfected with si-NC, si-miR-3180, si-X1 or si-miR-3180 + si-X1, treated with 2 uM vemurafenib for 48 h and then allowed to grow for 7 days. Compared to si-NC, the transfection of si-miR-3180 causes an increase in resistance of A375 cells to vem (measured as increase in proliferation). Such effect is abrogated by the concomitant knock-down of BRAFV600E-X1 by means of the co-transfection of si-X1 (an siRNA that targets the 3ʹUTR of BRAF-X1 mRNA [21]), which in turn indicates that the microRNA acts by targeting this protein. (k). Effect of the overexpression of si-miR-3180 on the growth of A375-mCherry cells xenografted in zebrafish embryos. Cells were transfected with si-miR-3180 and treated with 2 uM vemurafenib for 48 h. They were then injected in 48 h post fertilization embryos and allowed to grow for an additional 48 h. At the end of this period, the size of red cell masses was measured (left). The pictures on the right are taken from one out of three independent experiments performed, all with comparable outcome. Scale bar: 100 um. The graphs in this figure represent the mean ± SEM of three independent experiments. *p < 0.05, **p < 0.01.
Figure 5.
Figure 5.
Functional validation of BRAFV600E-X1 binding microRNAs that do not alter BRAFV600E-X1 mRNA levels and rather affect its translation (Class III). (a). Luciferase assay performed in HCT116 Dicer-/- cells indicates that miR-619-5p, miR-1260a, miR-1260b, miR-7704, let-7b-5p, let-7e-5p and let-7i-5p are functional, as they cause a decrease (miR-619-5p, miR-7704, let-7b-5p, let-7e-5p and let-7i-5p, Class IIIa) or an increase (miR-1260a and miR-1260b, Class IIIb) in reporter gene activity. (b-c). Quantification of BRAFV600E (b) and pMEK (c) protein levels, as detected by immunoblot 48 h after the transfection of si-miR-619-5p, si-miR-1260a, si-miR-1260b, si-miR-7704, si-let-7b-5p, si-let-7e-5p and si-let-7i-5p into A375 melanoma cells. (d). Compared to si-NC, the Relative Translation Efficiency (RTE) of Luciferase-X1-3ʹUTR chimerical construct, which is the ratio between Luciferase protein activity and Luciferase mRNA level [28], is lower in presence of si-miR-619-5p and si-let-7b-5p and higher in presence of si-miR-1260a. (e). Effect of the overexpression of miR-619-5p and let-7b-5p on the proliferation of A375 melanoma cells and dependency on BRAFV600E-X1. Compared to si-NC, the transfection of si-miR-619-5p and si-let-7b-5p causes a net decrease in cell proliferation. Such effect is partially abrogated by the concomitant overexpression of the microRNA-insensitive BRAFV600E-X1 CDS, which indicates that the microRNA acts, at least in part, by targeting of this protein. CTRL: A375 cells stably infected with the empty pCW lentiviral vector, transfected with si-miR-619-5p or si-let-7b-5p and induced with 2 ug/ml doxycycline for 48 h. V600E-X1: A375 cells stably infected with pCW-BRAFV600E-X1-CDS lentiviral vector, transfected with si-miR-619-5p or si-let-7b-5p and induced with 2 ug/ml doxycycline for 48 h. The proliferation of A375 cells stably infected with pCW-BRAFV600E-X1-CDS lentiviral vector, transfected with si-NC and induced with 2 ug/ml doxycycline for 48 h did not show a statistically significant difference compared to the proliferation of A375 cells stably infected with the empty pCW lentiviral vector, transfected with si-NC and induced with 2 ug/ml doxycycline for 48 h (which was taken as reference for all the other experimental conditions). (f). Effect of the overexpression of miR-619-5p and let-7b-5p on colony forming ability of A375 melanoma cells. (g). Effect of the overexpression of miR-619-5p and let-7b-5p on the growth of A375-mCherry cells xenografted into zebrafish embryos. About 48 h after the transfection with si-miR-619-5p or si-let-7b-5p, the cells were injected in 48 h post fertilization embryos and allowed to grow for an additional 48 h. At the end of this period, the size of red cell masses was measured. The pictures are taken from one out of three independent experiments performed, all with comparable outcome. Scale bar: 100 um. The graphs in this figure represent the mean ± SEM of three independent experiments. *p < 0.05, **p < 0.01, ***p < 0.001. (h). In the skin cutaneous melanoma dataset available at TCGA, patients with higher levels of let-7b-5p (above the mean, red) show a better overall survival than patients with lower levels of miR-1246 (below the mean, green). n = 501. Samples above the mean: 287, 116 events. Patients below the mean: 214, 96 events. p = 0.0149. (i). Cartoon summarizing the mechanism of action of the X1-targeting microRNAs identified in this article and their effect on the biological properties of melanoma cells.

References

    1. Iwakawa HO, Tomari Y.. The functions of microRNAs: mRNA decay and translational repression. Trends Cell Biol. 2015;25:651–665. - PubMed
    1. Valinezhad Orang A, Safaralizadeh R, Kazemzadeh-Bavili M. Mechanisms of miRNA-mediated gene regulation from common downregulation to mRNA-specific upregulation. Int J Genomics. 2014;2014:970607. - PMC - PubMed
    1. Acunzo M, Romano G, Wernicke D, et al. MicroRNA and cancer–a brief overview. Adv Biol Regul. 2015;57:1–9. - PubMed
    1. Fattore L, Costantini S, Malpicci D, et al. MicroRNAs in melanoma development and resistance to target therapy. Oncotarget. 2017;8:22262–22278. - PMC - PubMed
    1. Tarang S, Weston MD. Macros in microRNA target identification: a comparative analysis of in silico, in vitro, and in vivo approaches to microRNA target identification. RNA Biol. 2014;11:324–333. - PMC - PubMed

Publication types

LinkOut - more resources