. 2019 Apr 4;104(4):665-684.
doi: 10.1016/j.ajhg.2019.02.022. Epub 2019 Mar 28.

Genetic Architectures of Childhood- and Adult-Onset Asthma Are Partly Distinct

Affiliations

Genetic Architectures of Childhood- and Adult-Onset Asthma Are Partly Distinct

Manuel A R Ferreira et al. Am J Hum Genet. .

Abstract

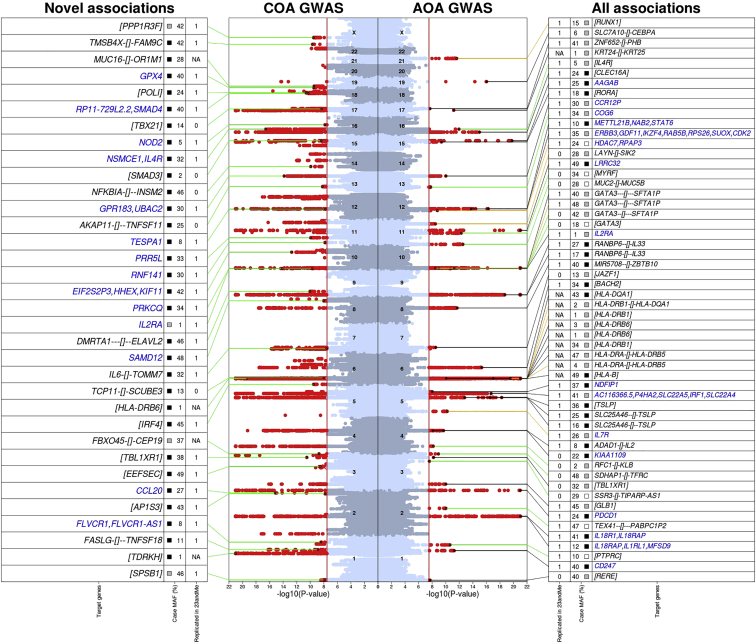
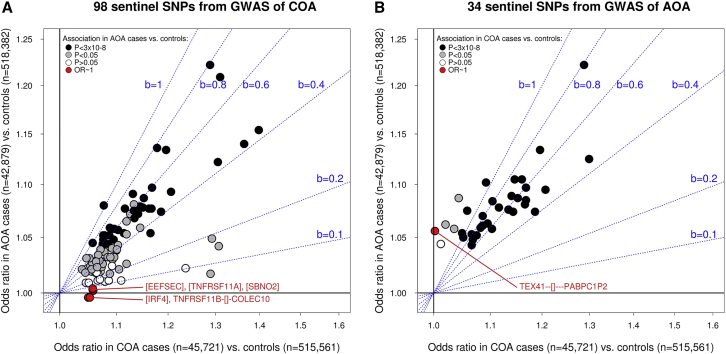
The extent to which genetic risk factors are shared between childhood-onset (COA) and adult-onset (AOA) asthma has not been estimated. On the basis of data from the UK Biobank study (n = 447,628), we found that the variance in disease liability explained by common variants is higher for COA (onset at ages between 0 and 19 years; h2g = 25.6%) than for AOA (onset at ages between 20 and 60 years; h2g = 10.6%). The genetic correlation (rg) between COA and AOA was 0.67. Variation in age of onset among COA-affected individuals had a low heritability (h2g = 5%), which we confirmed in independent studies and also among AOA-affected individuals. To identify subtype-specific genetic associations, we performed a genome-wide association study (GWAS) in the UK Biobank for COA (13,962 affected individuals) and a separate GWAS for AOA (26,582 affected individuals) by using a common set of 300,671 controls for both studies. We identified 123 independent associations for COA and 56 for AOA (37 overlapped); of these, 98 and 34, respectively, were reproducible in an independent study (n = 262,767). Collectively, 28 associations were not previously reported. For 96 COA-associated variants, including five variants that represent COA-specific risk factors, the risk allele was more common in COA- than in AOA-affected individuals. Conversely, we identified three variants that are stronger risk factors for AOA. Variants associated with obesity and smoking had a stronger contribution to the risk of AOA than to the risk of COA. Lastly, we identified 109 likely target genes of the associated variants, primarily on the basis of correlated expression quantitative trait loci (up to n = 31,684). GWAS informed by age of onset can identify subtype-specific risk variants, which can help us understand differences in pathophysiology between COA and AOA and so can be informative for drug development.

Keywords: GWAS; age; allergy; asthma; genetic; genome; heritability; onset; overlap; risk.


Figures

Figure 1
Figure 1
Summary of Association Results from the GWAS of COA and AOA in the UK Biobank Study The middle panel shows the Manhattan plots (left for COA, based on 13,962 affected individuals and 300,671 controls; right for AOA, based on 26,582 affected individuals and 300,671 controls) with variants associated with disease risk at a p < 3 × 10−8 (red vertical line) are circled in red; associations with p < 10−21 are shown with p = 10−21. For COA, sentinel variants that were in low LD (r2 < 0.05) with previously reported associations for allergic disease are shown with a black circle (25 out of 123 in total); the green line points to additional information on the adjacent left panel. Specifically, the left panel indicates: (1) whether the association with COA was replicated in the independent 23andMe study (p < 0.05 and same direction of effect; “1” = yes, “0” = no, “NA” = results not available); (2) the minor-allele frequency (MAF; in %) in the case group; the square indicates whether the risk allele occurred at a significantly greater (in black; p < 0.05 and OR > 1 in the COA versus AOA case-case analysis, i.e., there was a stronger risk factor for COA), similar (in gray; p ≥ 0.05 in the case-case analysis, i.e., there was a similar association with COA and AOA), or lower (in white; p < 0.05 and OR < 1 in the case-case analysis; i.e., there was a stronger risk factor for AOA) frequency in COA-affected individuals than in AOA-affected individuals; and (3) the location of the sentinel risk variant relative to the nearest genes (in black font) or, for variants with an association that was replicated in the 23andMe study and with a target gene prediction, the likely target gene(s) based on LD (r2 > 0.8) with non-synonymous or sentinel eQTL (in blue font). The location of the sentinel risk variant (when shown) is indicated by “gene1–[]–gene2,” the two closest genes (upstream and downstream), when the variant was intergenic; the distance to each gene is proportional to the number of “-“ shown. Otherwise, when the risk variant was located within a gene, the respective gene name is shown between square brackets (i.e. [gene]). The right panel shows the same information for all 56 sentinel variants associated with AOA; these variants were grouped into those that (1) were in LD (r2 > 0.05) with sentinel variants identified in the COA GWAS (37 variants; highlighted by a black line); (2) were in LD (r2 > 0.05) with previous reported associations for allergic disease (eight variants; highlighted by an orange line); or (3) were not in LD (r2 < 0.05) with sentinel variants for COA, and did not have previous reported associations for allergic disease (11 variants; highlighted by a green line).
Figure 2
Figure 2
Association between Sentinel Variants and Risk of COA and AOA The two panels (A and B) respectively show results for COA and AOA sentinel SNPs that were identified in the UK Biobank GWAS and that were subsequently validated in the 23andMe replication study. The x axis shows SNP effects (odds ratio; “OR”) estimated in the COA-affected individuals versus control individuals meta-analysis of the UK Biobank and 23andMe studies, and the y axis shows the effect in the AOA-affected individuals versus control individuals meta-analysis of the same two studies. In panel (A), variants for which the odds ratio in the AOA-affected individuals versus control individuals analysis was <1.005 are highlighted in red; their genomic context is also highlighted. Similarly, in panel (B), variants in red had an odds ratio <1.005 in the COA-affected individuals versus control individuals analysis. To help interpret the correlation in odds ratios between the two disease subtypes, we have shown regression lines with increasing beta coefficients (“b,” from 0.1 to 1) in blue.

References

    1. Tan D.J., Walters E.H., Perret J.L., Lodge C.J., Lowe A.J., Matheson M.C., Dharmage S.C. Age-of-asthma onset as a determinant of different asthma phenotypes in adults: A systematic review and meta-analysis of the literature. Expert Rev. Respir. Med. 2015;9:109–123. - PubMed
    1. Moore W.C., Meyers D.A., Wenzel S.E., Teague W.G., Li H., Li X., D’Agostino R., Jr., Castro M., Curran-Everett D., Fitzpatrick A.M., National Heart, Lung, and Blood Institute’s Severe Asthma Research Program Identification of asthma phenotypes using cluster analysis in the Severe Asthma Research Program. Am. J. Respir. Crit. Care Med. 2010;181:315–323. - PMC - PubMed
    1. Deliu M., Yavuz T.S., Sperrin M., Belgrave D., Sahiner U.M., Sackesen C., Kalayci O., Custovic A. Features of asthma which provide meaningful insights for understanding the disease heterogeneity. Clin. Exp. Allergy. 2018;48:39–47. - PMC - PubMed
    1. Newby C., Heaney L.G., Menzies-Gow A., Niven R.M., Mansur A., Bucknall C., Chaudhuri R., Thompson J., Burton P., Brightling C., British Thoracic Society Severe Refractory Asthma Network Statistical cluster analysis of the British Thoracic Society Severe refractory Asthma Registry: Clinical outcomes and phenotype stability. PLoS ONE. 2014;9:e102987. - PMC - PubMed
    1. Wu W., Bleecker E., Moore W., Busse W.W., Castro M., Chung K.F., Calhoun W.J., Erzurum S., Gaston B., Israel E. Unsupervised phenotyping of Severe Asthma Research Program participants using expanded lung data. J. Allergy Clin. Immunol. 2014;133:1280–1288. - PMC - PubMed

Publication types