. 2019 Apr 18;177(3):654-668.e15.
doi: 10.1016/j.cell.2019.02.010. Epub 2019 Mar 28.

A Common Embryonic Origin of Stem Cells Drives Developmental and Adult Neurogenesis

Affiliations

A Common Embryonic Origin of Stem Cells Drives Developmental and Adult Neurogenesis

Daniel A Berg et al. Cell. .

Abstract

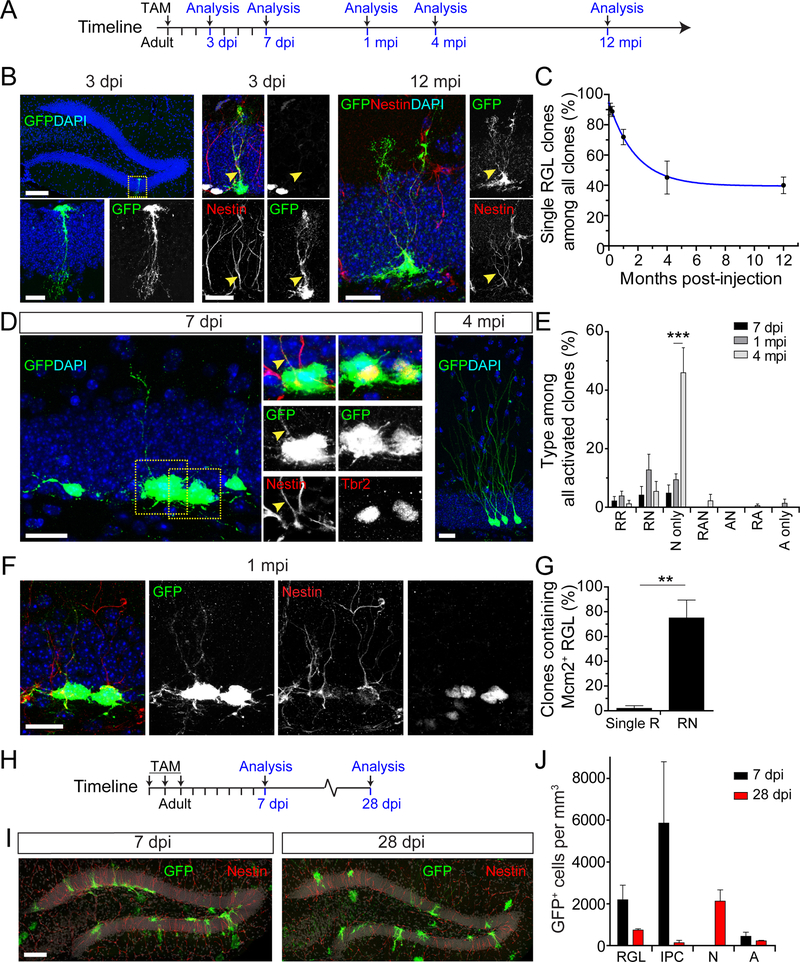
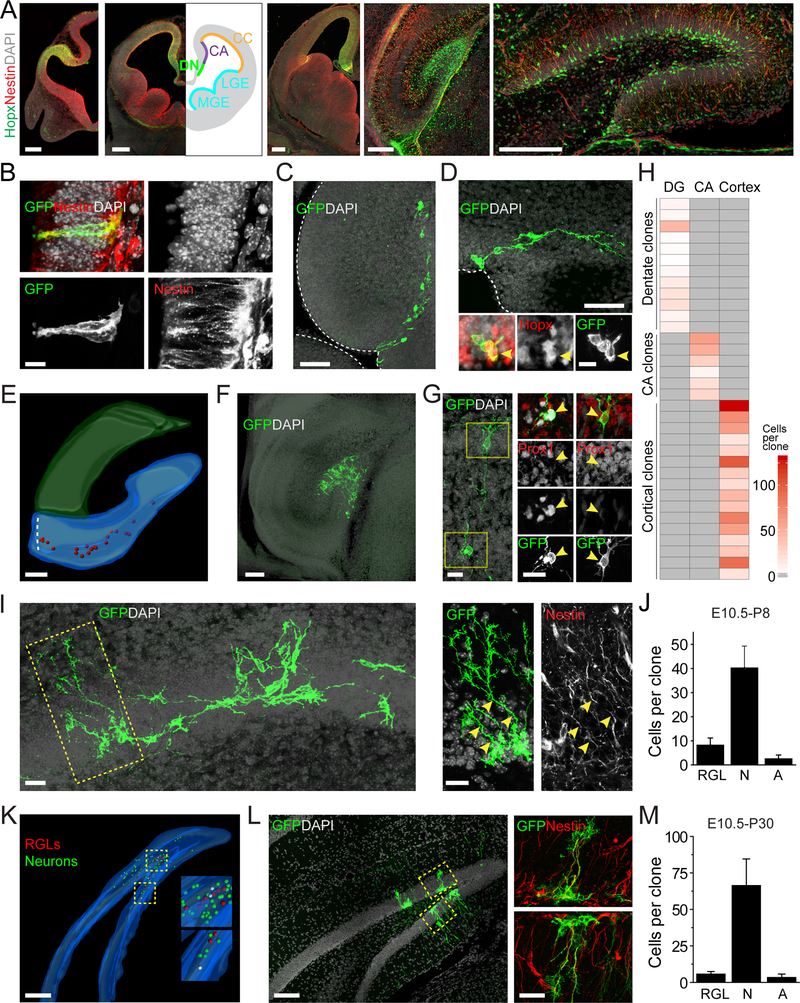
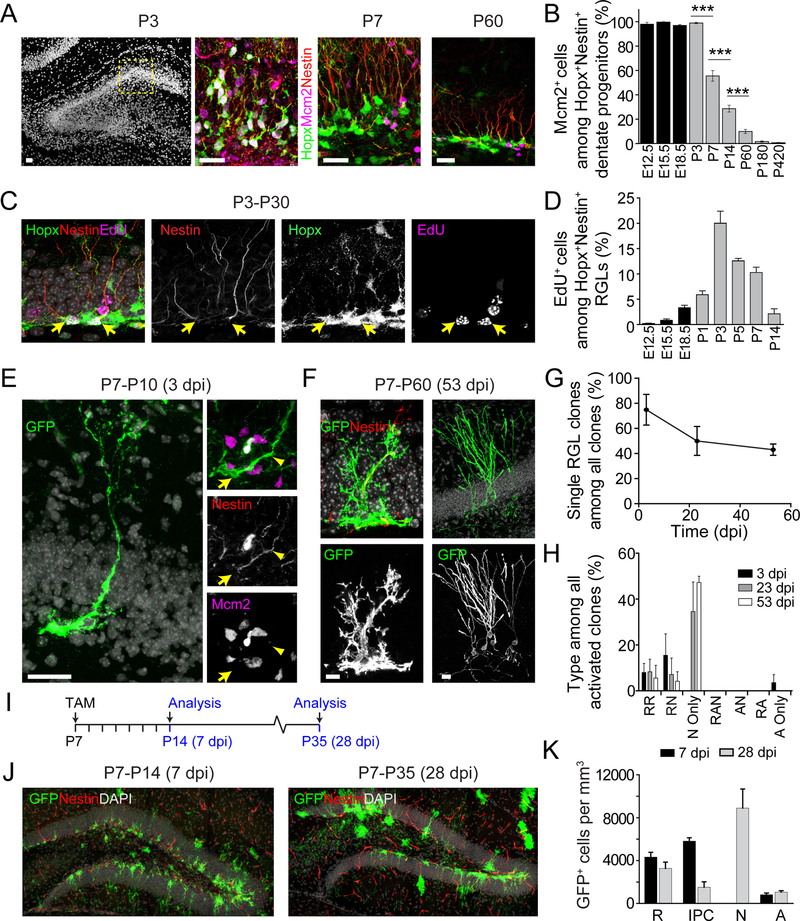
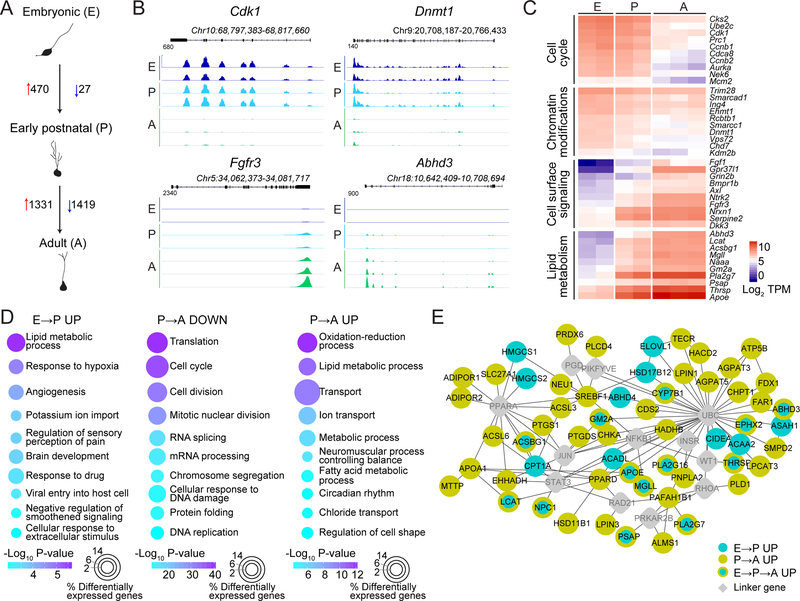
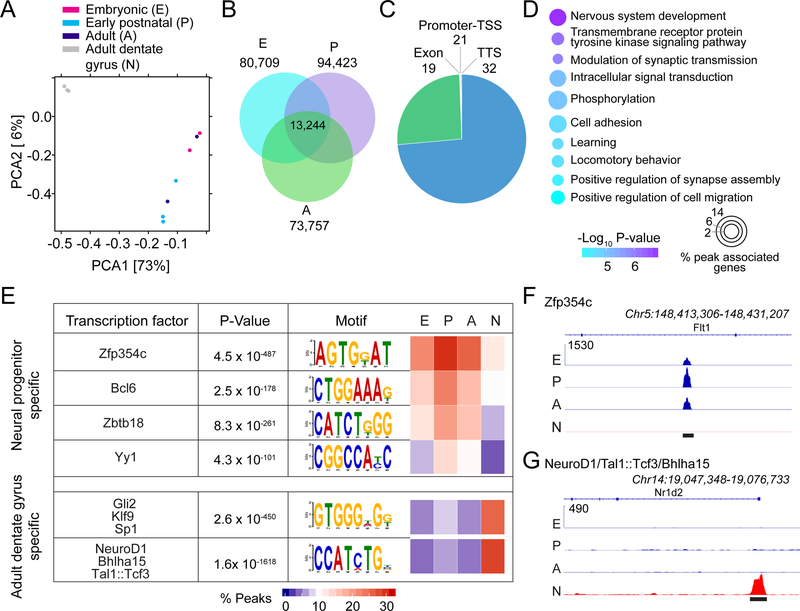
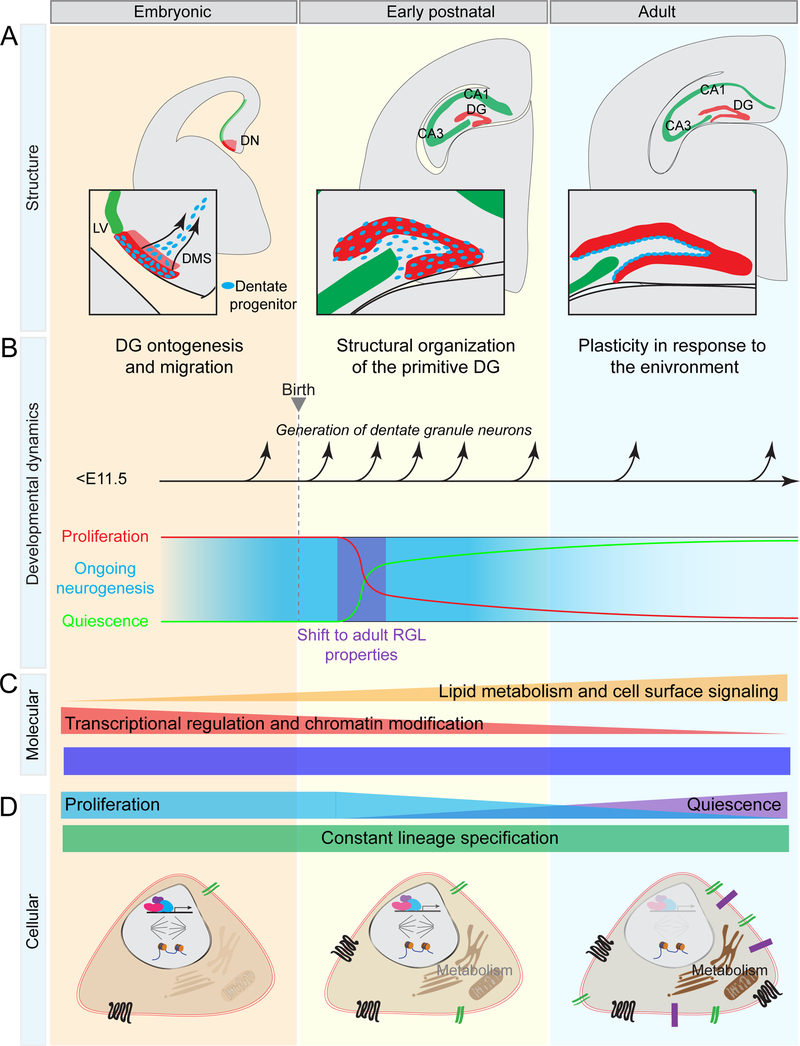
New neurons arise from quiescent adult neural progenitors throughout life in specific regions of the mammalian brain. Little is known about the embryonic origin and establishment of adult neural progenitors. Here, we show that Hopx+ precursors in the mouse dentate neuroepithelium at embryonic day 11.5 give rise to proliferative Hopx+ neural progenitors in the primitive dentate region, and they, in turn, generate granule neurons, but not other neurons, throughout development and then transition into Hopx+ quiescent radial glial-like neural progenitors during an early postnatal period. RNA-seq and ATAC-seq analyses of Hopx+ embryonic, early postnatal, and adult dentate neural progenitors further reveal common molecular and epigenetic signatures and developmental dynamics. Together, our findings support a "continuous" model wherein a common neural progenitor population exclusively contributes to dentate neurogenesis throughout development and adulthood. Adult dentate neurogenesis may therefore represent a lifelong extension of development that maintains heightened plasticity in the mammalian hippocampus.

Keywords: Hopx; brain development; chromatin landscape profiling; dentate gyrus; gene expression profiling; hippocampus; lineage tracing; neural stem cells; neurogenesis.


Conflict of interest statement

DECLARATION OF INTERESTS

The authors declare no competing interests.

Figures

Figure 1.
Figure 1.. Hopx-CreERT2 mouse marks neurogenic quiescent RGLs in the adult dentate gyrus.
(A) Adult Hopx-CreERT2::EYFP mice were given a single injection of tamoxifen (TAM) for clonal lineage-tracing analysis at different time points in (B-G). See Table S1. (B) Confocal images of EYFP-labeled clones consisting of a single RGL at 3 dpi in the dentate gyrus (left top panel) with a higher magnification of the boxed area (bottom panel), and co-labeled with Nestin, but not Mcm2 (middle panel), and at 12 mpi co-labeled with Nestin (right panel). Yellow arrowhead signifies Nestin+ radial process. Scale bars: 100 μm (left top panel) and 20 μm (other panels). (C) Quantification of the percentage of single RGL clones. Values represent mean ± SEM (n = 4–9 dentate gyri; blue line represents one phase decay line of best fit). (D) Confocal images of an activated clone at 7 dpi (left panel) consisting of a Nestin+ RGL (box 1) and multiple Tbr2+ IPCs (box 2) and a clone at 4 mpi containing mature neurons (right panel). Low magnification image is a projection image of multiple sections, while high magnification images show a subset of z-sections for co-localization. Yellow arrowhead signifies Nestin+ radial process. Scale bars: 20 μm. (E) Quantification of activated clone compositions. Activated clones were classified into 7 categories: RR (≥ 2RGLs), RN (≥ 1 RGL and ≥ 1 IPC/Neuron), N only (≥ 1 neuron), RAN (≥ 1 RGL and ≥ 1 astroglial and ≥ 1 IPC/Neuron), NA (≥ 1 IPC/Neuron and ≥ 1 astroglial progeny), RA (≥ 1 RGL and ≥ 1 astroglial progeny), A only (≥ 2 astroglial progeny). Values represent mean ± SEM (n = 5–9 dentate gyri; ***p < 0.001; Student’s t-test). (F) Confocal images of a self-renewing RN-clone at 1 mpi containing an Mcm2+ RGL and multiple Mcm2+ progeny. Scale bar: 20 μm. (G) Quantification of the percentage of clones that contained an Mcm2+ RGL among all single R or RN clones. Values represent mean ± SEM (n = 3–4 dentate gyri; **p < 0.01; Student’s t-test). (H-J) Fate-mapping of Hopx+ progenitors in the adult dentate gyrus at the population level using Hopx-CreERT2::mTmG mouse line. Shown are the experimental paradigm (H; See Table S1), confocal images of GFP+ cells in the dentate gyrus (I; Scale bar: 100 μm) and quantification of the GFP+ population composition (J). N: immature/mature neurons; A: astrocytes; Values represent mean ± SEM (n = 3–4 mice). See also Figure S1 and Table S1.
Figure 2.
Figure 2.. Embryonic dentate Hopx+ precursors give rise to granule neurons and adult RGLs in the dentate gyrus.
(A) Confocal images of Hopx/Nestin co-expression in developing dentate gyrus. Scale bars: 200 μm. DN: dentate neuroepithelium, CA: CA neuroepithelium, CC: cortical neuroepithelium, LGE: lateral ganglionic eminence, MGE: medial ganglionic eminence, LV: lateral ventricle. (B) Confocal images of a clone at E11.5 consisting of two Nestin+ neural precursors in the DN (See Movie S1). Scale bar: 10 μm. Pregnant Hopx-CreERT2::mTmG mice were given a single injection of tamoxifen to label embryos at E10.5 for clonal lineage-tracing analysis in (B-M). See Table S1. (C) Confocal image of a clone at E15.5 consisting of cells in the DN and cells migrating along the dentate migratory stream into the dentate primordium. Scale bar: 50 μm. (D) Confocal images of clone at E15.5 containing ventricular Hopx+ cells. Scale bars: 50 μm (top panel), 20 μm (bottom panel). (E) 3D rendering of a reconstructed clone at E18.5 in which cells spanned from the DN through the dentate migratory stream to the dentate primordium (DG). Red dots represent individual labeled cells. Scale bar: 100 μm. (F) Confocal image of a clone at E18.5 in which all progeny were located in the dentate primordium. Scale bar: 100 μm. (G) Confocal images of a subset of a clone at E18.5 including a Hopx+ progenitor (Box 1) and a Prox1+ dentate granule neuron (Box 2). Arrowheads indicate GFP+ cell somas. Scale bars: 20 μm. (H) Heat map of clonal progeny localization at E18.5. Each row represents a single clone. (I) Confocal images of a clone at P8 consisting of RGLs and neuronal progeny in the dentate gyrus (left panel) with high magnification of the boxed area showing Nestin+ RGLs (right panel). Arrowheads indicate Nestin+ processes Scale bars: 20 μm. (J) Quantification of clone composition at P8. N: neuronal cell; A: astrocytes. Values represent mean ± SEM (n = 4 clones). (K) 3D rendering of a reconstructed clone at P30 spanning 20 sections (S1–S20; 45 μm in section thickness) depicts a single clone that includes neurons, astrocytes, and RGLs (higher magnification in Boxes 1 and 2). See Movie S2. Scale bar: 100 μm. (L) Confocal images of section 11 of the clone reconstructed in (K) showing two Nestin+ RGLs (Boxes 1, 2). Scale bars: 100 μm (left panel) and 20 μm (right panel). (M) Quantification of clone composition at P30. Values represent mean ± SEM (n = 3 clones). See also Figure S2, Table S1, and Movie S1 & 2.
Figure 3.
Figure 3.. Embryonic dentate Hopx+ progenitors adopt adult RGL-like properties during early postnatal development.
(A-B) Hopx+ progenitors adopt a radial morphology and a quiescent state during the first postnatal week. Shown in (A) are confocal images of Mcm2+Hopx+Nestin+ progenitors in the dentate gyrus at P3, P7 and P60. Boxed area at P3 is shown in a higher magnification. Scale bars: 40 μm. Also See Figure S3A. Shown in (B) is quantification of the percentage of Mcm2+ cells among all Hopx+Nestin+ progenitors in the dentate gyrus. Values represent mean ± SEM (n = 3–4 dentate gyri; ***p < 0.001; One-way ANOVA with Tukey post-hoc test). (C-D) Birth dating of Hopx+ adult RGLs. EdU was administered on a single day shown on the x-axis in (D), followed by a chase period until analysis at P30. Shown in (C) are confocal images of EdU+ RGLs after EdU injection at P3. Arrows indicate EdU+ nuclei. Scale bar: 20 μm. Shown in (D) is quantification of the proportion of Hopx+Nestin+ RGLs in the dentate gyrus that retained EdU at P30 from injection at different times during development (x-axis). Also see Figure S3F. Values represent mean ± SEM (n = 4–5 dentate gyri). (E-H) Hopx-CreERT2::mTmG mice received a single injection of tamoxifen at P7 for clonal lineage-tracing (See Table S1). Shown in (E) are confocal images of a clone at 3 dpi consisting of a single Nestin+Mcm2 RGL. Arrow indicates Mcm2 nucleus and arrowhead indicates Nestin+ radial process. Scale bar: 20 μm. Shown in (F) are confocal images of two clones at 53 dpi, one containing a single RGL (left panels), and the other containing mature neurons (right panels). Scale bars: 20 μm. Also shown are quantifications of the percentage of clones consisting of a single RGL (G; similar to Figure 1C) and of activated clone compositions (H; similar to Figure 1E). Values represent mean ± SEM (n = 6 dentate gyri). (I-K) Hopx-CreERT2::mTmG mice were given a single injection of tamoxifen at P7 for population fate mapping (See Table S1). Shown in (I) is the experimental paradigm. Shown in (J) are confocal images of GFP+ cells in the dentate gyrus. Note Nestin staining on blood vessels. Scale bars: 100 μm. Shown in (K) is quantification of the composition of the GFP+ population in the dentate gyrus. Similar to Figure 1J. Values represent mean ± SEM (n = 4 dentate gyri). See also Figure S3 and Table S1.
Figure 4.
Figure 4.. Transcriptome analyses reveal a common signature of dentate Hopx+ neural progenitors across different developmental stages.
(A) Venn diagram of the 5,000 most highly expressed genes in Hopx+ embryonic (E15.5; E), early postnatal (P4; P), and adult (P45; A) dentate progenitors identified 3,914 commonly expressed genes, which were then compared to the 5,000 most highly expressed genes of adult dentate gyrus samples (N) to determine 1,306 dentate progenitor-enriched genes. RNA-seq data for adult dentate gyrus is from (Su et al., 2017). (B-C) Representative genome tracks showing the expression of two stem cell genes (B) and two neuronal genes (C) in dentate neural progenitors and adult dentate gyrus. Y-axis indicates normalized reads. (D) Heat map illustrating the expression of stem cell genes and neuronal genes in dentate progenitors and adult dentate gyrus. (E) Heat map illustrating the expression of dentate progenitor-enriched genes within select gene ontology (GO) terms in dentate progenitors and adult dentate gyrus. (F) GO analysis of biological processes of the 1,306 dentate progenitor-enriched genes. Color indicates P values for GO term enrichment and circle size indicates the percentage of progenitor-enriched genes for each GO term. See also Figure S4.
Figure 5.
Figure 5.. Transcriptome analyses reveal developmental transitions of dentate Hopx+ neural progenitors.
(A) A schematic of the number of differentially expressed genes between dentate neural progenitors at sequential developmental stages. The same datasets in Figure 4 were used for analysis. Differentially expressed genes were identified at a false discovery rate (FDR) of 0.05. (B) Sample genome tracks showing differential expression of Cdk1, Dnmt1, Fgfr3 and Abhd3 during embryonic (E), early postnatal (P) and adult (A) stages. Y-axis indicates normalized reads. (C) Heat map illustrating gradual changes gene expression in dentate neural progenitors across development sorted by GO terms. (D) GO analysis of biological processes for differentially expressed genes in dentate progenitors at different stages. (E) Gradual developmental shift in metabolism by dentate neural progenitors. Shown is a Wikipathways gene set enrichment analysis for upregulated lipid metabolism genes in dentate progenitors during development. See also Figure S5.
Figure 6.
Figure 6.. Dentate Hopx+ neural progenitors maintain a stable landscape of chromatin accessibility across development.
(A) PCA plot of ATAC-seq biological replicates of embryonic (E), early postnatal (P), and adult (A) dentate neural progenitors and adult dentate gyrus samples (N). ATAC-seq data for adult dentate gyrus is from (Su et al., 2017). (B) Venn diagram illustrating the overlap of ATAC-seq peaks in dentate progenitors at different stages. (C) Genome annotation of the dentate progenitor-enriched peaks, which were determined by comparing common peaks found in neural progenitors (B) to those in the adult dentate gyrus samples. TSS: transcription start site, TTS: transcription termination site. (D) GO analysis of genes associated with progenitor enriched ATAC-seq peaks in the promoter-TSS, exon, intron, and TTS regions. (E) Motif discovery analysis of dentate neural progenitor-enriched peaks or adult dentate gyrus-enriched peaks. Motifs shown are known transcription factor binding sites whose transcription factors were expressed in our samples and had an enrichment p-value ≤ 1×10−100. (F-G) Representative chromatin profiling coverage of dentate neural progenitor-enriched peak with a Zfp354c binding site motif (F), and an adult dentate gyrus-enriched peak with a Neurod1/Tal1:Tcf3/Bhlha15 binding site motif (G). Y-axis indicates normalized reads. Black bars indicate peak locations. See also Figure S4 & S6.
Figure 7.
Figure 7.. Summary of cellular and molecular dynamics of dentate neural progenitors during development.
(A) Summary of the structural morphogenesis of dentate gyrus (DG). Neural precursors situated in the dentate neuroepithelium (DN) migrate along the dentate migratory stream (DMS) during embryonic development to form the dentate primordium. Visible organization of the primitive dentate gyrus occurs postnatally, when dentate progenitors transition into adult RGLs. Finally, the adult dentate gyrus is organized with the RGLs located within the SGZ at the border of the hilus. (B) Summary of the developmental dynamics of dentate neural progenitors. Dentate Hopx+ progenitors continuously generate dentate granule neurons from embryonic development through adulthood, exhibiting constant lineage specification. During the early postnatal period, Hopx+ progenitors enter quiescence and acquire adult RGL properties. (C-D) Summary of molecular signatures (C) and cellular properties (D) of dentate progenitors across development. A constant chromatin accessibility signature is maintained in dentate progenitors, as well as constant lineage specification, while other properties undergo developmental dynamics. See also Figure S7.

Comment in

References

    1. Alonso-Martin S, Rochat A, Mademtzoglou D, Morais J, de Reynies A, Aurade F, Chang TH, Zammit PS, and Relaix F (2016). Gene Expression Profiling of Muscle Stem Cells Identifies Novel Regulators of Postnatal Myogenesis. Front Cell Dev Biol 4, 58. - PMC - PubMed
    1. Altman J, and Bayer SA (1990). Mosaic organization of the hippocampal neuroepithelium and the multiple germinal sources of dentate granule cells. The Journal of comparative neurology 301, 325–342. - PubMed
    1. Anacker C, and Hen R (2017). Adult hippocampal neurogenesis and cognitive flexibility - linking memory and mood. Nat Rev Neurosci 18, 335–346. - PMC - PubMed
    1. Bailey TL, Boden M, Buske FA, Frith M, Grant CE, Cle,emti L, Ren J, Li WW, and Noble WS. (2009). The MEME Suite: tools for motif discovery and searching. Nucleic Acids Res 37, W202–8. - PMC - PubMed
    1. Bayer SA, and Altman J (1974). Hippocampal development in the rat: cytogenesis and morphogenesis examined with autoradiography and low-level X-irradiation. The Journal of comparative neurology 158, 55–79. - PubMed

Publication types