. 2019 Apr 18;177(3):669-682.e24.
doi: 10.1016/j.cell.2019.02.019. Epub 2019 Mar 28.

Shared Cortex-Cerebellum Dynamics in the Execution and Learning of a Motor Task

Affiliations

Shared Cortex-Cerebellum Dynamics in the Execution and Learning of a Motor Task

Mark J Wagner et al. Cell. .

Abstract

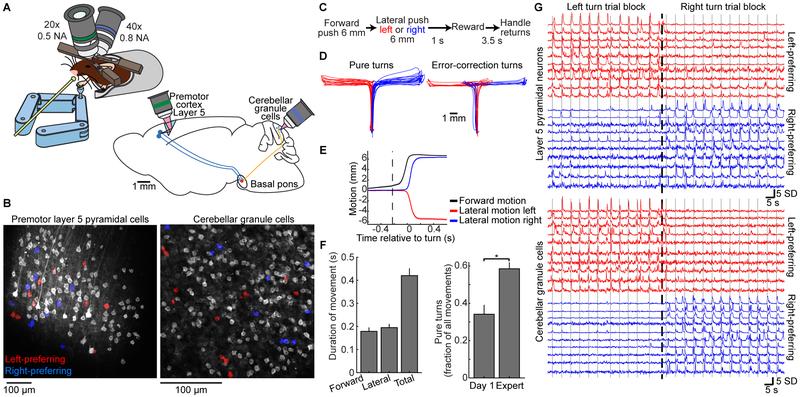
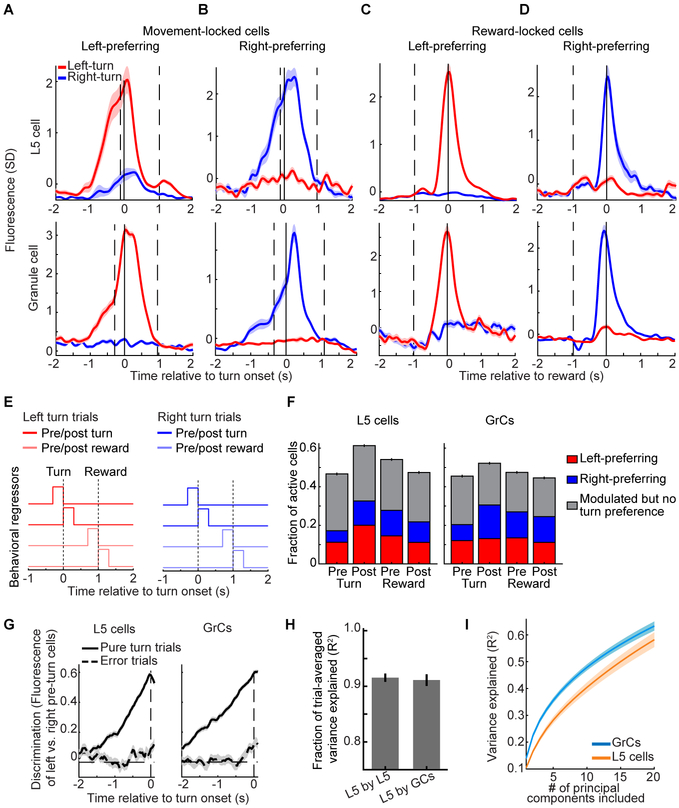
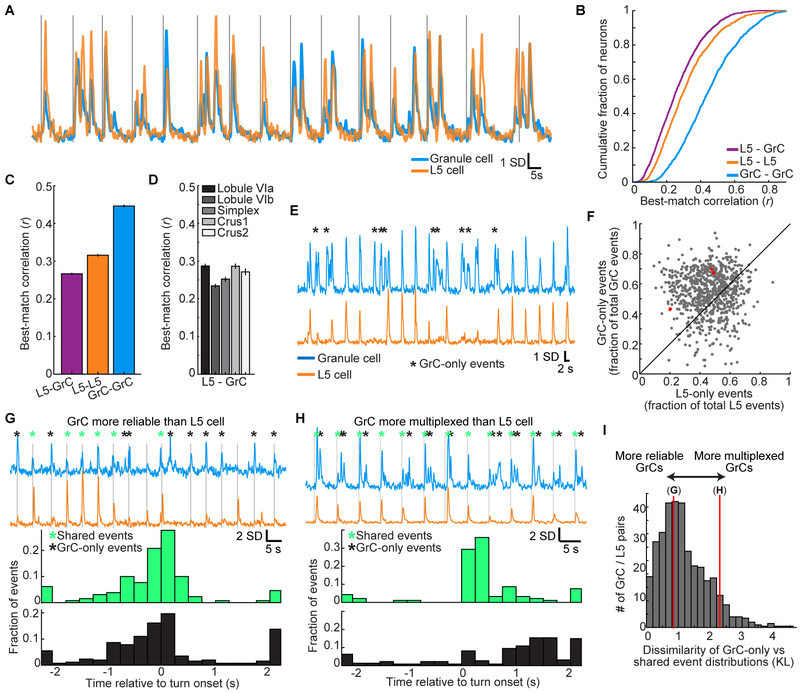
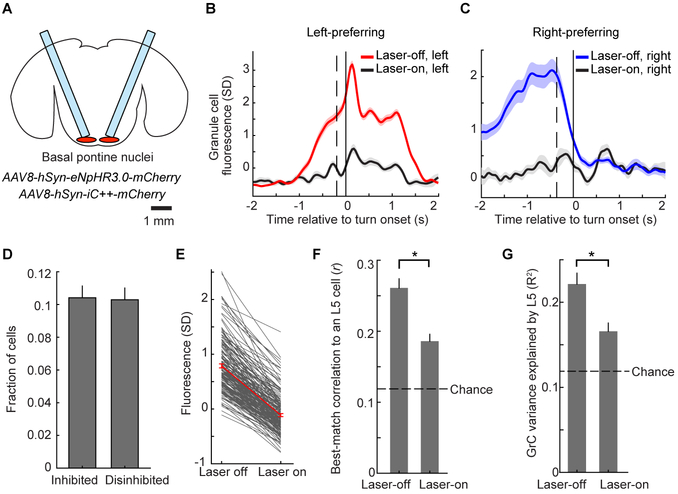
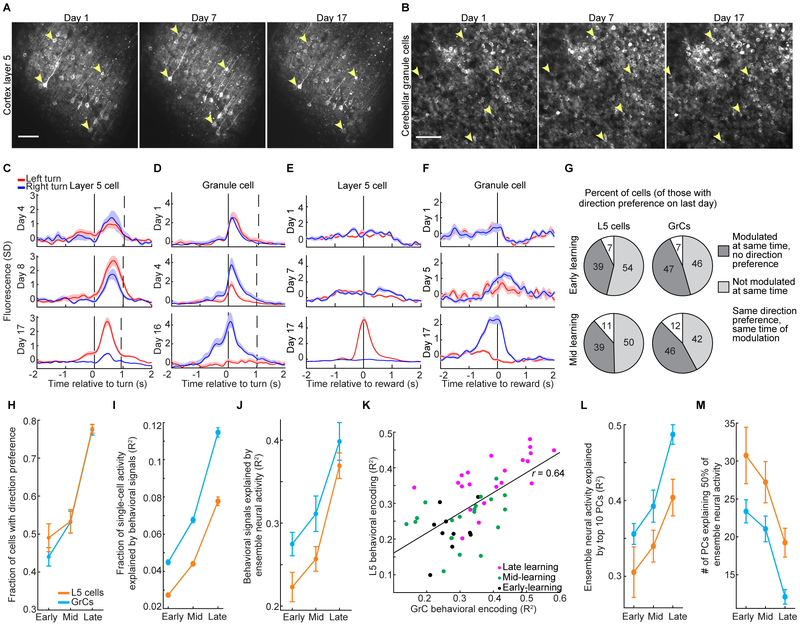
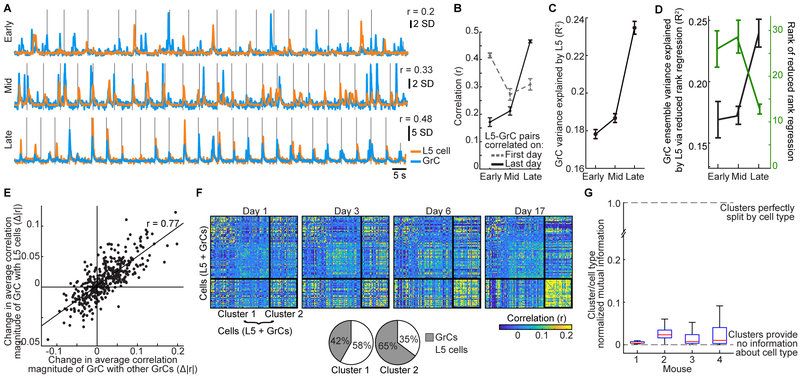
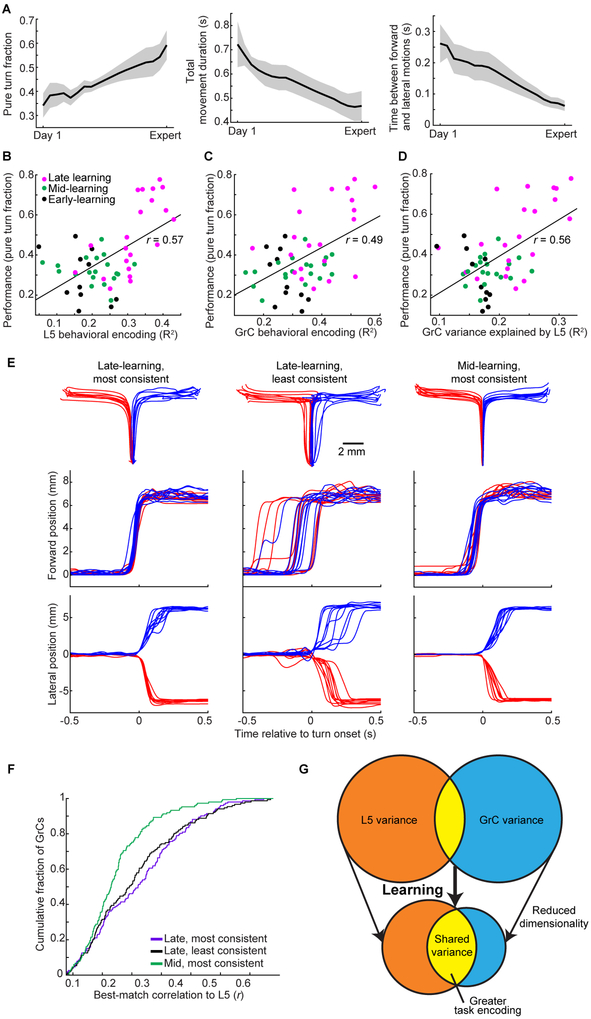
Throughout mammalian neocortex, layer 5 pyramidal (L5) cells project via the pons to a vast number of cerebellar granule cells (GrCs), forming a fundamental pathway. Yet, it is unknown how neuronal dynamics are transformed through the L5→GrC pathway. Here, by directly comparing premotor L5 and GrC activity during a forelimb movement task using dual-site two-photon Ca2+ imaging, we found that in expert mice, L5 and GrC dynamics were highly similar. L5 cells and GrCs shared a common set of task-encoding activity patterns, possessed similar diversity of responses, and exhibited high correlations comparable to local correlations among L5 cells. Chronic imaging revealed that these dynamics co-emerged in cortex and cerebellum over learning: as behavioral performance improved, initially dissimilar L5 cells and GrCs converged onto a shared, low-dimensional, task-encoding set of neural activity patterns. Thus, a key function of cortico-cerebellar communication is the propagation of shared dynamics that emerge during learning.

Keywords: brain state; cerebellum; dimensional expansion; granule cells; layer 5; motor learning; movement planning; neocortex; pontine nuclei; reward.


Figures

Figure 1.
Figure 1.. Simultaneous Two-photon Ca2+ Imaging of Cerebellar GrCs and Premotor Cortex L5 Pyramidal Neurons during a Forelimb Movement Task
(A) Experimental schematics. Mice voluntarily moved a manipulandum for sucrose water reward (left). We performed simultaneous Ca2+ imaging in cerebellar GrCs through a cranial window, and in L5 pyramidal neurons of the premotor cortex using an implanted 1 mm prism (right). GCaMP6f was expressed in L5 cells and GrCs using quadruple transgenic mice Rbp4-Cre/Math1-Cre/Ai93/ztTA. (B) Mean images from representative two-photon Ca2+ imaging movies in L5 cells (left) and GrCs (right). The spatial filters used to extract fluorescence traces from cells with detected activity are highlighted in grayscale or red/blue (see G below; n=144 L5 cells/177 GrCs). (C) Forelimb movement task. Water-restricted mice self-initiated trials. The task alternated blocks of 40 forward/left-turn movements with blocks of 40 forward/right-turn movements. No cues indicated trial type. (D) Example movements on the virtual right-angle track (left panel, n=20 each of pure left and right turns; right panel, n=8 error-correction turns in each direction). (E) Average motion over time in forward (black curve) and lateral (colored curves) directions for all pure turn trials in the session in D, aligned temporally to turn onset (n=51/63 pure-left/pure-right turns). Dashed vertical line denotes average forward movement onset. (F) Behavioral performance: left, average duration of forward and turning portions of pure turn trials (n=28 imaging sessions in 10 expert mice). Right, pure turns are more common after learning (p=0.003, Wilcoxon rank sum test, n=7/21 for Day-1/Expert sessions in 7 mice). (G) For the imaging session in B, example fluorescence traces from both cortex (top) and cerebellum (bottom). SD, standard deviation (fluorescence in z-scored units). Dashed vertical line indicates time of switch from a left-turn block to a right-turn block of trials. Solid vertical lines denote individual turn motions. Traces show direction-preferring cells colored by their direction preference (n=20 example L5 cells and GrCs, 10 preferring each direction; 11 turn motions in each direction). Corresponding cell spatial filters are colored in B. See Figures S1–S3 for related anatomy, methods, and necessity of imaged areas for behavior.
Figure 2.
Figure 2.. Similar Task Representations in L5 Cells and GrCs in Expert Mice
(A–D) Trial-averaged activity in example L5 cells (top) or GrCs (bottom) that responded preferentially before and during either left- or right-turn movements (A and B), or reward consumption (C and D) following either successful left- or right-turn trials. Vertical lines from left to right in A and B denote average forward motion onset, turning motion onset, and average reward delivery time. Vertical lines in C and D denote average time of turning motion and reward delivery. Shaded areas denote SEM in this and all subsequent figures. (From left to right for L5 cells: 109/76/72/109 left- and 74/71/71/74 right-turn trials; for GrCs: n=68/97/72/109 left- and 69/99/71/74 right-turn trials). (E) Individual neurons were scored by linearly regressing their concatenated single-trial activity onto a set of 8 behavioral regressors. (F) Fraction of cells with significant coefficients for either turn direction (grey) or with significantly larger coefficients for one turn direction (colored) among L5 cells (left) and GrCs (right) (n=2,037/2417 for L5 cells/GrCs from 28 imaging sessions in 10 mice; these and all subsequent histogram error bars are from counting statistics). (G) All GrCs or L5 cells that responded preferentially prior to one turn direction were grouped. The discrimination index for each trial was the time-varying difference between the average activity of left- and right-preferring pre-turn cell groups. Traces show average discrimination index across all pure-turn or all error trials (sign of index was inverted on right trials to match sign of left trials; n=1,498 pure-turn trials and 612 error trials, on which incorrect lateral motion exceeded 2.5 mm, from 5 mice. Index normalized to range from – 1 to 1). On error trials, neither ensemble discriminated turn direction prior to lateral motion onset (from −300 to −50 ms relative to turn onset; p=0.22/0.67 for 720/536 GrCs/L5 cells with pre-turn direction preference, Wilcoxon signed rank test). (H) Time-varying trial-averaged activity of each L5 neuron was reproduced by linear regression from the activity of either L5 or GrC populations. Regressions performed at similarly high levels (R2, fraction of variance explained on held-out data; 28 sessions in 10 mice). (I) PCA was performed across cells, using the fluorescence concatenated across all trials of each individual L5 cell or GrC. Fewer principal components are needed to explain 50% of GrC variance than are needed for L5 (p=0.002, Wilcoxon sign-rank test, n=28 imaging sessions from 10 mice).
Figure 3.
Figure 3.. Highly Correlated Single-trial L5-GrC Activity in Expert Mice
(A) Example of a highly correlated L5 cell-GrC pair. Vertical lines denote individual turning motion onsets. (B and C) Cumulative distributions of correlation coefficients between each GrC or L5 cell and its best-matching GrC or L5 cell (mean±SEM; n=2,037/2,417 L5 cells/GrCs; computed over the concatenated activity on all movements from −2 to 2 s relative to turn onset). (D) Correlations with imaging sessions grouped by the cerebellar lobule that was imaged. (E) Example highly correlated L5-GrC pair (r=0.59). Black asterisks indicate GrC events not present in the L5 cell. (F) Scatter plot of all highly correlated L5-GrC pairs (defined as r>0.4; each dot is a pair) showing the proportion of total L5 events that were unique to the L5 cell (x-axis), compared to the proportion of GrC events that were unique to the GrC (y-axis). GrC-only events were substantially more common (p<10−6 Wilcoxon signed rank test, n=800 L5-GrC pairs with r>0.4 from 28 imaging sessions in 10 mice). Red dots indicate examples from E, G, and H, from left to right. (G) Top, fluorescence traces from a highly correlated L5-GrC pair (r=0.43), with onset of individual turn motions denoted by vertical lines. Asterisks denote L5-GrC shared events (green) or GrC-only events (black). Bottom, the temporal distribution (relative to forelimb movement) of shared events is very similar to the temporal distribution of GrC-only events. (H) Same as G, for a L5-GrC pair (r=0.41) in which the temporal distribution of GrC-only events strongly diverged from that of L5-GrC shared events. (I) Histogram of the dissimilarity (Kullback-Leibler divergence, KL, STAR Methods) between the temporal distribution of shared events and the distribution of GrC-only events, for all highly correlated pairs. Red vertical lines indicate example pairs in G and H with KL divergences of 0.85 and 2.3, respectively. Most cell pairs are more similar to G than to H. See Figure S3 for additional data analyses, and Figure S4 for theoretical analyses.
Figure 4.
Figure 4.. Contributions of Pontine Input to GrC Representations and Correlations to L5.
(A) Schematic showing optical fibers implanted bilaterally above the basal pontine nuclei transduced with either of the AAVs indicated. (B and C) Trial-averaged activity of example left- (B) or right- (C) turn-preferring GrCs under normal conditions or during optogenetic inhibition of the pontine nuclei (67/95 and 17/24 laser-off/laser-on trials in B and C respectively). Vertical dashed lines show average forward motion onset. (D) Fraction of GrCs significantly inhibited (n=174) or disinhibited during pontine photoinhibition (n=163; out of 1,681 total imaged in 21 imaging sessions in 10 mice; significance determined via permutation test at p<0.01). (E) Fluorescence decrease for all inhibited GrCs, averaged over an 800 ms window centered on the time at which fluorescence was maximally reduced on laser-on trials relative to laser-off trials. (F) For all inhibited GrCs in mice with simultaneous L5 imaging, each cell’s highest pairwise correlation coefficient to an L5 cell is reduced during laser-on trials compared with laser-off trials (p<10−6, Wilcoxon signed-rank test, n=115 inhibited GrCs and 1,042 total L5 cells from 16 imaging sessions in 6 mice). Dashed line in this panel and G shows chance value determined from trial-shuffles in which the trial numbers for cerebellar and cortical activity are randomly mismatched. (G) For inhibited GrCs, pontine photoinhibition decreases the fraction of GrC activity explained by linear regression using simultaneous L5 activity (p<10−6 Wilcoxon signed-rank test). See Figure S5 for methods and related data.
Figure 5.
Figure 5.. Common L5 and GrC Task Representations Emerge Concurrently during Learning
(A and B) Example mean fluorescence images of the same L5 cells (A) and GrCs (B) acquired over learning. Arrowheads point to example cells that were tracked across days. (C–F) Trial-averaged activity of example L5 cells (C and E) and GrCs (D and F) shown on days corresponding to early, mid, and late learning. Cells develop direction-preferring activity time-locked to movement (C and D) or reward (E and F) (mean±SEM; left/right turn trial numbers for C, D, E, F: Early: n=40/18, 24/68, 29/18, 29/18; Mid: 34/27, 57/33, 48/36, 17/45; Late: 109/74, 24/37, 72/71, 72/71). (G) All cells were scored on each day for direction preference and task-locking using regression analysis as in Figure 2E. For the set of all L5 cells (left) and GrCs (right) that had direction preference on the final day of imaging, activity was primarily either modulated at the same time but without direction preference (dark gray) or was not modulated at that time (light gray) on earlier days (n=183/206 L5 cells and 172/202 GrCs from early/mid-learning, respectively). Direction-preferring activity was only infrequently maintained (white). (H and I) Based on regression analysis (as in Figure 2E), more cells had direction-preference late in learning (H, p=6×10⁻⁶ and 5×10⁻⁶ for early vs. late for L5 and GrCs; Wilcoxon rank sum test; n=11 early, 19 mid, and 21 late imaging sessions from 7 mice), and regressions more accurately reproduced each cell’s activity (I; p< 10−6 Wilcoxon rank sum test for early vs late in L5 and GrCs; n=1,265/1,397, 2,113/2,324, 1,666/1,647 L5/GrC observations early, mid, and late, respectively). (J and K) The entire ensemble of GrCs or L5 cells was scored for its fidelity of behavioral encoding. The accuracy of reproducing behavioral signals shown in Figure S6A via single-trial linear regression rose over learning (J, mean±SEM; late vs early, p=0.0009 and p=9×10⁻⁵ for L5 and GrC respectively; n=11 early, 19 mid, and 21 late learning imaging sessions from 7 mice). In addition, regression accuracy for GrC populations (x-axis) and L5 populations (y axis) in each imaging session (colored dots) covaried over learning (K, 51 imaging sessions from 7 mice). (L and M) L5 and GrC ensembles both became lower-dimensional over learning, as the top 10 principal components (as computed in Figure 2I) explained greater fractions of single-trial variance (L, p=5×10⁻⁶ and 3×10⁻⁵ for GrCs and L5 cells, respectively), and fewer components were required to explain 50% of variance (M, p=4×10⁻⁵ and p=0.007 for GrCs and L5 cells respectively, Wilcoxon rank sum test, 11 early, 21 late sessions). See Figure S6 for further analyses and related data.
Figure 6.
Figure 6.. Shared Cortico-cerebellar Dynamics Emerge Over Learning
(A) Example L5-GrC pair strongly correlated late in learning was poorly correlated early in learning. Vertical lines denote onset of individual turn motions. (B) L5-GrC pairs that were highly correlated on the last day were weakly correlated early in learning (solid trace; p<10−6 Wilcoxon signed-rank test, n=121 pairs with last-day correlations >0.4). Dashed trace shows the evolution of correlations for pairs with high correlations early in learning. The initial correlation for last-day-correlated pairs was weaker than the final correlation of first-day-correlated pairs (p=3 ×10⁻⁶ Wilcoxon rank sum test, n=61 pairs early learning correlations >0.4). (C) The accuracy with which L5 population activity reproduced the fluorescence of each GrC via linear regression rose over learning (curves show mean±SEM across GrCs; p<10−6 comparing early and late learning, Wilcoxon rank sum test). (D) The single-trial activity of all GrCs was simultaneously reproduced via linear reduced rank regression using L5 population activity. Regression accuracy rose over learning (black), while the average rank (dimensionality) of the L5-GrC regression fell (green; curves show mean±SEM across imaging sessions from 7 mice). (E) For each GrC (represented by a dot), the change in its average correlation magnitude to all other GrCs (x-axis) strongly covaried with the change in its correlation to all L5 cells (n=398 GrCs tracked over learning). (F) Matrix of correlation coefficients between each pair of neurons for 4 days between early and late learning in one mouse (n=55/53 L5 cells/GrCs). K-means clustering (k=2) identified groups of neurons that together exhibited similar changes in correlation to all other neurons over learning. Clustering was applied to the differences in correlation coefficients between Day 17 and Day 1. The thick solid black outlines in the matrix show the resulting clusters. The neurons are sorted in the same order on each day. Bottom, pie charts show substantial contribution of GrCs and L5 cells to both clusters. (G) The correspondence between cluster membership and L5/GrC cell type was characterized via the normalized mutual information. Mutual information was generally close to zero, indicating that L5 cells and GrCs were recruited together into coherently evolving cell assemblies during learning. Boxes show median, 25/75th percentiles over 1,000 clustering instantiations. See Figure S6 for further analyses and related data.
Figure 7.
Figure 7.. Coherent L5-GrC Dynamics Reflect a Learned Circuit State.
(A) Behavioral learning. Pure turns as a fraction of trials increased (left, p=0.003, n=7 mice). Total movement duration decreased (middle, p<10−6), reflecting briefer transitions between the forward and lateral motions (right, p<10−6; n=460/2,062 Day-1/late learning trials; 19.3±1.1 days between day 1 and last day). Statistics compare all Day 1 to all late-learning days, using trials from all mice (2.8±0.5 expert days per mouse; Wilcoxon rank sum test). (B, C) Behavioral encoding via linear regression in L5 (B) and GrC (C) ensembles covaried with behavioral performance over learning. (D) The fraction of GrC variance explained by L5 ensembles via linear regression also covaried with behavioral performance. (E) Within each imaging session, each successful trial was ranked by its kinematic similarity to the average pure turn trajectory of the same direction. From an example mouse, 10 trajectories in each direction are shown from three sets of trials: from a late-learning day, the subsets of trials most and least consistent with the average trajectory (left two columns), and from a mid-learning day, the subset of trials most consistent with the average trajectory (right column). Top row shows trajectories in x-y space, and middle and bottom rows show forward and lateral motion over time. (F) For each late- and mid-learning imaging session, best-match L5-GrC correlations were computed using only trials from either the most consistent or least consistent subset (20 top- and bottom-ranked trials in each direction). L5-GrC correlations were not significantly different between most and least consistent trials on the late learning day (distributions shown for mouse in E; black versus grey, p=0.35, Kolmogorov-Smirnov test, n=149/152 GrCs, and 143/134 L5 cells, from the mid-/late-learning days, respectively). By contrast, even the most consistent trials on the mid-learning day exhibited substantially smaller L5-GrC correlations than did the least consistent late learning trials (p=0.0001). (G) Schematic of evolution of L5 and GrC ensemble dynamics over learning. From an initially less coherent, higher-dimensional, less task-related set of activity patterns, L5 and GrC ensembles converge onto a more shared, low-dimensional, task-encoding set of activity patterns. See Figure S7 for further analyses and related data.

References

    1. Albus JS (1971). A theory of cerebellar function. Mathematical Biosciences 10, 25–61.
    1. Babadi B, and Sompolinsky H (2014). Sparseness and expansion in sensory representations. Neuron 83, 1213–1226. - PubMed
    1. Barton Robert A., and Venditti C (2014). Rapid Evolution of the Cerebellum in Humans and Other Great Apes. Curr Biol 24, 2440–2444. - PubMed
    1. Berndt A, Lee SY, Wietek J, Ramakrishnan C, Steinberg EE, Rashid AJ, Kim H, Park S, Santoro A, Frankland PW, et al. (2016). Structural foundations of optogenetics: Determinants of channelrhodopsin ion selectivity. Proc Natl Acad Sci 113, 822–829. - PMC - PubMed
    1. Billings G, Piasini E, Lőrincz A, Nusser Z, and Silver RA (2014). Network Structure within the Cerebellar Input Layer Enables Lossless Sparse Encoding. Neuron 83, 960–974. - PMC - PubMed

Publication types

LinkOut - more resources