. 2019 Jun 4;29(6):1274-1290.e9.
doi: 10.1016/j.cmet.2019.03.001. Epub 2019 Mar 28.

Telomere Dysfunction Induces Sirtuin Repression that Drives Telomere-Dependent Disease

Affiliations

Telomere Dysfunction Induces Sirtuin Repression that Drives Telomere-Dependent Disease

Hisayuki Amano et al. Cell Metab. .

Abstract

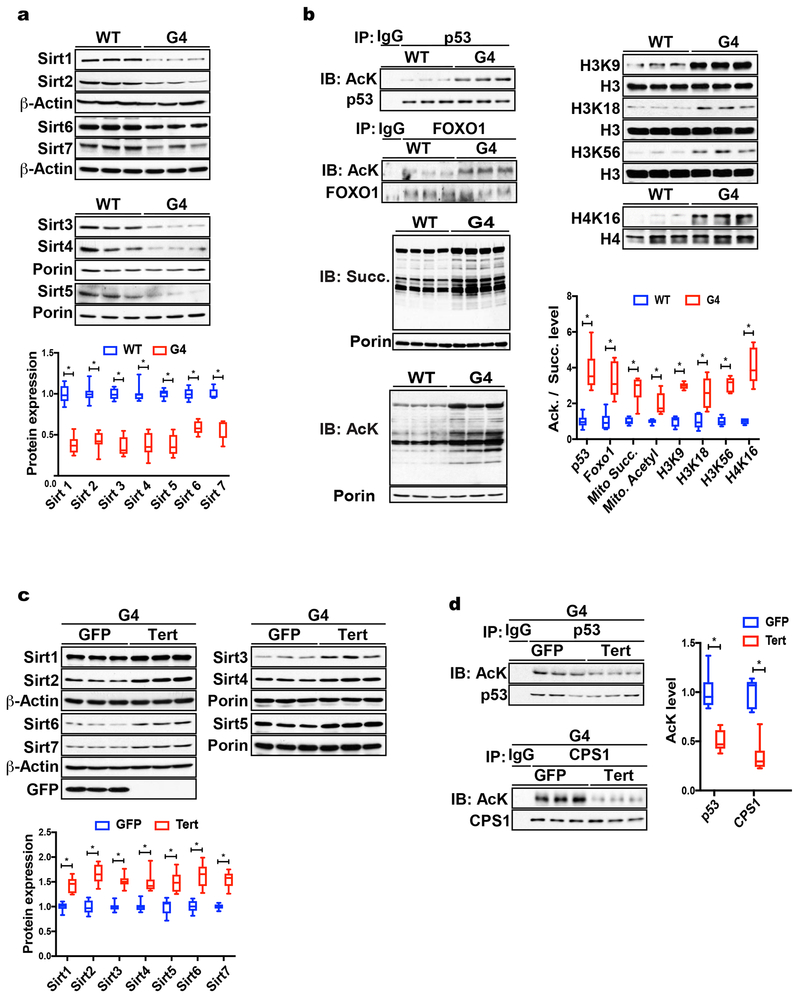
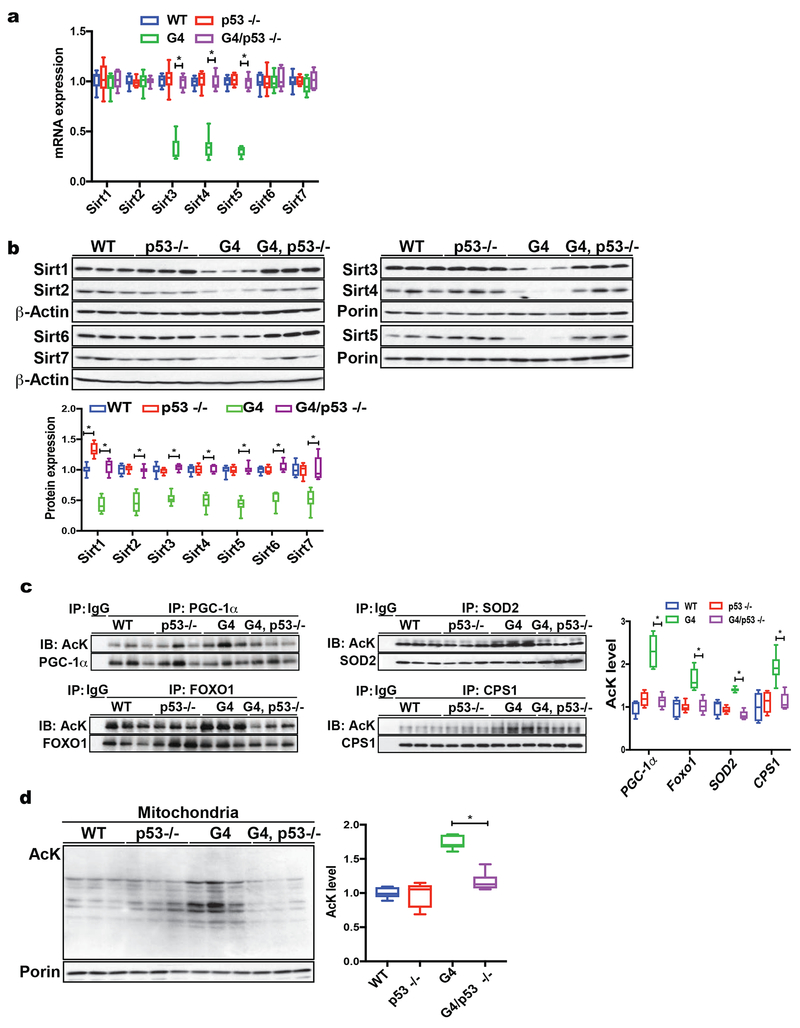
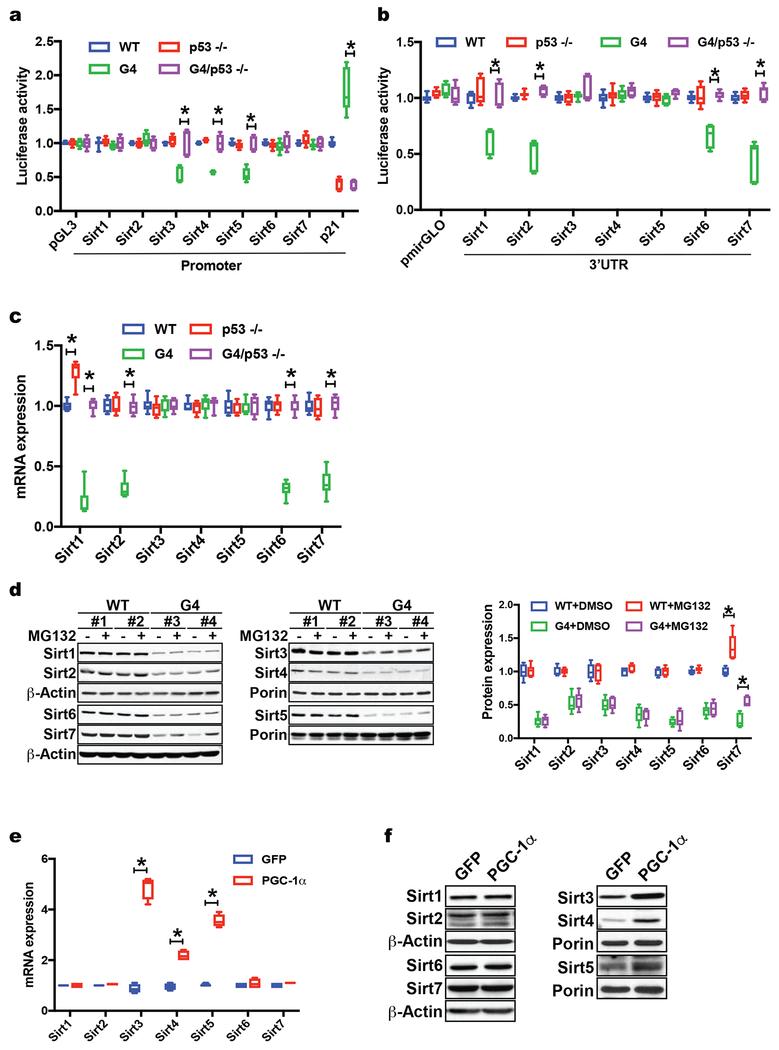
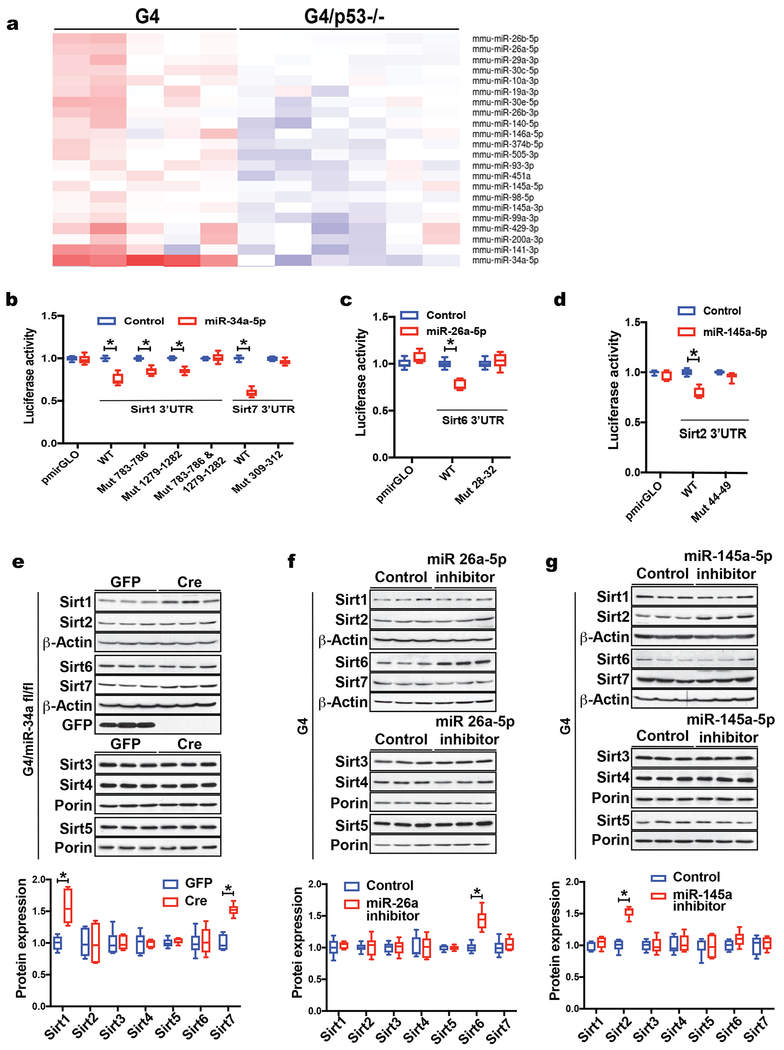
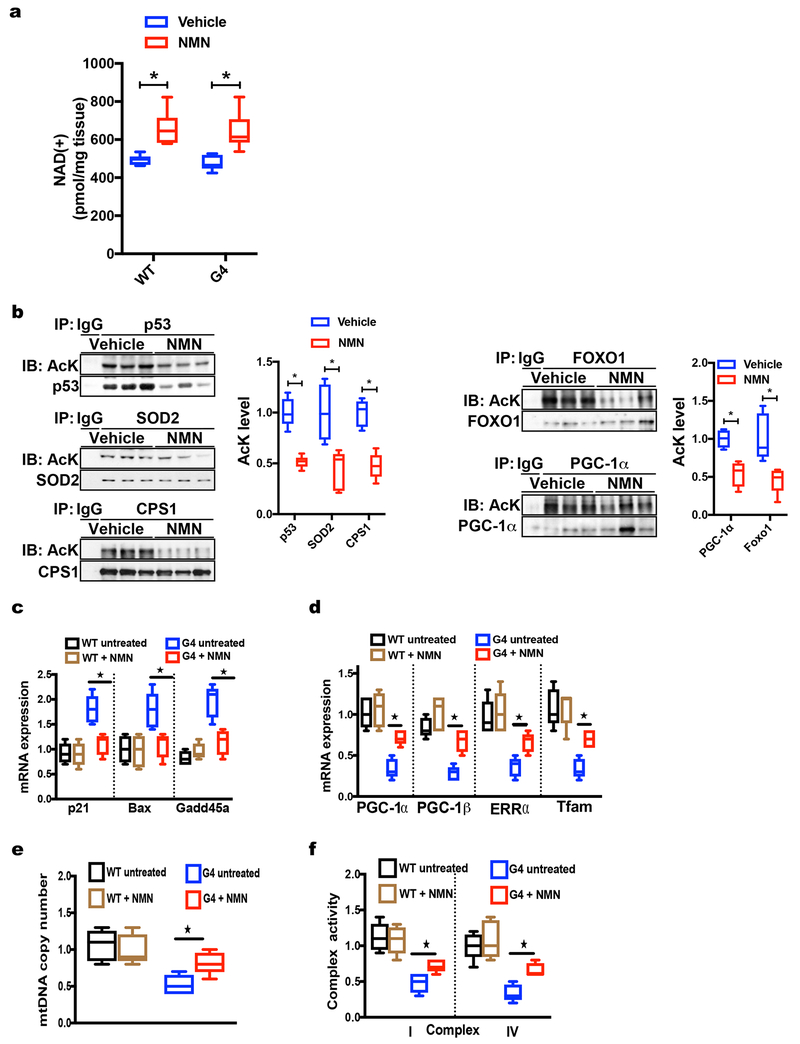
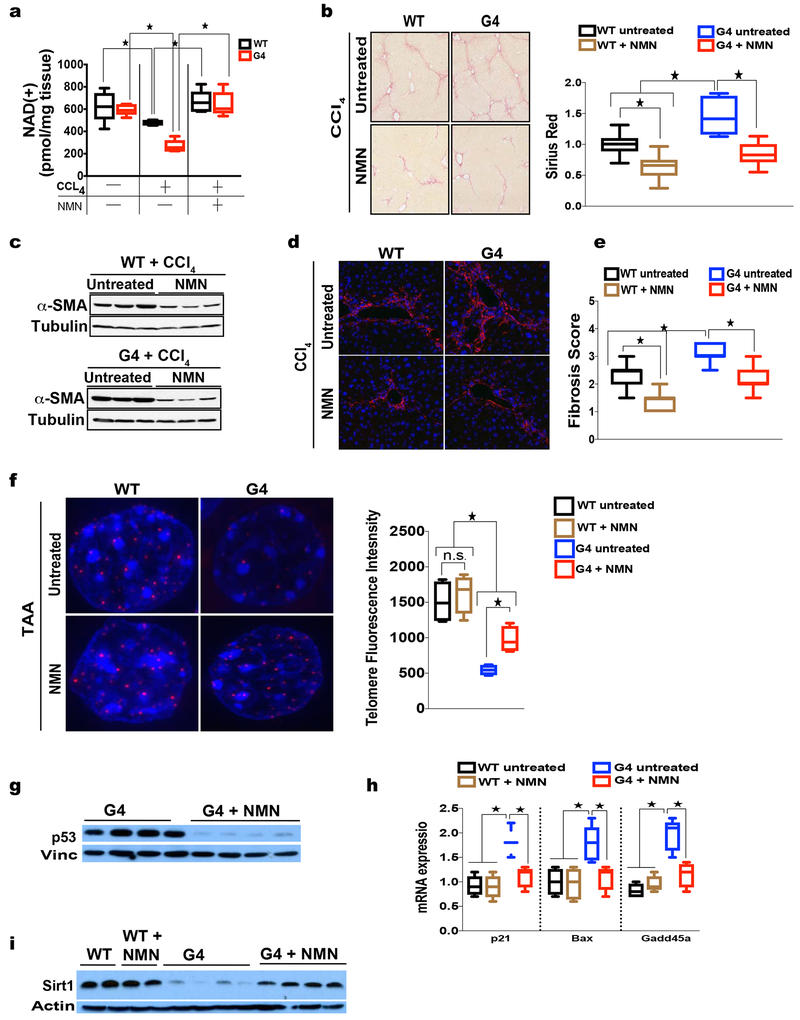
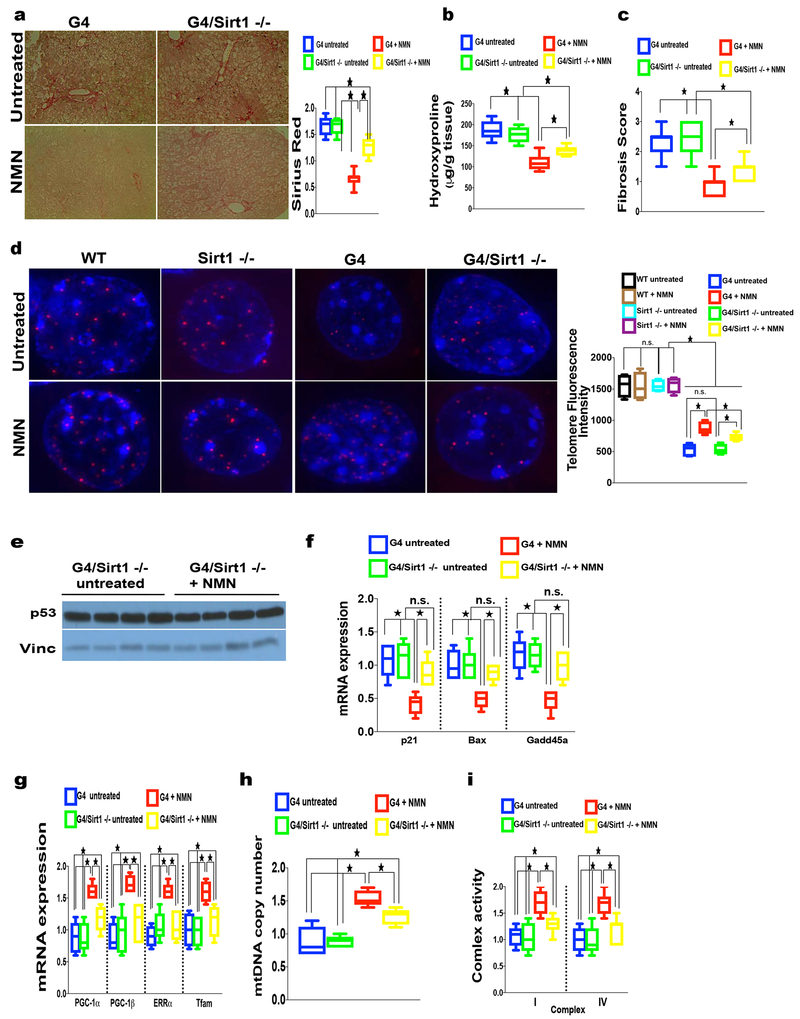
Telomere shortening is associated with stem cell decline, fibrotic disorders, and premature aging through mechanisms that are incompletely understood. Here, we show that telomere shortening in livers of telomerase knockout mice leads to a p53-dependent repression of all seven sirtuins. P53 regulates non-mitochondrial sirtuins (Sirt1, 2, 6, and 7) post-transcriptionally through microRNAs (miR-34a, 26a, and 145), while the mitochondrial sirtuins (Sirt3, 4, and 5) are regulated in a peroxisome proliferator-activated receptor gamma co-activator 1 alpha-/beta-dependent manner at the transcriptional level. Administration of the NAD(+) precursor nicotinamide mononucleotide maintains telomere length, dampens the DNA damage response and p53, improves mitochondrial function, and, functionally, rescues liver fibrosis in a partially Sirt1-dependent manner. These studies establish sirtuins as downstream targets of dysfunctional telomeres and suggest that increasing Sirt1 activity alone or in combination with other sirtuins stabilizes telomeres and mitigates telomere-dependent disorders.

Keywords: liver disease; metabolism; p53; sirtuins; telomeres.


Conflict of interest statement

Declaration of Interests

J.A.B. is an inventor on a patent involving the use of NAD precursors to treat liver injuries. D.A.S. is a founder, equity owner, board member, advisor to, director of, consultant to, investor in and/or inventor on patents licensed to Vium, Jupiter Orphan Therapeutics, Cohbar, Galilei Biosciences, GlaxoSmithKline, OvaScience, EMD Millipore, Wellomics, Inside Tracker, Caudalie, Bayer Crop Science, Longwood Fund, Zymo Research, EdenRoc Sciences (and affiliates Arc-Bio, Dovetail Genomics, Claret Bioscience, Revere Biosensors, UpRNA and MetroBiotech, Liberty Biosecurity). Life Biosciences (and affiliates Selphagy, Senolytic Therapeutics, Spotlight Biosciences, Animal Biosciences, Iduna, Immetas, Prana, Continuum Biosciences, Jumpstart Fertility, and Lua. D.A.S. sits on the board of directors of both companies. DAS is an inventor on a patent application licensed to Elysium Health. His personal royalty share is directed to the Sinclair lab.

Figures

Fig. 1
Fig. 1. Telomere dysfunction leads to sirtuin repression and hyperacetylation of sirtuin targets
(a) Western blot demonstrates that Sirt1-7 are significantly down-regulated in G4 liver tissue (9 mice per group analyzed; shown are 3 representative mice per group); (b) IP-western blot analysis shows acetylation of targets of Sirt1 (p53, Foxo1), Sirt2 (H3K56, H4K16) Sirt3 (mitochondrial protein acetylation), Sirt5 (mitochondrial protein succinylation), Sirt6 (H3K9 and H3K56) and Sirt7 (H3K18) are increased in G4 liver tissue (shown are 3 representative results per group; a total of 9 mice per group were analyzed); (c) Western blot analysis of liver tissue from G4 mice infected with adenovirus expressing either telomerase (“Tert”) or GFP control shows that reactivation of telomerase increases sirtuin protein levels in G4 liver tissues (shown are 3 representatives per group; a total of 9 mice per group were analyzed); (d) telomerase reactivation decreases acetylation levels of Sirt targets compared to GFP-Adenovirus control group (9 mice per group were analyzed); Results are quantified by densitometry and expressed as mean ± s.e.m.; t-test was used to determine statistical significance with p <0.05 considered as significant, as indicated by (*).
Fig. 2
Fig. 2. P53 regulates sirtuins in telomere dysfunctional mice
(a) RT-qPCR analysis of sirtuin transcripts in WT, p53−/−, G4/p53 +/+ and G4/p53 −/− liver tissue demonstrates that mitochondrial sirtuins (Sirt3, 4 & 5) are repressed in G4/p53 +/+ mice and p53 deficiency in G4 mice rescues their expression (9 mice per group analyzed); (b) Western blot analysis using total liver tissue or isolated liver mitochondria shows elevated sirtuin protein expression in G4/p53 −/− mice compared to G4/p53 +/+ mice (9 mice per group were analyzed); (c) Combined IP-western blot analysis of liver tissues derived from WT, p53 −/−, G4/p53 +/+ and G4/p53 −/− mice demonstrates decreased acetylation levels of PGC-1α, FOXO1, SOD2, CPS1 in G4/p53 −/− compared to G4/p53 +/+ mice (6 mice per group were analyzed); (d) Analysis of acetylation levels of mitochondrial proteins from WT, p53 −/−, G4/p53 +/+, and G4/p53 −/− mice shows that G4/p53 −/− have decreased acetylation compared to G4/p53 +/+ mice (6 mice per group were analyzed). Results are quantified by densitometry and expressed as mean ± s.e.m.; t-test was used to determine statistical significance with p <0.05 considered as significant, as indicated by (*).
Fig. 3
Fig. 3. P53 regulates sirtuins at the transcriptional and posttranscriptional level in telomere dysfunctional mice
(a) Luciferase assay with Sirt1-7 promoter sequences in pGL3 vector shows increased Sirt3, 4 & 5 luciferase activity in G4/p53 −/− compared to G4 /p53 +/+ MEFs (pGL3 vector and p21 promoter serve as background and positive controls); (b) Luciferase assays with Sirt1-7 3’UTR reveals increased luciferase activity in G4/p53 −/− MEFs compared to G4/p53 +/+ MEFs; (c) Polysome analyses in WT, p53 −/−, G4/p53 +/+, and G4/p53 −/− MEFs shows increased polysome occupancy of Sirt1, 2, 6, 7 transcripts in G4/p53 −/− MEFs (two independent experiments); (d) Western blot analysis of MEFs treated with proteasome inhibitor MG132 indicates that Sirt7 protein abundance is also regulated by proteasome-mediated degradation; (e) RT-qPCR analysis of WT MEFs transduced with PGC-1α - expressing adenovirus shows that PGC-1α overexpression in MEFs induces Sirt3, 4 & 5 mRNA levels; (f) Western blot analysis of MEFs overexpressing PGC-1α or GFP demonstrates that PGC-1α increases Sirt3, 4 & 5 protein abundance without affecting other sirtuins. Results are expressed as mean ± s.e.m. and are derived from three independent experiments in two MEF cell lines/genotype unless stated otherwise; t-test was used to determine statistical significance with p <0.05 considered as significant, as indicated by (*).
Fig. 4
Fig. 4. P53 regulates miRNAs to repress Sirt1, 2, 6 and 7 in cells and in liver tissue
(a) Heat map of differentially regulated miRNAs in G4/p53 +/+ (n = 5) and G4/p53 −/− (n = 6) liver tissue as determined by miRNA sequencing; (b-d) Luciferase assays using wild type 3’UTR and mutated predicted 3’ UTR sites of Sirt1, 2, 6 & 7 after transfection with miRNA mimetics in WT MEFs (3 independent experiments and triplicate readings); (e) Deletion of miR-34a in G4/miR-34a fl/fl mice after AAV-Cre injection increases Sirt1 and Sirt7 protein levels (6 mice per group were analyzed); (f, g) Inhibition of miR-26a or 145a in G4 liver tissue restores Sirt2 or Sirt6 respectively (6 mice per group were analyzed). Western blot results were quantified by densitometry. Results are expressed as mean ± s.e.m.; t-test was used to determine statistical significance with p <0.05 considered as significant, as indicated by (*).
Fig. 5:
Fig. 5:. Increasing NAD(+) concentration in G4 mice decreases acetylation levels of sirtuin targets and rescues metabolic changes in G4 liver tissue
(a) HPLC analysis shows similar NAD(+) concentration in WT or G4 livers under steady state conditions and increased NAD(+) levels after NMN treatment (6 mice per group); (b) IP-western blot analyses demonstrates decreased acetylation of sirtuin targets (p53, Sod2, Cps1, Foxo1, Pgc-1α) after NMN treatment in G4 mice (6 mice per group); (c) RT-qPCR analysis of WT and G4 liver tissue demonstrates decreased expression of p53 targets (p21, Bax, Gadd45a) in G4 mice treated with NMN (6 mice per group analyzed); (d-f) NMN administration improves mitochondrial biogenesis and function as determined by (d) increased Pgc-1α, Pgc-1β, Errα and Tfam expression, (e) elevated mitochondrial DNA copy number and (f) partial rescue of complex I and IV activity (6 mice per group were analyzed). Results are expressed as mean ± s.e.m.; t-test was used to determine statistical significance with p <0.05 considered as significant, as indicated by (*).
Fig. 6
Fig. 6. NMN treatment is associated with longer telomeres and reduced DNA damage response and rescues liver fibrosis in telomere dysfunctional mice
(a) HPLC-based determination of NAD(+) levels shows that CCL4 treatment reduces NAD(+) levels while supplementation with NMN rescues NAD(+) concentrations in liver tissues (6 mice per group analyzed); (b) Decreased collagen content in WT or G4 mice treated with NMN as determined by Sirius Red staining in CCL4 –induced fibrosis; right graph shows quantification (12 mice per group analyzed); (c, d) Western blot and immunofluorescence-based analysis of smooth muscle actin (SMA) as a marker of stellate cell activation indicates decreased stellate cell activation following NMN treatment (6 mice per group were analyzed) in CCL4 –induced fibrosis; (e) Fibrosis score in CCL4 model indicates decreased fibrosis in NMN-treated WT and G4 mice (12 mice per group); (f) Representative QFISH images of telomere intensity (red signal is telomere signal; blue is DAPI stain of nuclei) in WT or G4 hepatocytes either untreated or NMN treated and subjected to TAA – induced fibrosis; right graph shows telomere length intensity indicating significantly longer telomeres in NMN-treated G4 mice (8 mice per group were analyzed; a 60-80 nuclei per mouse were analyzed in 10 different random liver sections totaling between of 560-640 in the WT and G4 groups respectively); (g, h) p53 western blot shows significant reduction of p53 levels after NMN treatment in G4 mice and (h) reduced transcript levels of p53 targets p21, Bax and Gadd45a as determined by RT-qPCR in TAA-induced fibrosis (8 mice per group); (i) Western blot analysis of tissue from either untreated or NMN-treated WT or G4 mice subjected to TAA- shows that NMN increases Sirt1 levels in G4 mice while WT mice are not affected (representative data are shown; 8 mice per group were analyzed). Results are expressed as mean ± s.e.m.; t-test was used to determine statistical significance with p <0.05 considered as significant, as indicated by (*).
Fig. 7
Fig. 7. NMN-dependent rescue of fibrosis, telomere maintenance, suppression of DNA damage response and improvement of mitochondrial function is partially Sirt1 dependent
(a-c) Sirt1 deficiency in G4 mice significantly abrogates the beneficial effect of NMN in TAA-induced fibrosis in G4 mice as determined by (a) Sirius red staining, (b) hydroxyproline quantification and (c) fibrosis score (8 mice per group; p <0.05); (d) NMN-induced telomere length in G4 is partially Sirt1 dependent as shown by decreased telomere signal in the absence of Sirt1 in G4 mice treated with TAA; WT and Sirt1 deficient mice do not show discernable differences in telomere length with NMN; right graph shows quantification of telomere length (8 mice per group were analyzed; between 560-640 nuclei were quantified per group); (e, f) NMN-induced repression of p53 and p53 targets in G4 mice is largely Sirt1 dependent as indicated by (e) similar p53 protein levels in G4/Sirt -/mice treated with NMN compared to untreated G4/Sirt −/− untreated controls and (f) increased p53 targets (p21, Bax and Gadd45a, f) in G4/Sirt1 −/− ( 8 mice per group were analyzed); NMN-induced expression of (g) mitochondrial biogenesis factors Pgc-1α, Pgc-1β, Errα and Tfam, (h) mtDNA copy number and (i) complex I and IV activity mice is partially Sirt1 dependent in G4 mice (8 mice per group analyzed); Results are expressed as mean ± s.e.m.; t-test was used to determine statistical significance with p <0.05 considered as significant, as indicated by (*).

References

    1. AHMED W & LINGNER J 2018. PRDX1 and MTH1 cooperate to prevent ROS-mediated inhibition of telomerase. Genes Dev, 32, 658–669. - PMC - PubMed
    1. ARMANIOS M & BLACKBURN EH 2012. The telomere syndromes. Nat Rev Genet, 13, 693–704. - PMC - PubMed
    1. BAI P & CANTO C 2012. The role of PARP-1 and PARP-2 enzymes in metabolic regulation and disease. Cell Metab, 16, 290–5. - PubMed
    1. BENEKE S, COHAUSZ O, MALANGA M, BOUKAMP P, ALTHAUS F & BURKLE A 2008. Rapid regulation of telomere length is mediated by poly(ADP-ribose) polymerase-1. Nucleic Acids Res, 36, 6309–17. - PMC - PubMed
    1. CALADO RT & YOUNG NS 2009. Telomere diseases. N Engl J Med, 361, 2353–65. - PMC - PubMed

Publication types

MeSH terms