. 2019 Aug 1:196:102-113.
doi: 10.1016/j.neuroimage.2019.03.058. Epub 2019 Mar 28.

Incorporating non-linear alignment and multi-compartmental modeling for improved human optic nerve diffusion imaging

Affiliations

Incorporating non-linear alignment and multi-compartmental modeling for improved human optic nerve diffusion imaging

Joo-Won Kim et al. Neuroimage. .

Abstract

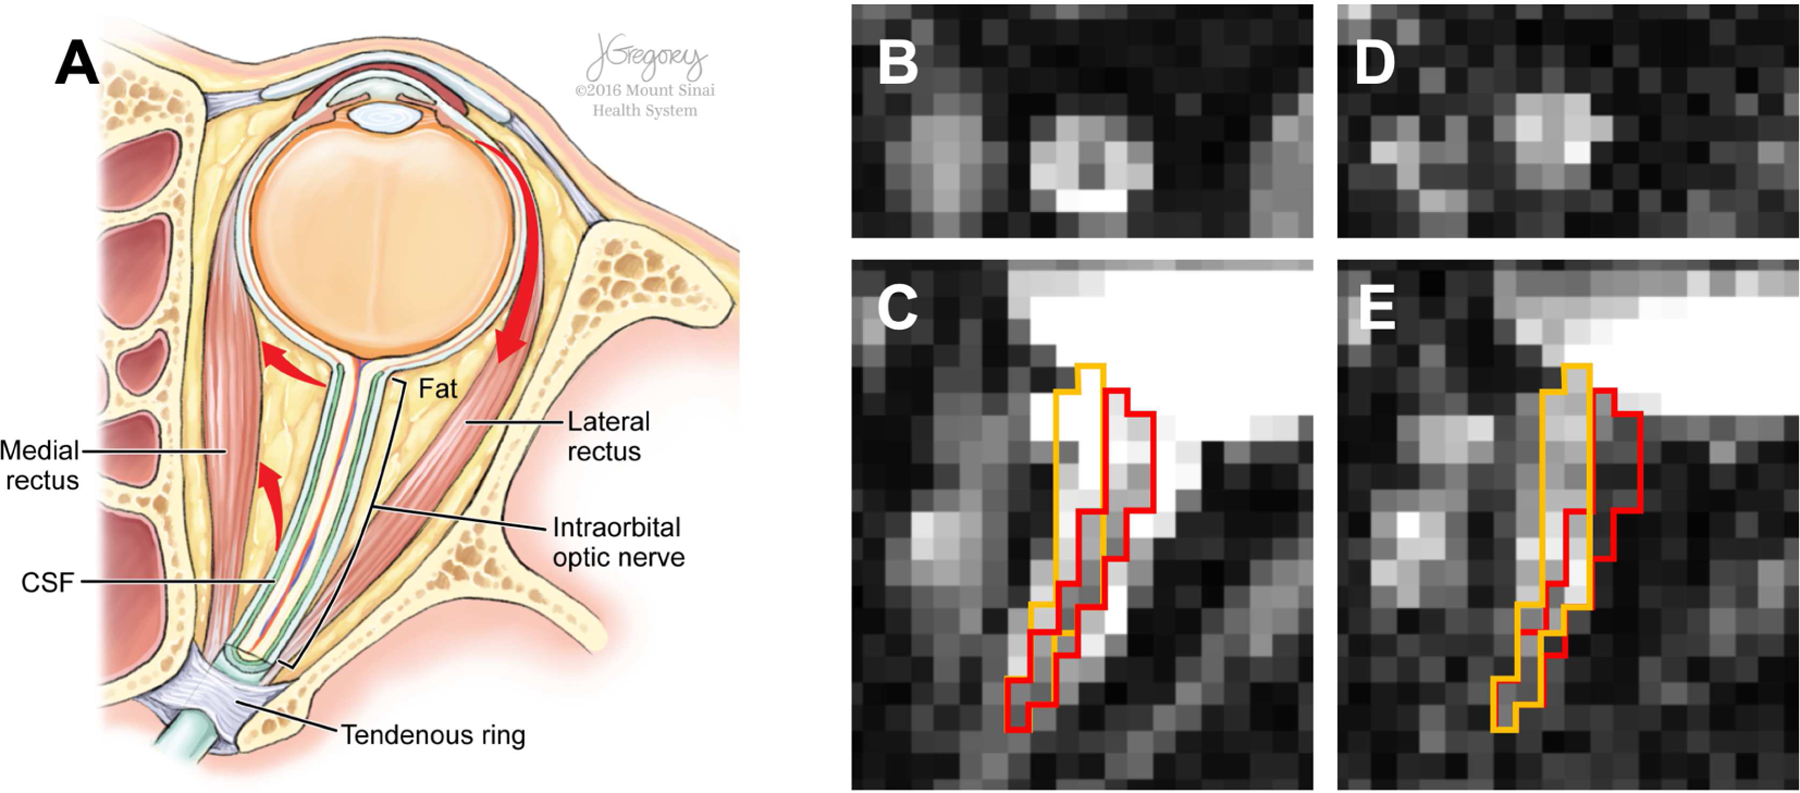
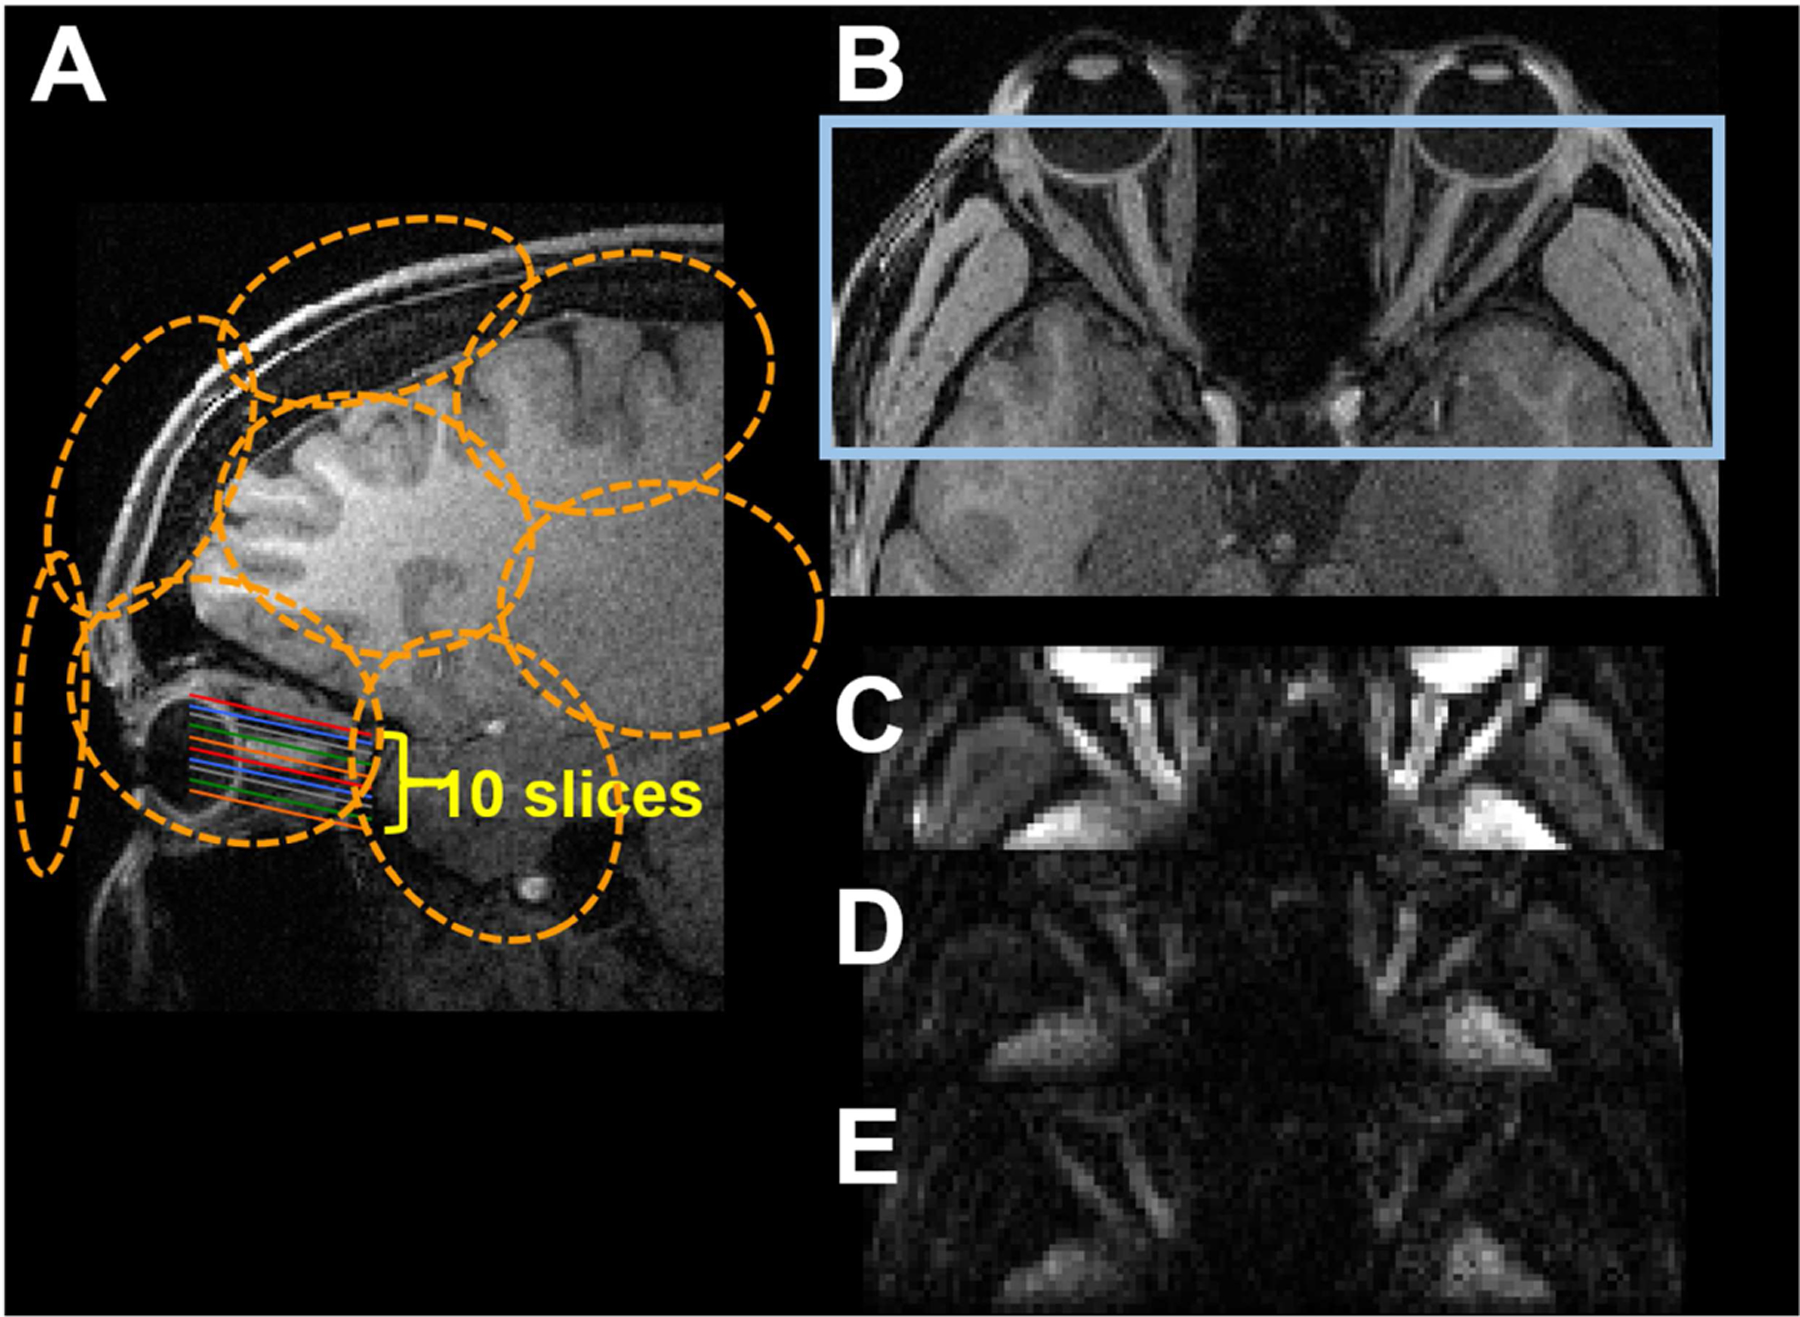
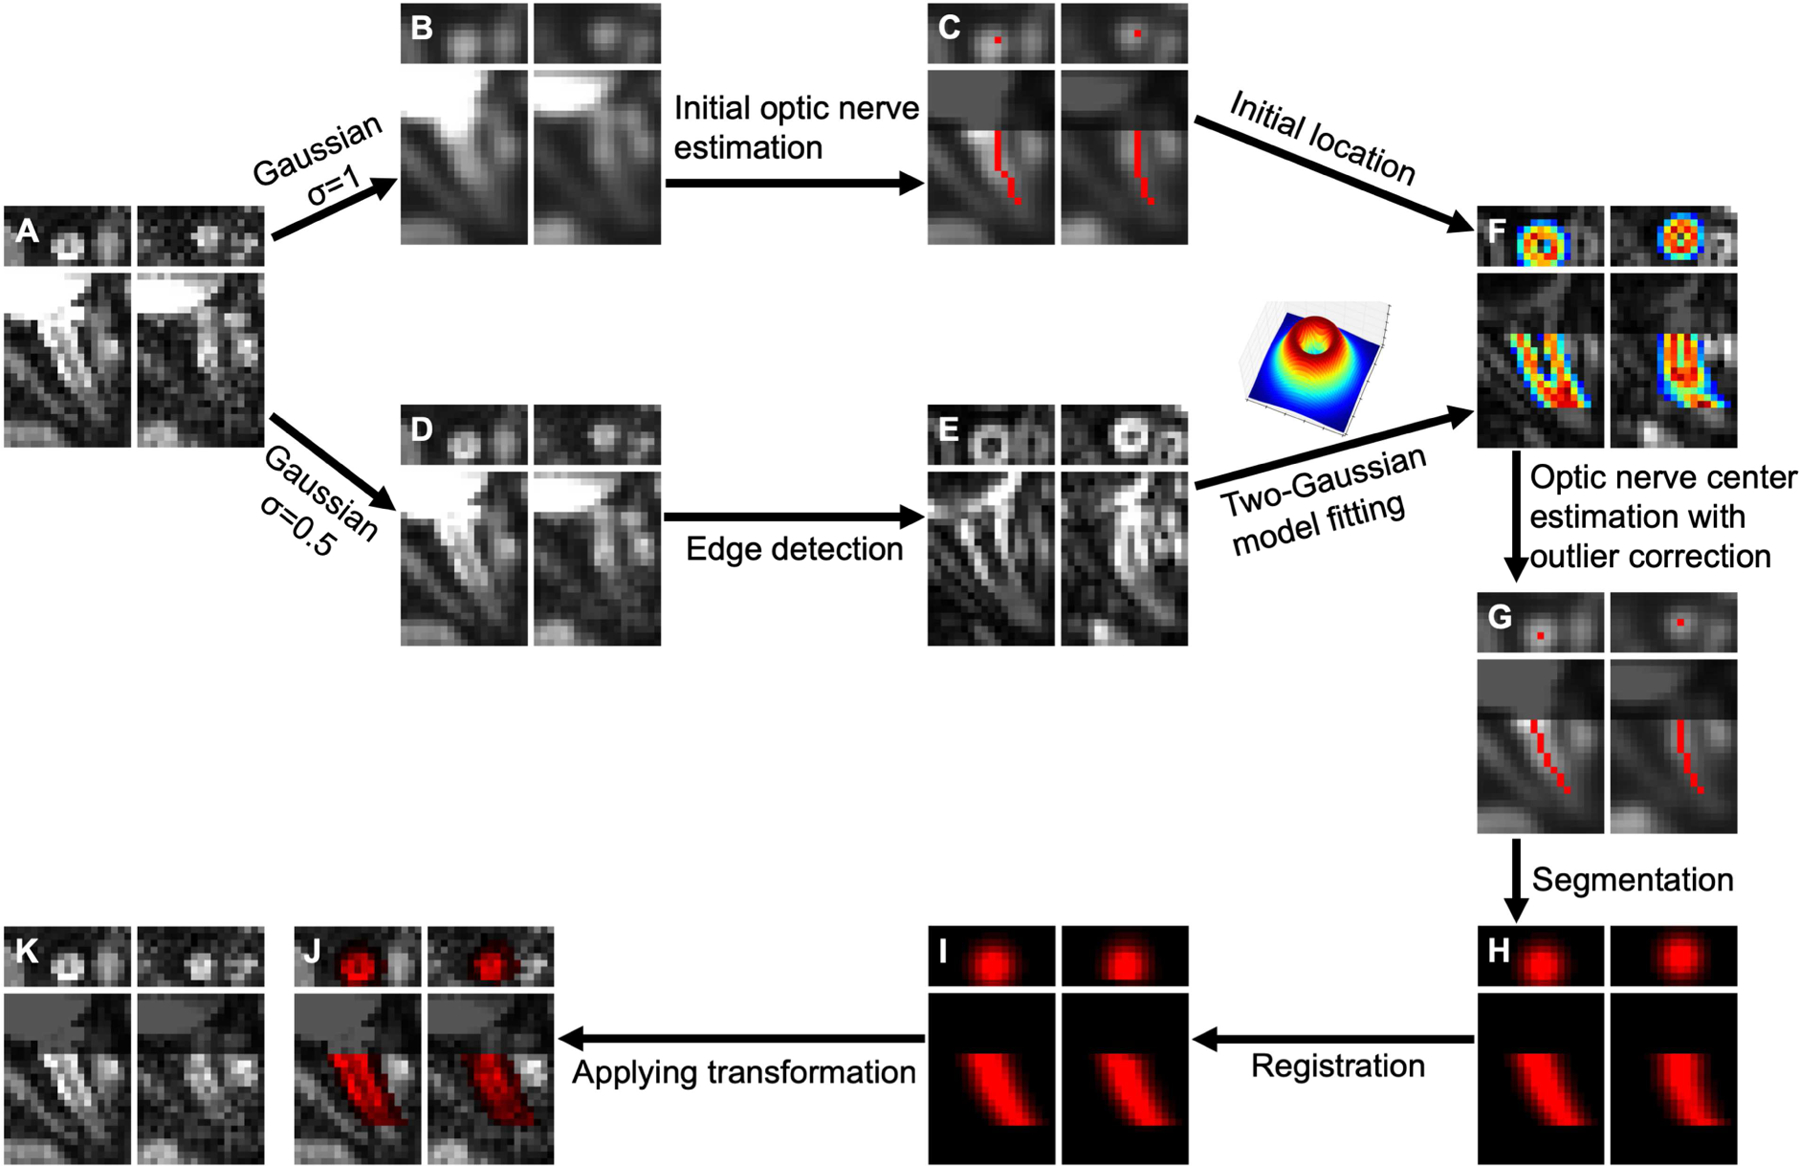
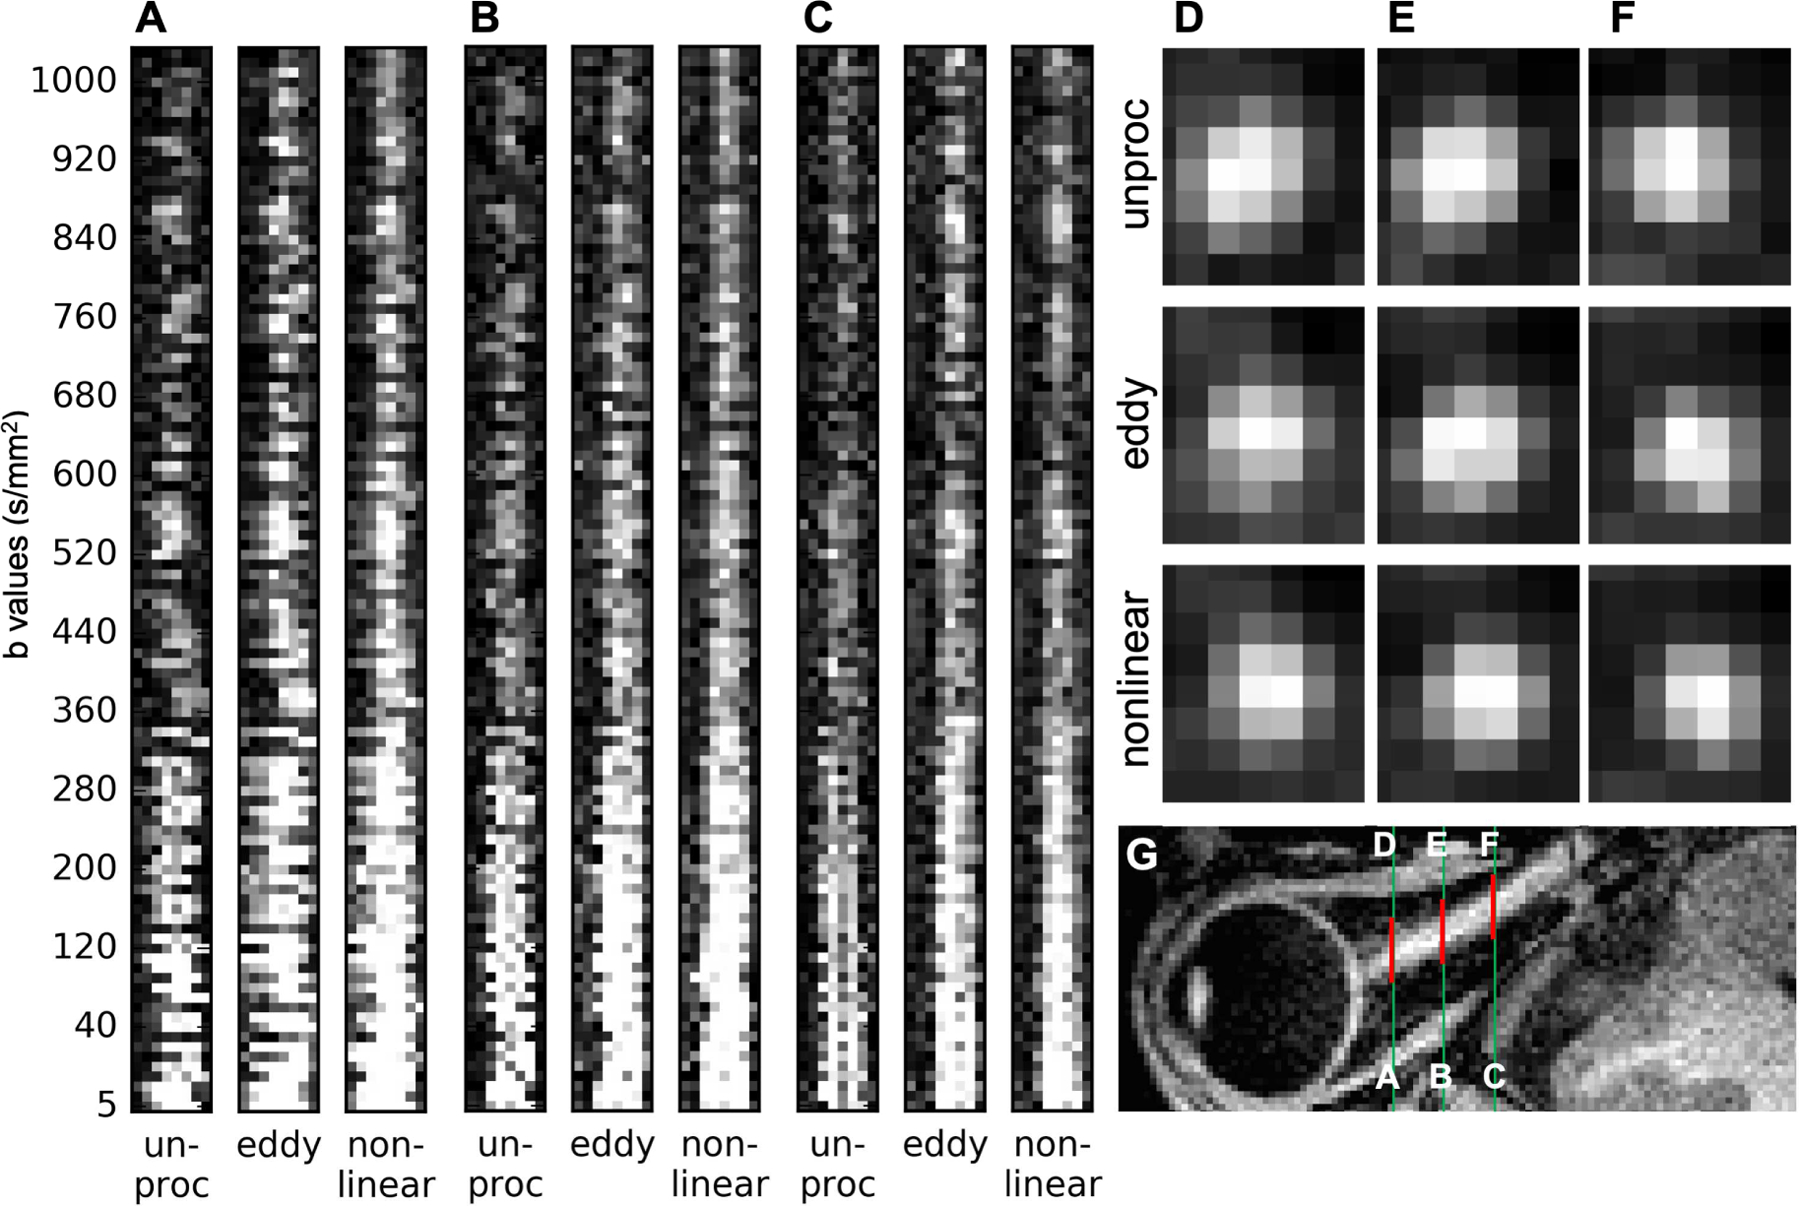
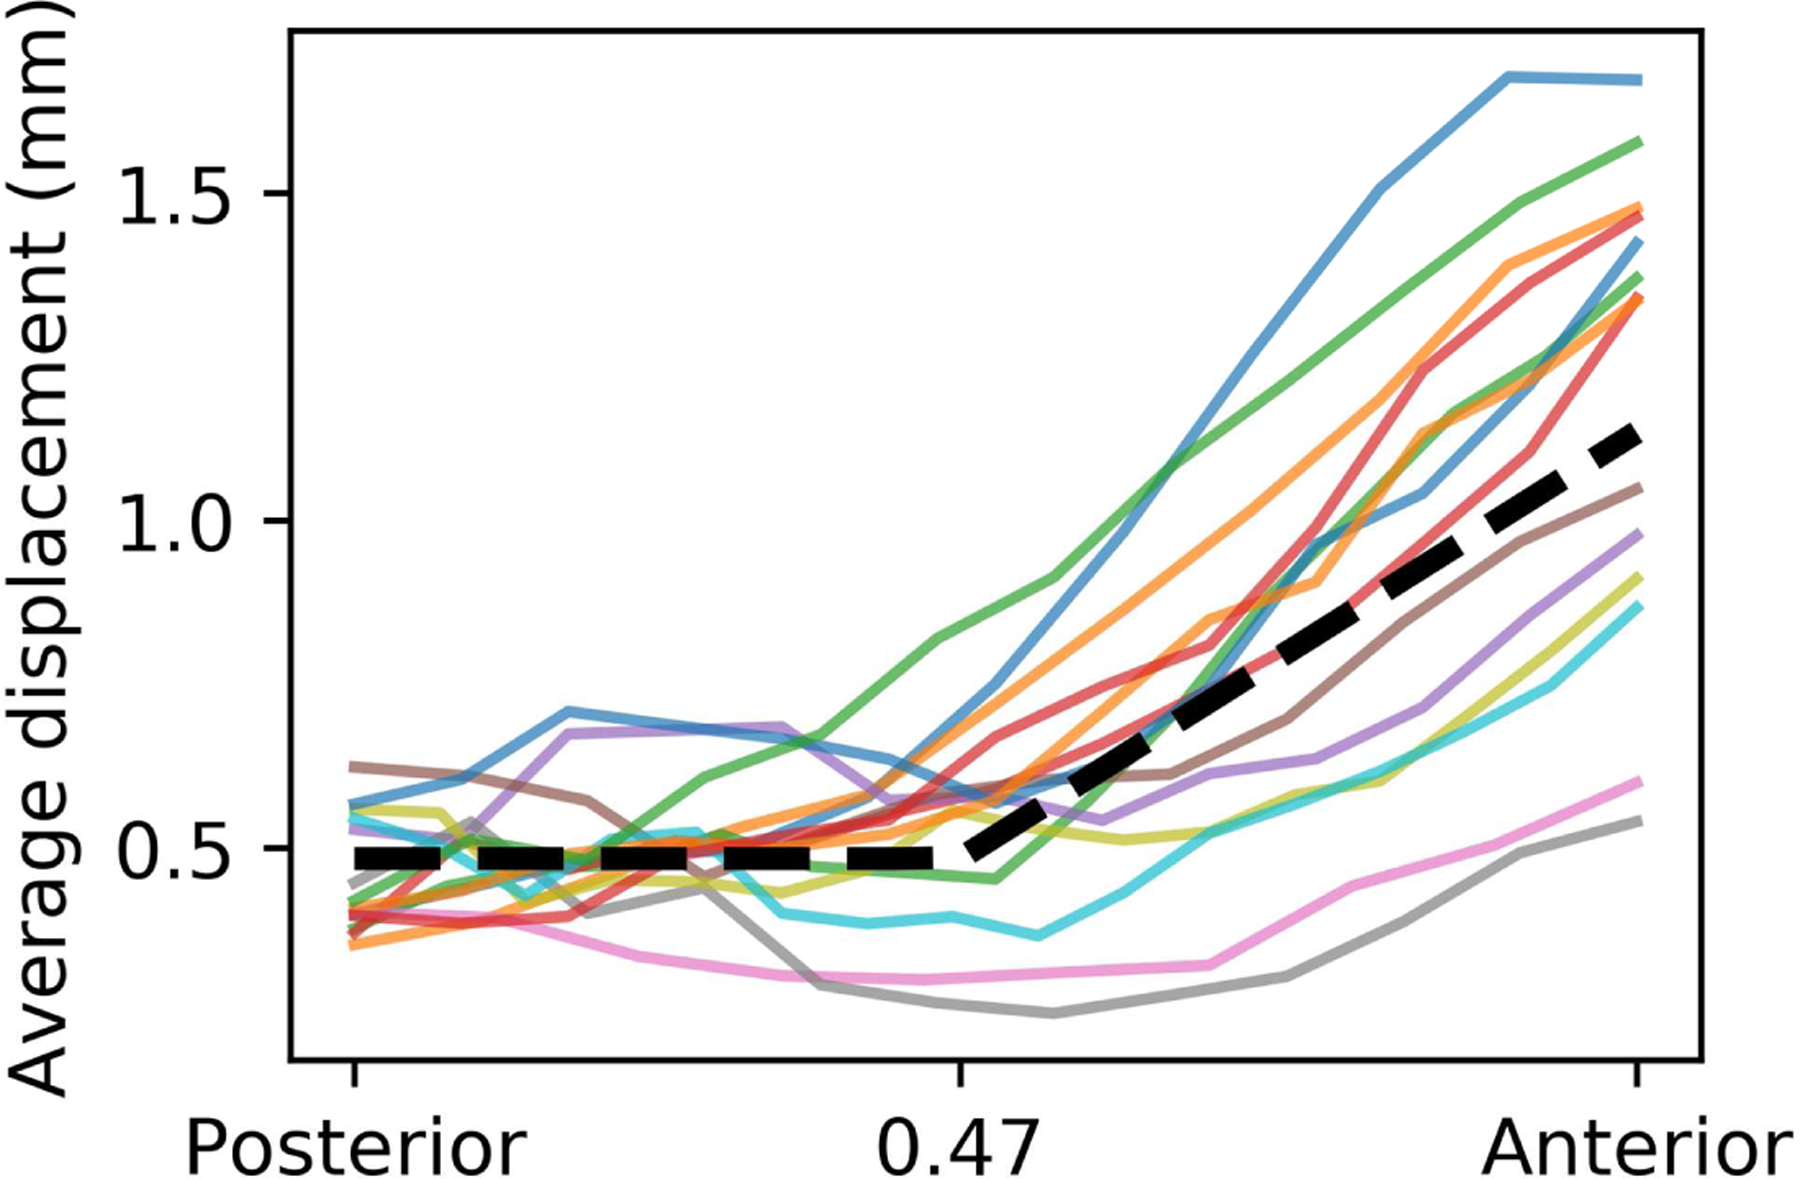
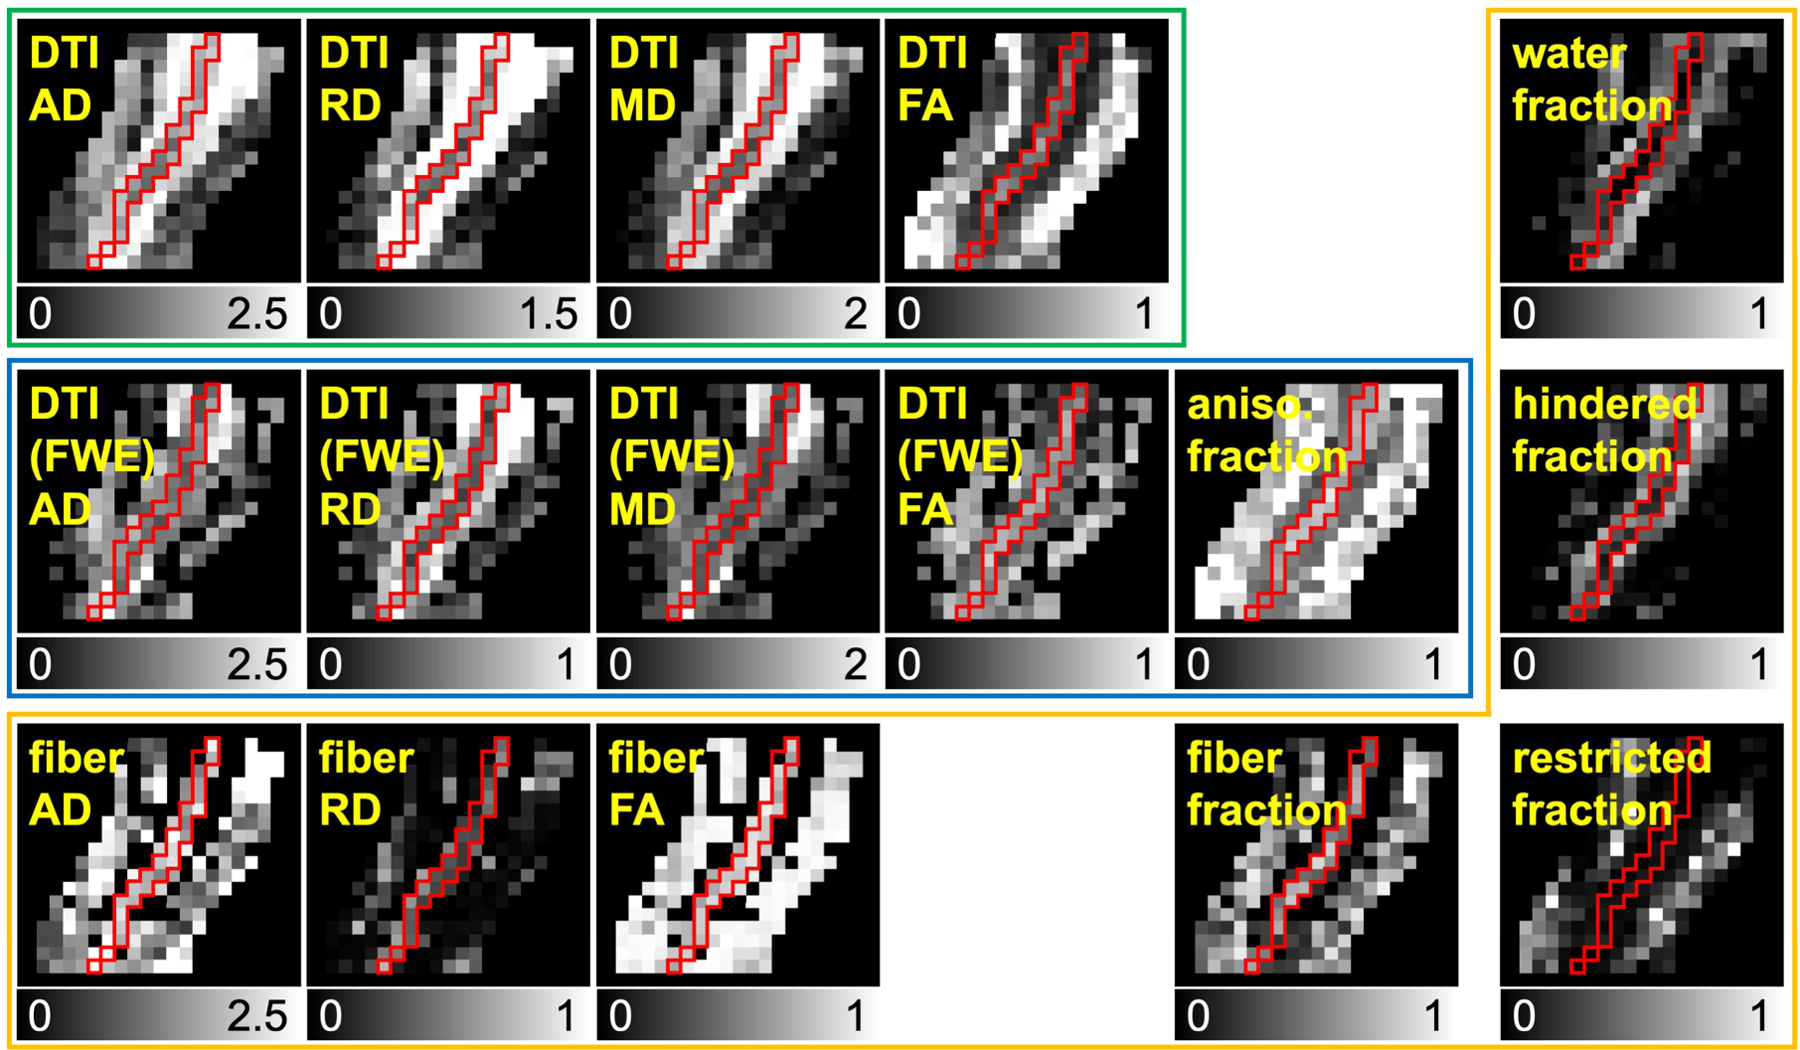
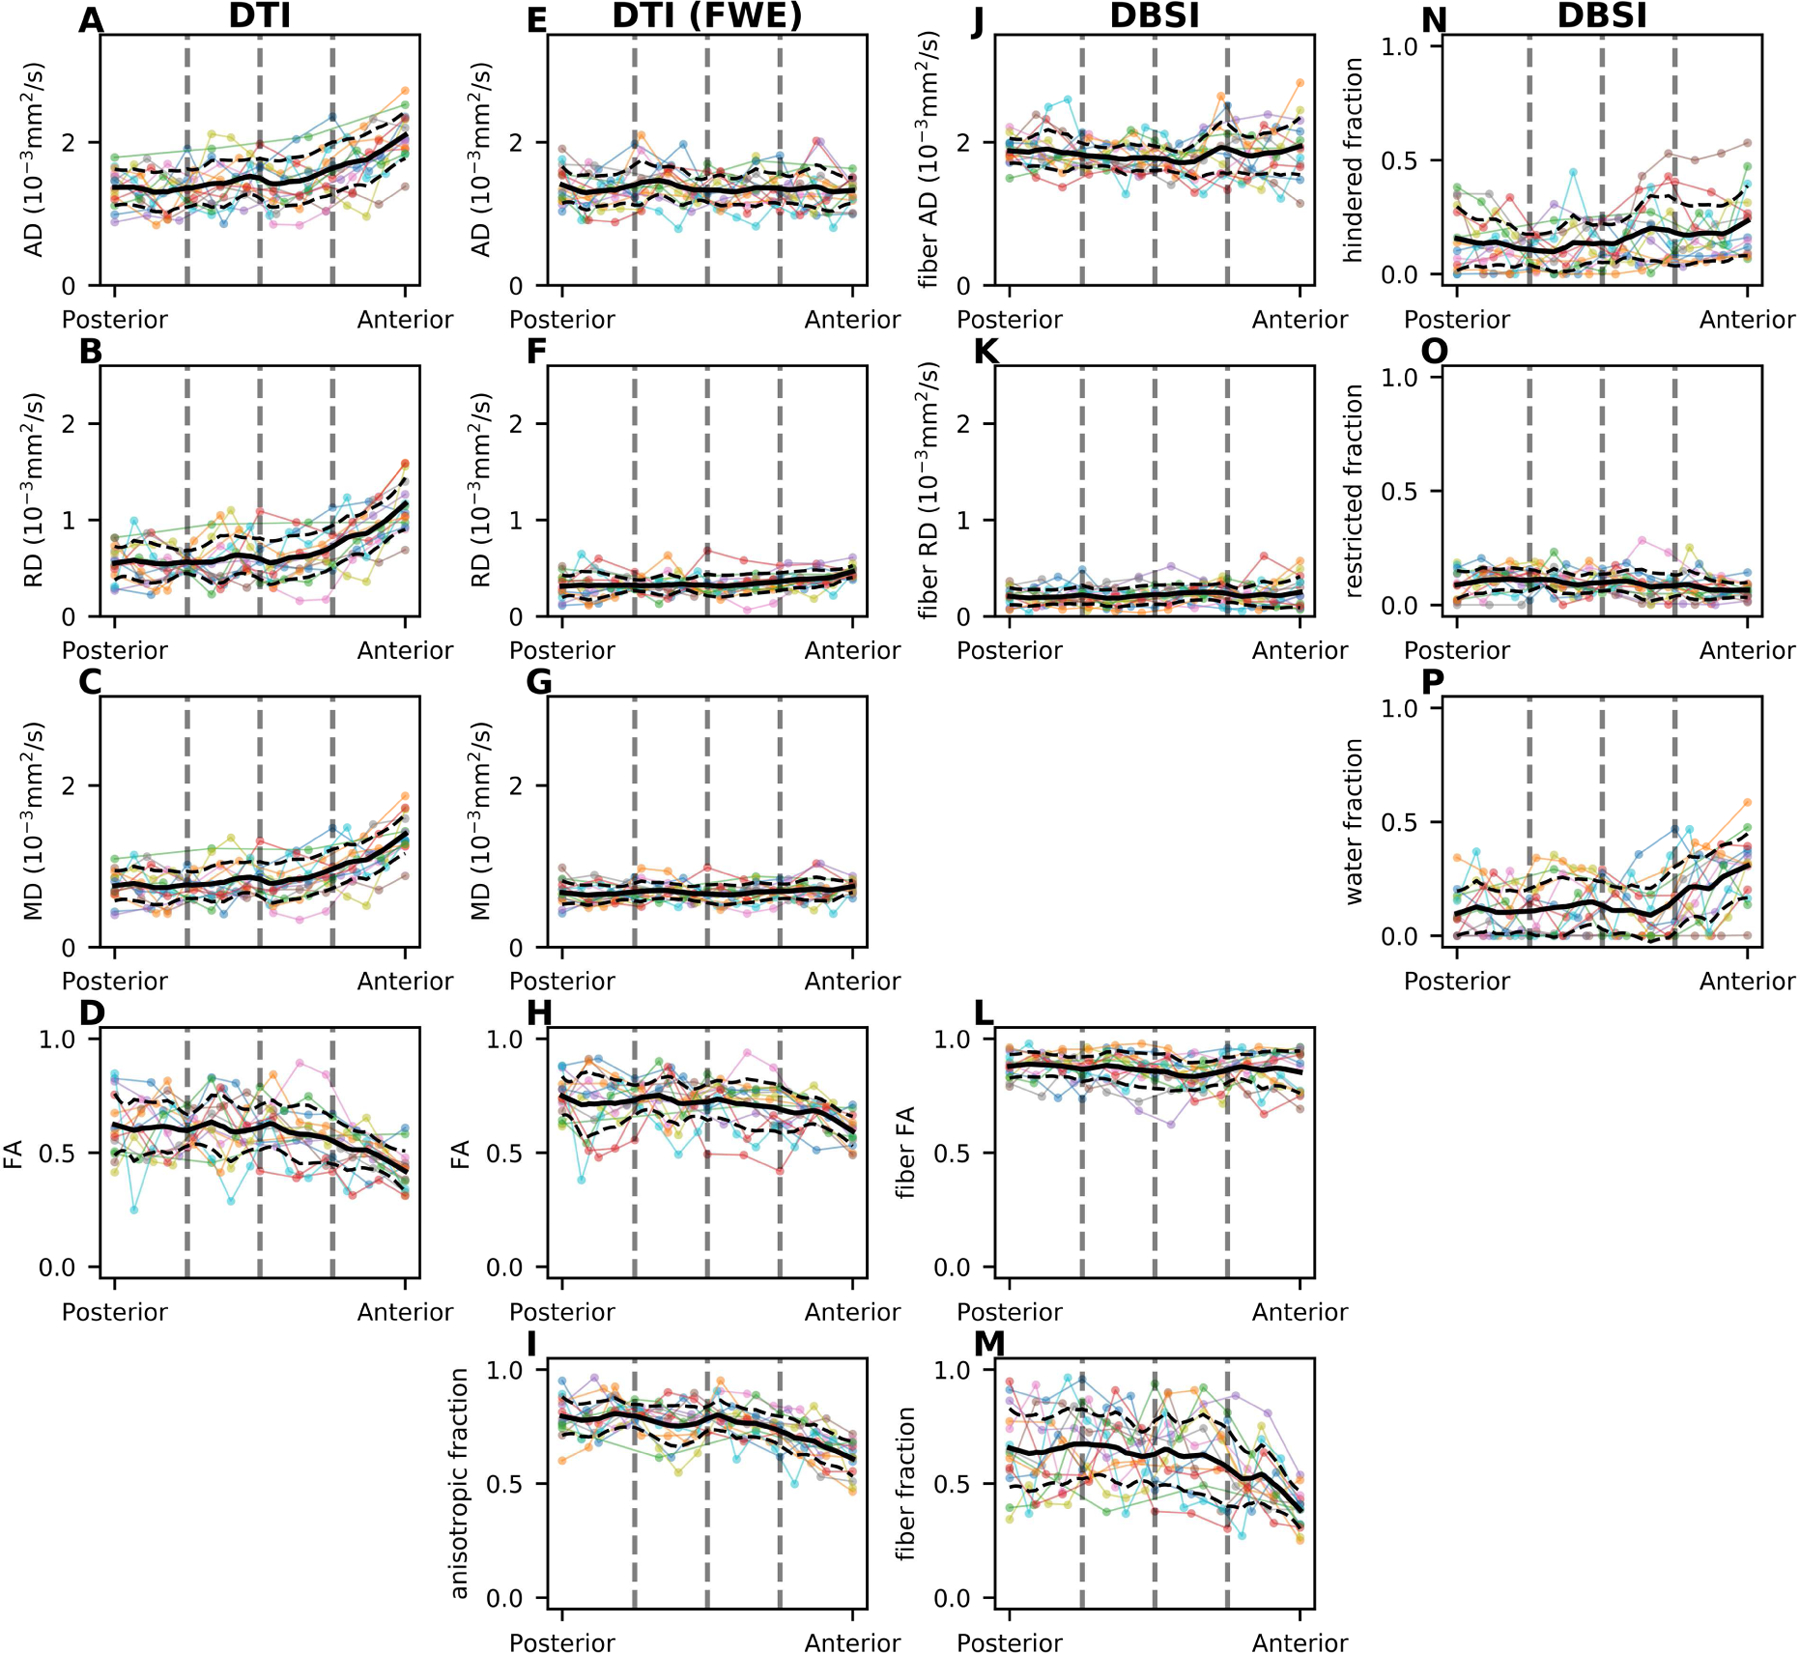
In vivo human optic nerve diffusion magnetic resonance imaging (dMRI) is technically challenging with two outstanding issues not yet well addressed: (i) non-linear optic nerve movement, independent of head motion, and (ii) effect from partial-volumed cerebrospinal fluid or interstitial fluid such as in edema. In this work, we developed a non-linear optic nerve registration algorithm for improved volume alignment in axial high resolution optic nerve dMRI. During eyes-closed dMRI data acquisition, optic nerve dMRI measurements by diffusion tensor imaging (DTI) with and without free water elimination (FWE), and by diffusion basis spectrum imaging (DBSI), as well as optic nerve motion, were characterized in healthy adults at various locations along the posterior-to-anterior dimension. Optic nerve DTI results showed consistent trends in microstructural parametric measurements along the posterior-to-anterior direction of the entire intraorbital optic nerve, while the anterior portion of the intraorbital optic nerve exhibited the largest spatial displacement. Multi-compartmental dMRI modeling, such as DTI with FWE or DBSI, was less subject to spatially dependent biases in diffusivity and anisotropy measurements in the optic nerve which corresponded to similar spatial distributions of the estimated fraction of isotropic diffusion components. DBSI results derived from our clinically feasible (∼10 min) optic nerve dMRI protocol in this study are consistent with those from small animal studies, which provides the basis for evaluating the utility of multi-compartmental dMRI modeling in characterizing coexisting pathophysiology in human optic neuropathies.

Keywords: Diffusion MRI; Motion correction; Multi-compartmental modeling; Non-linear registration; Optic nerve.


Conflict of interest statement

Conflict of interests

Dr. Naismith discloses speaking/consulting for Acorda, Alkermes, Biogen, EMD Serono, Genentech, Genzyme, Novartis.

Other authors declare no competing financial interests.

Figures

Figure 1.
Figure 1.
Illustration of anatomical structures around the human optic nerve on the axial plane (A) and optic nerve misalignment on dMRI b0 (B and C) and diffusion-weighted (D and E) volumes of oblique axial rFOV EPI dMRI acquisition in coronal (B and D) and axial (C and E) views. Red arrows (A) indicate the directions of globe and optic nerve movement resulting from lateral rectus contraction. Red and orange boundaries in C and E delineate the optic nerve location in C and E, respectively, and demonstrate the apparent optic nerve displacement between these two image volumes. Illustration (A) by Jill Gregory, printed with permission from ©Mount Sinai Health System.
Figure 2.
Figure 2.
Illustration of the rFOV optic nerve dMRI acquisition (A and B) and representative b0 (C) and diffusion weighted images with b values of 680 (D) and 1000 (E) s/mm2. Orange circles (A) illustrate the approximate location of the receive coil elements. Blue rectangle in (B) illustrates the optic nerve dMRI FOV.
Figure 3.
Figure 3.
Non-linear optic nerve registration scheme with representative results. Each plot consists of coronal (top row) and axial (bottom row) views of a b0 volume (left column) and a diffusion-weighted volume (right column). A: image before registration, B: Gaussian-filtered (σ = 1 voxel) image, C: initial optic nerve estimation (red curves) on B, D: Gaussian-filtered (σ = 0.5 voxel) image, E: edge detection using a Sobel filter on D, F: two-Gaussian model fitting on C and E, G: optic nerve center (red dots and curves), H: non-binary optic nerve segmentation using a Gaussian function center at the optic nerve center, I: registration of optic nerve segmentation, J: registration result of A with registered optic nerve segmentation (red overlay), K: final registration result. Note that the grayed regions (C, F, G, J, K) near the globe in the axial views were for illustration purpose to avoid distraction from misalignment beyond the anterior end of the optic nerve estimation.
Figure 4.
Figure 4.
Representative registration comparison of unprocessed (unproc), after topup and eddy (eddy), and after non-linear registration (non-linear), at three optic nerve locations (A-F), using zoomed-in (Inline Supplementary Figure 2. A-C, yellow boxes) vertically stacked line profiles (left-right) of every volume ordered by b values (A-C) and representative average high-b-value (> 400 s/mm2) volumes in coronal views (D-F, the same locations as A-C), in which more spatially constrained higher image intensity represents better-registered optic nerve center. Slight image blurring can be appreciated after non-linear registration (A-C, non-linear). Green lines in the corresponding axial slice of T1w image (G) are the same locations as in Inline Supplementary Figure 2 and red lines (G) indicate the zoomed regions. Note that the apparently aligned CSF-to-optic nerve contrast in the low b value volumes in C (unproc) does not reflect the misalignment of the optic nerve in the other dimensions. Also, note that the low optic nerve signal intensity in many unprocessed volumes (A-C, unproc) was mainly due to the optic nerve movement out of the shown line profiles. The remaining low signal intensity volume after non-linear registration (A-C, non-linear) was either due to the applied diffusion encoding vector parallel to the optic nerve orientation or artifactual signal dropout.
Figure 5.
Figure 5.
Average optic nerve displacement as a function of posterior-anterior location. Each solid curve represents one optic nerve’s displacement, averaged over all dMRI volumes (displacement in individual volume could be much larger). The axis ranges from 0 (posterior optic nerve point, near the tendinous ring) to 1 (optic nerve head). The dashed black line represents the step-wise fitting.
Figure 6.
Figure 6.
Representative dMRI metric maps derived from non-linearly aligned dMRI data. The maps inside green, blue, and orange boxes are from DTI, DTI with free water elimination (FWE), and DBSI, respectively. Red boundaries represent the optic nerve location. The grayscales range from 0 to 1 for fractional anisotropy and fraction (i.e., compartment ratio) maps, 0 to 2.5 µm2/ms for AD, 0 to 2 µm2/ms for MD, 0 to 1.5 µm2/ms for DTI RD, and 0 to 1 µm2/ms for DTI (FWE) and DBSI RD.
Figure 7.
Figure 7.
Spatial distribution of the DTI (A-D), DTI with free water elimination (FWE) (E-I), and DBSI (J-P) map values from posterior to anterior of the intraorbital optic nerve. Each colored line represents dMRI measurement in optic nerve center voxel from one eye. Solid and dashed black lines represent the mean and standard deviation, respectively, along the nerve location in the axis, ranging from the posterior optic nerve point (posterior) to the optic nerve head (anterior). The dashed gray vertical lines indicate quartiles of coronal location (see §2.7).

References

    1. Adhi M, Duker JS, 2013. Optical coherence tomography--current and future applications. Curr. Opin. Ophthalmol 24, 213–221. - PMC - PubMed
    1. Andersson JLR, Graham MS, Drobnjak I, Zhang H, Campbell J., 2018. Susceptibility-induced distortion that varies due to motion: Correction in diffusion MR without acquiring additional data. NeuroImage 171, 277–295. - PMC - PubMed
    1. Andersson JLR, Skare S, Ashburner J., 2003. How to correct susceptibility distortions in spin-echo echo-planar images: application to diffusion tensor imaging. NeuroImage 20, 870–888. - PubMed
    1. Andersson JLR, Sotiropoulos SN, 2016. An integrated approach to correction for off-resonance effects and subject movement in diffusion MR imaging. NeuroImage 125, 1063–1078. - PMC - PubMed
    1. Avants BB, Epstein CL, Grossman M, Gee JC, 2008. Symmetric diffeomorphic image registration with cross-correlation: Evaluating automated labeling of elderly and neurodegenerative brain. Med. Image Anal, Special Issue on The Third International Workshop on Biomedical Image Registration – WBIR 2006 12, 26–41. - PMC - PubMed

Publication types