. 2019 Mar 15:10:457.
doi: 10.3389/fimmu.2019.00457. eCollection 2019.

Crucial Role of Increased Arid3a at the Pre-B and Immature B Cell Stages for B1a Cell Generation

Affiliations

Crucial Role of Increased Arid3a at the Pre-B and Immature B Cell Stages for B1a Cell Generation

Kyoko Hayakawa et al. Front Immunol. .

Abstract

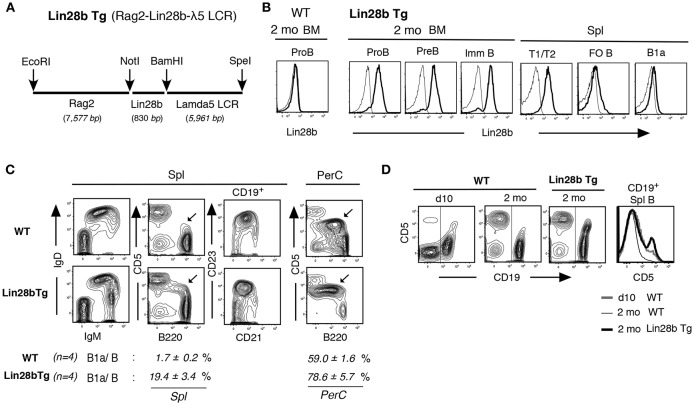
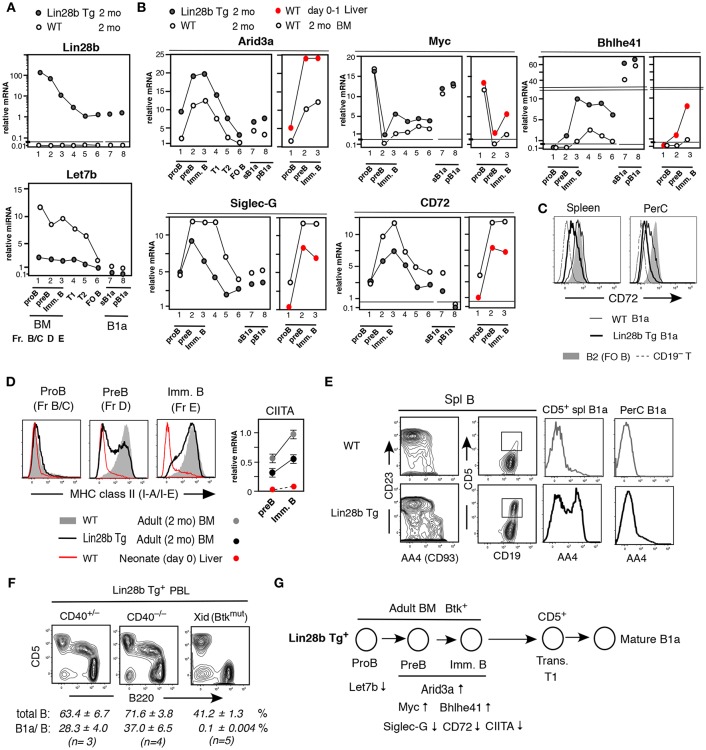
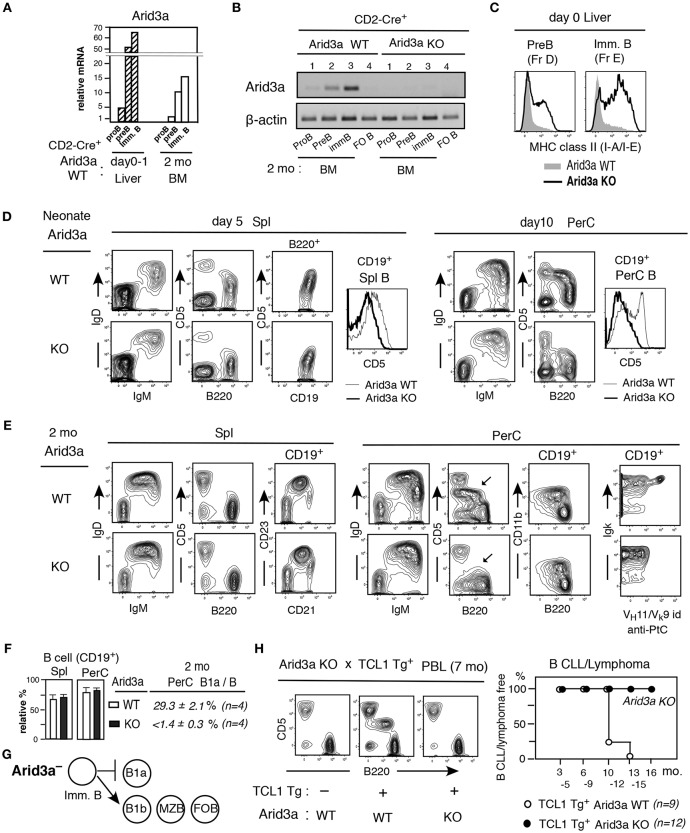
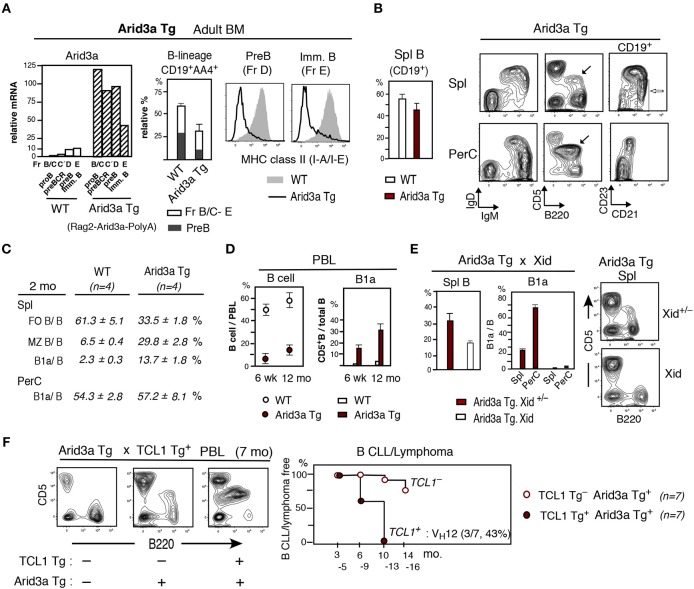
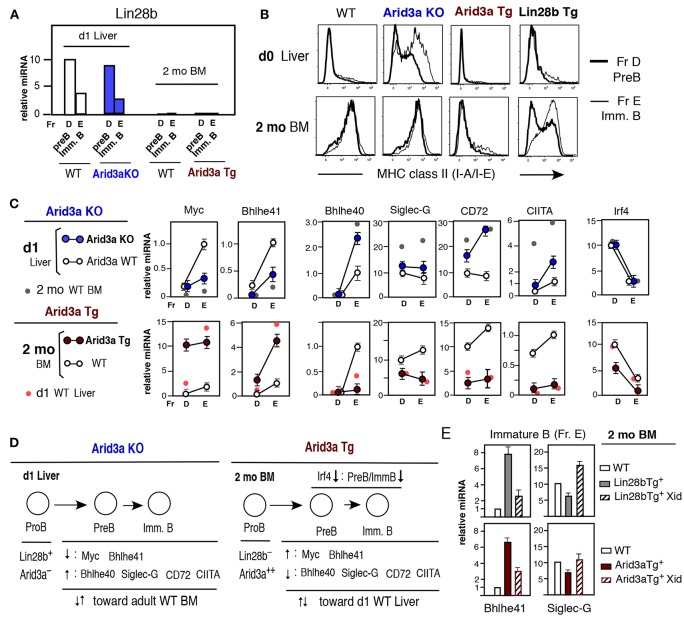
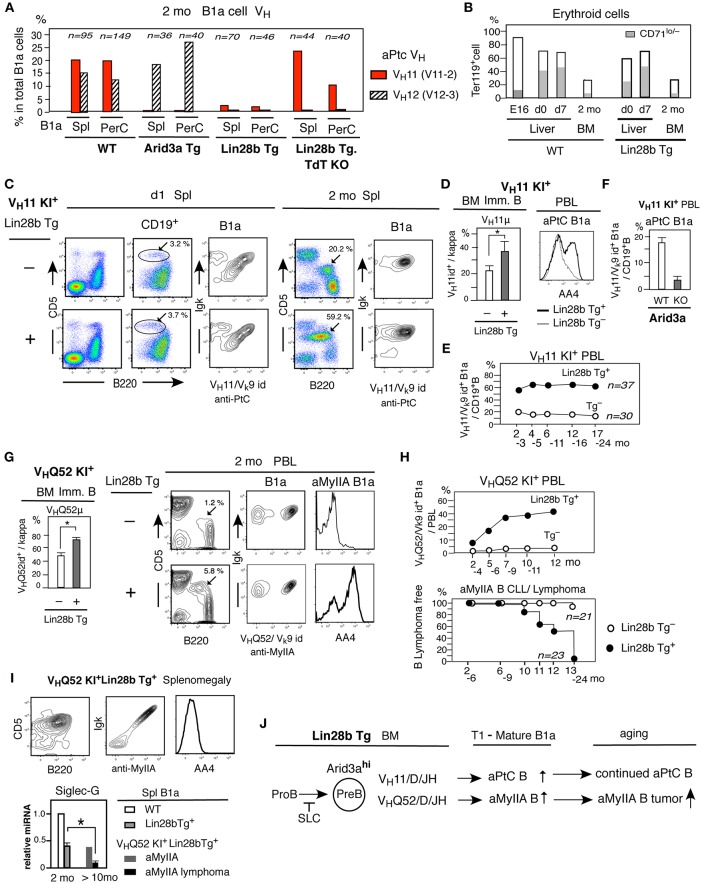
The Lin28b+Let7- axis in fetal/neonatal development plays a role in promoting CD5+ B1a cell generation as a B-1 B cell developmental outcome. Here we identify the Let7 target, Arid3a, as a crucial molecular effector of the B-1 cell developmental program. Arid3a expression is increased at pro-B cell stage and markedly increased at pre-B and immature B cell stages in the fetal/neonatal liver B-1 development relative to that in the Lin28b-Let7+ adult bone marrow (BM) B-2 cell development. Analysis of B-lineage restricted Lin28b transgenic (Tg) mice, Arid3a knockout and Arid3a Tg mice, confirmed that increased Arid3a allows B cell generation without requiring surrogate light chain (SLC) associated pre-BCR stage, and prevents MHC class II cell expression at the pre-B and newly generated immature B cell stages, distinct from pre-BCR dependent B development with MHC class II in adult BM. Moreover, Arid3a plays a crucial role in supporting B1a cell generation. The increased Arid3a leads higher Myc and Bhlhe41, and lower Siglec-G and CD72 at the pre-B and immature B cell stages than normal adult BM, to allow BCR signaling induced B1a cell generation. Arid3a-deficiency selectively blocks the development of B1a cells, while having no detectable effect on CD5- B1b, MZ B, and FO B cell generation resembling B-2 development outcome. Conversely, enforced expression of Arid3a by transgene is sufficient to promote the development of B1a cells from adult BM. Under the environment change between birth to adult, altered BCR repertoire in increased B1a cells occurred generated from adult BM. However, crossed with B1a-restricted VH/D/J IgH knock-in mice allowed to confirm that SLC-unassociated B1a cell increase and CLL/lymphoma generation can occur in aged from Arid3a increased adult BM. These results confirmed that in fetal/neonatal normal mice, increased Arid3a at the pre-B cell and immature B cell stages is crucial for generating B1a cells together with the environment for self-ligand reactive BCR selection, B1a cell maintenance, and potential for development of CLL/Lymphoma in aged mice.

Keywords: Arid3a; B-1 development; B1a; CLL/lymphoma; Lin28b.


Figures

Figure 1
Figure 1
Increased B1a cells in Lin28b Tg mice. (A) Rag2-Lin28b-λ5 LCR construct for B lymphoid restricted Lin28b Tg expression. (B) Cytoplasmic staining of 2 mo Lin28b Tg (and WT) BM B-lineage and spleen transitional T1/T2, FO B, and B1a cells. Rabbit anti-Lin28b + anti-rabbit Ab staining (high black), vs. anti-rabbit alone (–) as a control. WT mouse B-lineage and B cells were all Lin28b negative. (C) 2 mo adult Lin28b Tg and WT mouse spleen and PerC. B220loCD5+ B1a cells are marked. B1a/B; percentage of B1a cells in total B cells. B1a cell increase was also observed in Lin28b Tg.B6 (C57BL/6) mice. (D) CD5 level comparison in spleen B cells (CD19+, marked) between WT (d10 and 2 mo) and Lin28b Tg (2 mo) mice.
Figure 2
Figure 2
Pre-B and immature B cells in adult Lin28b Tg BM resembles WT fetal/neonatal liver and generate B1a cells. (A,B) qRT-PCR. Adult (2 mo) Lin28b Tg mouse B lineage in BM, B cells in spleen, and B1a cells in spleen (sB1a) and in PerC (pB1a), in comparison to WT mice. (B) Addition of qRT-PCR of WT mouse neonatal (d0-1) liver vs. adult BM B-lineage. The results shown represent the mean of three independent determinations. Samples under the same mouse background showed similar mRNA levels (and mirRNAs). (C) CD72 staining of WT and Lin28b Tg mouse B1a cells in spleen and PerC, and WT B2 cells (FO B cells in spleen). (D) Left; MHC class II staining of pro-B, pre-B, and immature B cells in 2 mo WT and Lin28b Tg BM, and WT d0 liver. Right; CIITA qRT-PCR. n = 3 each; mean ± s.e. (E) Comparison of AA4+ transitional stage in spleen B cells. AA4 level in CD19+CD5+ B cells in spleen (square region) and PerC, in Lin28b Tg and WT mice. (F) PBL analysis of 2 mo Lin28b Tg mice crossed with CD40 KO mice, and with Xid mice. Total B; CD19+, B1a/B; B220loCD5+B in total B. (G) Forced expression of Lin 28b Tg in adult BM led to the indicated gene expression changes in pre-B and immature B cells, resembling that of fetal/neonate mice, and increasing the ability to generate B1a cells.
Figure 3
Figure 3
Arid3a KO mice exhibit adult-type B cell development without B1a cell generation. (A) Arid3a qRT-PCR of B-lineage in CD2-Cre+ Arid3a WT mice in d0-1 liver and 2 mo BM. n = 2 each; mean. (B) Arid3a PCR of 2 mo BM B-lineage and spleen FO B cells in CD2-Cre+ Arid3a WT and KO littermates. (C) MHC class II staining of pre-B and immature B cells in d0 Arid3a KO and WT littermates. Represent of 3 mice each. All showed similar increases in Arid3a KO compared to WT. (D) Neonatal spleen (day 5) and PerC (day 10) analysis of Arid3a KO and WT littermates, and CD5 level comparison in B cells (CD19+). Three mice each showed similar results. (E,F) Adult (2 mo) Arid3a KO and WT spleen and PerC analysis. B1a cells in PerC are marked. Percentage of total B cells in spl and PerC in lymphoid area (n = 4 each; mean ± s.e.) and B1a cells in total B cells in PerC. (G) Arid3a deficient mouse generates B1b, MZ B, and FO B cells, and loss of B1a cell generation. (H) PBL crossed with TCL1 Tg-CD2-Cre+ mice. CLL/lymphoma incidence difference in TCL1 Tg expressing Arid3a KO vs WT littermates.
Figure 4
Figure 4
Arid3a Tg mice show reduction of adult BM B cell generation and B1a cell CLL/lymphoma generation in aged mice. (A) Adult Arid3a Tg (Rag2-Arid3a-PolyA)+ and Arid3a Tg (WT) mouse BM. Left: qRT-PCR of 2 mo adult B-lineage (including pre-BCR, Fr.C'). n = 2 each; mean. Middle: relative total CD19+AA4+ B-lineage (without large myeloid cells) and pre-B cell percentages in 2–4 mo BM. n = 4 each; mean ± s.e. Right: MHC class II staining of pre-B and immature B cells. Representative of 2–4 mo 4 mice each (Arid3a Tg mice were all negative). 2 mo Arid3a Tg.B6 mice also showed decreased total B-lineage and MHC class II in BM. (B) Left: Spleen B cell (CD19+) percentage in adult (2–4 mo) Arid3a Tg and WT mice. n = 4 each; mean ± s.e. Right: 2 mo Arid3a Tg mouse spleen and PerC. B1a cells are marked (black) and MZ B cells are marked (white). (C) Percentage of FO B, MZ B and B1a cells in total B cells. (D) PBL B cell percentage, and B1a cells in total PBL B cells of Arid3a Tg+ and Arid3a Tg (WT) mice at 6 wk and 12 mo. n = 6 each; mean ± s.e. (E) Arid3a Tg mice crossed with Xid mice. 2 mo Arid3a Tg+ littermates. n = 3 each; mean ± s.e. Xid = homozygous BtkXid (F) Arid3a Tg mice crossed with TCL1 Tg mice, and PBL analysis. High CLL/lymphoma incidence in TCL1 Tg+ (including aPtC VH12+ BCR lymphoma) vs. TCL1 Tg Arid3a Tg mice.
Figure 5
Figure 5
Altered Arid3a level impacts levels of various mRNAs at the pre-B and immature B cell stages in neonatal liver and adult BM. (A) Lin28b qRT-PCR of pre-B and immature B cells in d1 liver Arid3a KO and Arid3a WT mice, and 2 mo BM Arid3a Tg+ and Tg WT mice. Two to three mice each. Lin28b expression in d1 liver and lack in adult BM were all similar. (B) MHC class II staining of d0 liver and 2 mo BM pre-B and immature B cells in WT, Arid3a KO, Arid3a Tg, and Lin28b Tg mice. (C) qRT-PCR of pre-B and immature B cells. d1 liver; Arid3a KO mice (n = 3, mean ± s.e.) and Arid3a WT mice (n = 2, mean ± s.e.) and addition of 2 mo normal mouse (WT C57BL/6) BM (n = 2, mean) for comparison. 2 mo BM; Arid3a Tg (n = 4, mean ± s.e.) and Arid3a Tg (WT) (n = 3, mean ± s.e.), and addition of d1 normal mouse liver (n = 2, mean). (D) Summary of alteration of Arid3a KO d1 liver mRNAs and Arid3a Tg 2 mo BM mRNAs. (E) Lin28b Tg and Arid3a Tg mice were crossed with Xid mice. Bhlhe41 and Siglec-G mRNA comparison in immature B cells (Fr. E) with or without Xid, and normal WT immature B cells as a control, in 2 mo BM mice. n = 3 each; mean ± s.e.
Figure 6
Figure 6
SLC unassociated BCR B1a cell generation from adult Lin28b Tg BM and B1a lymphoma generation in aged mice. (A) Single cell sequence data of B1a cells in spleen and PerC in 2 mo WT (C.B17), Arid3a Tg, Lin28b Tg, and Lin28b Tg with TdT KO mice, and percentage of VH11+ and VH12+ B cells. (B) Percentage of erythroid cell (Ter119+) together with matured erythrocytes (Ter119+CD71lo/−) in WT and Lin28b Tg+ mice. WT mice; liver n = 2 each, 2 mo BM n = 5, mean. Lin28b Tg+ mice; liver and 2 mo BM n = 3 each, mean. (C) Lin28b Tg mice crossed with VH11 KI mice. B1a cell frequency in d1 and 2 mo spleen (marked), and VH11+aPtC cell dominance in B1a cells. (D) Left; 2 mo BM VH11μ+ cell percentage in immature B cells in VH11 KI mice with or without Lin28b Tg. n = 3 each; mean ± s.e. *P < 0.05. Right; AA4 staining of aPtC B1a cells in PBL (2 mo). (E) VH11+ aPtC B1a cell percentage in PBL B cells with or without Lin28b Tg. Mean of Lin28b Tg+ mice (n = 37) and Lin28b Tg mice (n = 30) origin. (F) VH11 KI.B6 mice crossed with mice to generate Arid3a KO and WT. VH11+ aPtC B1a cells in PBL B cells in 2 mo Arid3a KO (n = 4) and WT (n = 5) littermates; mean ± s.e. (G) Lin28b Tg mice crossed with VHQ52 KI mice. Left; 2 mo BM VHQ52μ+ cell percentage in immature B cells in VHQ52 KI mice with or without Lin28b Tg. n = 3 each; mean ± s.e. *P < 0.006. Right; 2 mo PBL. B1a cell percentage (marked) with aMyIIA and AA4 staining. (H) Up; aMyIIA B1a cell frequency in PBL in VHQ52 KI mice with Lin28b Tg+(n = 23) and Tg mice (n = 21) origin. Bottom; aMyIIA B1a cell CLL/lymphoma incidence. (I) Spleen in 14 mo VHQ52 KI+Lin28b Tg+ mouse with splenomegaly. Bottom; Siglec-G qRT-PCR of spleen B1a cells. 2 mo WT and Lin28b Tg. (n = 3 each) and >10 mo non-lymphoma (n = 1), and lymphoma (n = 3) aMyIIA B1a. mean ± s.e. *P < 0.016. (J) Arid3a involvement in adult Lin28b Tg BM to increase SLC unassociated aPtC and aMyIIA autoreactive B1a cell generation.

References

    1. Shyh-Chang N, Daley GQ. Lin28: primal regulator of growth and metabolism in stem cells. Cell Stem Cell. (2013) 4:395–406. 10.1016/j.stem.2013.03.005 - DOI - PMC - PubMed
    1. Yang XO, Angkasekwinai P, Zhu J, Peng J, Liu Z, Nurieva R, et al. Requirement for the basic helix-loop-helix transcription factor Dec2 in initial TH2 lineage commitment. Nat Immunol. (2009) 12:1260–6. 10.1038/ni.1821 - DOI - PMC - PubMed
    1. Zhou Y, Li YS, Rao Bandi S, Tang L, Shinton SA, Hayakawa K, et al. Lin28b promotes fetal B lymphopoiesis through the transcription factor Arid3a. J Exp Med. (2015) 212:569–80. 10.1084/jem.20141510 - DOI - PMC - PubMed
    1. Hardy RR, Hayakawa K. B cell development pathways. Annu Rev Immunol. (2001) 595–621. 10.1146/annurev.immunol.19.1.595 - DOI - PubMed
    1. Gronwall C, Vas J, Silverman GJ. Protective roles of natural IgM antibodies. Front Immunol. (2012) 3:66. 10.3389/fimmu.2012.00066 - DOI - PMC - PubMed

Publication types

MeSH terms