. 2019 Mar 13:10:310.
doi: 10.3389/fpls.2019.00310. eCollection 2019.

Transcriptional and Chemical Changes in Soybean Leaves in Response to Long-Term Aphid Colonization

Affiliations

Transcriptional and Chemical Changes in Soybean Leaves in Response to Long-Term Aphid Colonization

Jessica D Hohenstein et al. Front Plant Sci. .

Abstract

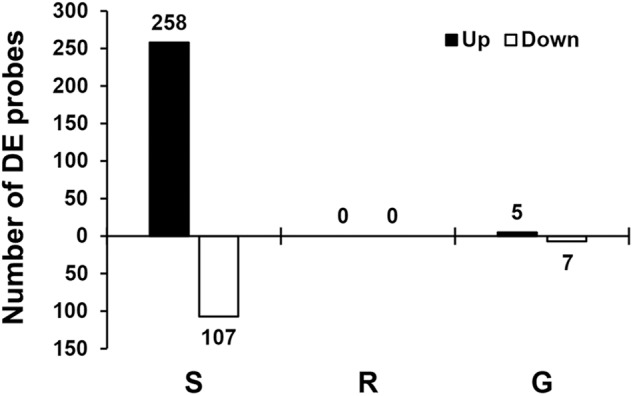
Soybean aphids (Aphis glycines Matsumura) are specialized insects that feed on soybean (Glycine max) phloem sap. Transcriptome analyses have shown that resistant soybean plants mount a fast response that limits aphid feeding and population growth. Conversely, defense responses in susceptible plants are slower and it is hypothesized that aphids block effective defenses in the compatible interaction. Unlike other pests, aphids can colonize plants for long periods of time; yet the effect on the plant transcriptome after long-term aphid feeding has not been analyzed for any plant-aphid interaction. We analyzed the susceptible and resistant (Rag1) transcriptome response to aphid feeding in soybean plants colonized by aphids (biotype 1) for 21 days. We found a reduced resistant response and a low level of aphid growth on Rag1 plants, while susceptible plants showed a strong response consistent with pattern-triggered immunity. GO-term analyses identified chitin regulation as one of the most overrepresented classes of genes, suggesting that chitin could be one of the hemipteran-associated molecular pattern that triggers this defense response. Transcriptome analyses also indicated the phenylpropanoid pathway, specifically isoflavonoid biosynthesis, was induced in susceptible plants in response to long-term aphid feeding. Metabolite analyses corroborated this finding. Aphid-treated susceptible plants accumulated daidzein, formononetin, and genistein, although glyceollins were present at low levels in these plants. Choice experiments indicated that daidzein may have a deterrent effect on aphid feeding. Mass spectrometry imaging showed these isoflavones accumulate likely in the mesophyll cells or epidermis and are absent from the vasculature, suggesting that isoflavones are part of a non-phloem defense response that can reduce aphid feeding. While it is likely that aphid can initially block defense responses in compatible interactions, it appears that susceptible soybean plants can eventually mount an effective defense in response to long-term soybean aphid colonization.

Keywords: Aphis glycines; feeding deterrence; isoflavones; plant–insect interaction; soybean defense.


Figures

FIGURE 1
FIGURE 1
Aphid population levels after 20 days of infestation. Susceptible (SD01-76R) and aphid-resistant (LD16060) soybean plants were infested with 30 aphids and aphid populations were quantified after 20 days. The difference in aphid number between resistant and susceptible plants was statistically significant (p ≤ 0.05; two-tailed Student’s t-test). Error bars represent standard error of the mean (n = 18).
FIGURE 2
FIGURE 2
Transcriptional responses to aphid infestation and genetic differences. Numbers of DE soybean probes for three different comparisons: susceptible response (S) comparing gene expression in susceptible plants with and without aphids, resistant response (R) comparing gene expression in resistant plants with and without aphids, and genetic differences (G) comparing gene expression in resistant and susceptible plants without aphids. Differential expression for individual probes was determined using the following cutoffs: p ≤ 0.0001 and q ≤ 0.04 (FDR = 4%) and the absolute value of the fold change ≥ 2. The number of DE probes is indicated above or under each bar.
FIGURE 3
FIGURE 3
Confirmation of microarray results for selected transcripts. Quantitative real-time reverse-transcribed PCR (qPCR) was used to confirm the microarray results for changes seen in the susceptible response and genetic differences. Isoflavonoid glycosyltransferase (IGT, Glyma.15g221300) and endo-1,4-β-glucanase (GLU, Glyma.08g022300) were downregulated and asparagine synthetase 1 (ASN, Glyma18g06840), NHL10 (Glyma.03g201300) and a WRKY transcription factor (Glyma.05G215900) were upregulated in the susceptible response. Ferritin-1 (FER1, Glyma.18G205800) was expressed at higher levels in uninfested resistant plants than in uninfested susceptible plants. Fold change is indicated for each transcript as determined by qPCR and microarray analysis. All gene expression differences between infested and uninfested or between S and R plants were statistically significant (p < 0.05 for qPCR, p ≤ 0.0001 and q ≤ 0.04 for microarray). Error bars represent standard error of the mean (n = 3).
FIGURE 4
FIGURE 4
Changes in transcripts related to phenylpropanoid metabolism in response to aphid feeding in susceptible plants. A subset of the phenylpropanoid pathway is shown, with enzyme abbreviations in gray font. Each circle represents a soybean gene and its microarray result is depicted by its color hue, color saturation, and size. Genes whose results meet relaxed DE criteria (| fold| ≥ 2, p ≤ 0.05) are shown in blue (suppressed) or yellow (induced). If a gene’s results fail to meet the relaxed criteria then they are represented by a small white circle with a gray outline. Color intensity indicates statistical confidence and circle size indicates fold change.
FIGURE 5
FIGURE 5
Metabolite changes in the susceptible response. HPLC-PAD chromatograms of non-hydrolyzed ethanolic extracts (A,B) and acid-hydrolyzed extracts (C,D) of untreated (A,C) and aphid-treated (B,D) susceptible soybean leaves. Measurable amounts of the isoflavonoid aglycones daidzein and formononetin were found only the aphid-treated extracts (B), not in the untreated samples (A). Hydrolyzable UV-absorbing compounds (Conjugates) were also increased in aphid-treated leaves (A,B). Acid hydrolysis of extracts demonstrated that the major increases were derived from the isoflavonoids daidzein, genistein, and formononetin, in addition to an unknown compound (Unknown 1; λmax 237.9 nm, shoulder 285.2 nm), whereas kaempferol-derived compounds were unchanged (E). Unknown compounds were quantified based on daidzein equivalents. Aphid1–3 represents unknown compounds detected only from aphid-treated samples. Amounts of total UV-absorbing metabolites increased twofold in the aphid-treated extracts (F). Error bars represent standard error of the mean (n = 7–9). A lower case a indicates significant differences (p < 0.05; two-tailed Student’s t-test).
FIGURE 6
FIGURE 6
Aphids choose between control and daidzein-treated plants. (A) Petioles of individual leaves of susceptible plants were placed on tubes containing either DMSO (control) or different isoflavone solutions (5 μg ml-1). One control and one isoflavone-treated leaf were then paired and connected with a piece of filter paper between leaves. Ten adult aphids were placed on the filter paper and allowed to move freely between the two trifoliates. The number of aphids feeding on each leaf was recorded after 16 h. (B) Choice experiment as in (A), using water vs. DMSO (0.6–1.2% v/v). Statistically significant differences were determined by paired Student’s t-test. Error bars represent standard error of the mean (n = 38–49).
FIGURE 7
FIGURE 7
Isoflavonoids do not accumulate in leaf vasculature. Analysis of the distribution of isoflavonoids in susceptible control leaves and susceptible leaves colonized by aphids for 21 days was carried out using negative mode MALDI-MSI after imprinting leaves on a PTFE surface. Left panels, optical image of imprinted PTFE. Other panels, chemical images for formononetin (m/z 267.066), daidzein (m/z 253.05), and glyceollin (m/z 337.108) using an arbitrary scale (blue = low; yellow = high). Representative images are shown.
FIGURE 8
FIGURE 8
Determination of isoflavone accumulation in response to aphid feeding through mass spectrometry imaging (MSI). Relative quantification was carried out by acquisition of total signal for individual ions in a fixed rectangle placed randomly over each image, then normalized to the ion signal for 1,5-diaminonaphthalene (matrix). m/z for each compound: kaempferol, 285.04; kaempferol-3-rhamnoglucoside (K-RG), 593-152; clitorin (K-RGG), 739.211; formononetin, 267.066; daidzein, 253.05; chalcone, 255.066; hydroxyfomononetin, 283.061; C15H10O5, 269.046; C17H14O5, 297.077; glyceollin, 337.108. Statistically significant differences were determined by two-tailed Student’s t-test (p < 0.05; ∗∗p < 0.005; n = 7–9).

References

    1. Akashi T., Aoki T., Ayabe S. (2005). Molecular and biochemical characterization of 2-hydroxyisoflavanone dehydratase. involvement of carboxylesterase-like proteins in leguminous isoflavone biosynthesis. Plant Physiol. 137 882–891. 10.1104/pp.104.056747 - DOI - PMC - PubMed
    1. Akashi T., Sasaki K., Aoki T., Ayabe S., Yazaki K. (2009). Molecular cloning and characterization of a cDNA for pterocarpan 4-dimethylallyltransferase catalyzing the key prenylation step in the biosynthesis of glyceollin, a soybean phytoalexin. Plant Physiol. 149 683–693. 10.1104/pp.108.123679 - DOI - PMC - PubMed
    1. Altschul S. F., Gish W., Miller W., Myers E. W., Lipman D. J. (1990). Basic local alignment search tool. J. Mol. Biol. 215 403–410. 10.1016/S0022-2836(05)80360-2 - DOI - PubMed
    1. Alvarez A. E., Tjallingii W. F., Garzo E., Vleeshouwers V., Dicke M., Vosman B. (2006). Location of resistance factors in the leaves of potato and wild tuber-bearing Solanum species to the aphid Myzus persicae. Entomol. Exp. Et Appl. 121 145–157. 10.1111/j.1570-8703.2006.00464.x - DOI
    1. Asai T., Tena G., Plotnikova J., Willmann M. R., Chiu W.-L., Gomez-Gomez L., et al. (2002). MAP kinase signalling cascade in Arabidopsis innate immunity. Nature 415 977–983. 10.1038/415977a - DOI - PubMed