

Response of the Intertropical Convergence Zone to Climate Change: Location, Width, and Strength
- PMID: 30931244
- PMCID: PMC6411165
- DOI: 10.1007/s40641-018-0110-5
Response of the Intertropical Convergence Zone to Climate Change: Location, Width, and Strength
Abstract
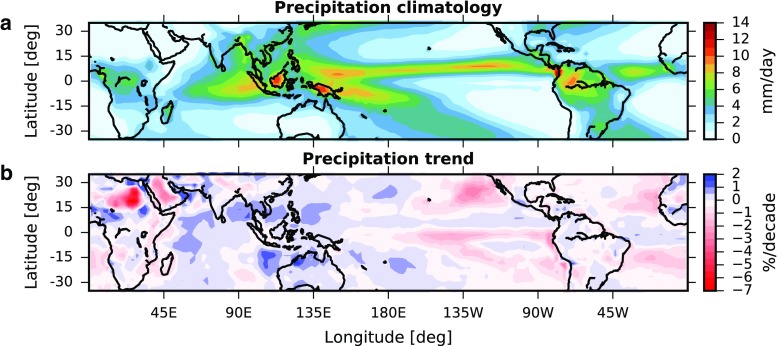
Purpose of review: The intertropical convergence zone (ITCZ) is a planetary-scale band of heavy precipitation close to the equator. Here, we consider the response of the ITCZ structure to climate change using observations, simulations, and theory. We focus on the substantial yet underappreciated projected changes in ITCZ width and strength, and highlight an emerging conceptual framework for understanding these changes.
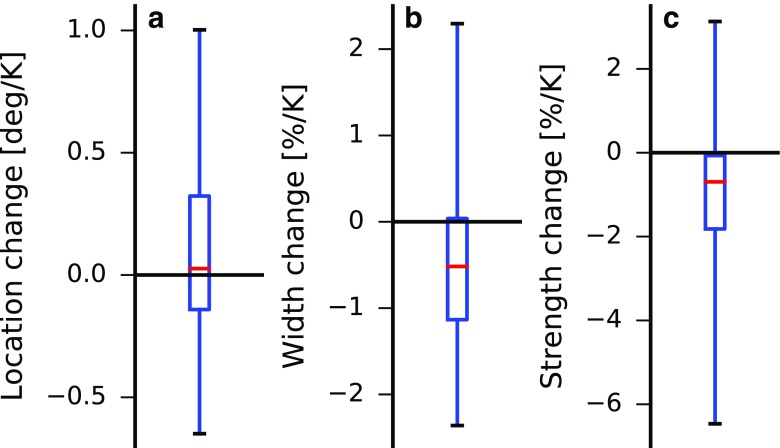
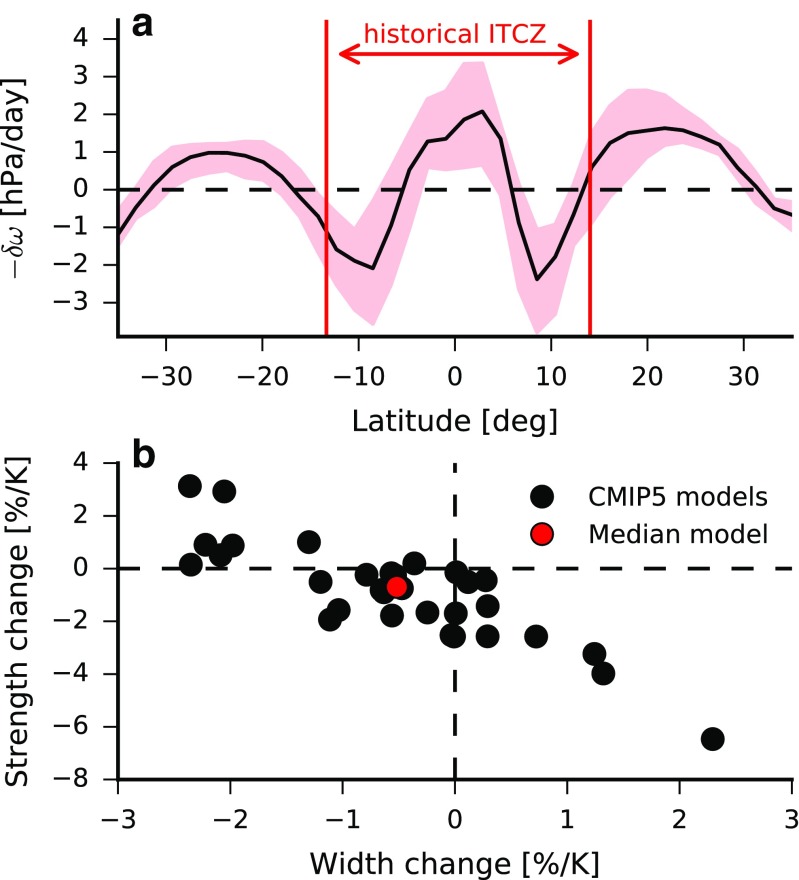
Recent findings: Satellite observations and reanalysis data show a narrowing and strengthening of precipitation in the ITCZ over recent decades in both the Atlantic and Pacific basins, but little change in ITCZ location. Consistent with observations, coupled climate models predict no robust change in the zonal-mean ITCZ location over the twenty-first century. However, the majority of models project a narrowing of the ITCZ and weakening mean ascent. Interestingly, changes in ITCZ width and strength are strongly anti-correlated across models.
Summary: The ITCZ has narrowed over recent decades yet its location has remained approximately constant. Climate models project further narrowing and a weakening of the average ascent within the ITCZ as the climate continues to warm. Following intense work over the last ten years, the physical mechanisms controlling the ITCZ location are now well understood. The development of complementary theories for ITCZ width and strength is a current research priority. Outstanding challenges include understanding the ITCZ response to past climate changes and over land versus ocean regions, and better constraining all aspects of the ITCZ structure in model projections.
Electronic supplementary material: The online version of this article (10.1007/s40641-018-0110-5) contains supplementary material, which is available to authorized users.
Keywords: Atmospheric dynamics; Climate change; Intertropical convergence zone; Models; Observations; Theory; Tropical precipitation.
Conflict of interest statement
Compliance with Ethical StandardsOn behalf of all authors, the corresponding author states that there is no conflict of interest.
Figures

References
-
- Kang SM, Shin Y, Xie SP. 2018. Extratropical forcing and tropical rainfall distribution: energetics framework and ocean E,kman advection, npj Climate and Atmospheric Science 1 10.1038/s41612-017-0004-6.
-
- Pierrehumbert RT. Thermostats, radiator fins, and the local runaway greenhouse. J Atmos Sci. 1995;52:1784.
-
- Su Hui, Jiang Jonathan H., Neelin J. David, Shen T. Janice, Zhai Chengxing, Yue Qing, Wang Zhien, Huang Lei, Choi Yong-Sang, Stephens Graeme L., Yung Yuk L. Tightening of tropical ascent and high clouds key to precipitation change in a warmer climate. Nature Communications. 2017;8:15771. - PMC - PubMed
-
- Byrne MP, Schneider T. Atmospheric dynamics feedback: concept, simulations and climate implications. J Climate. 2018;31:3249.
Publication types
LinkOut - more resources
Full Text Sources
Research Materials
Miscellaneous