. 2019 Apr 1;9(1):5392.
doi: 10.1038/s41598-019-41524-3.

The LRRC8-mediated volume-regulated anion channel is altered in glaucoma

Affiliations

The LRRC8-mediated volume-regulated anion channel is altered in glaucoma

Xavier Gasull et al. Sci Rep. .

Erratum in

Abstract

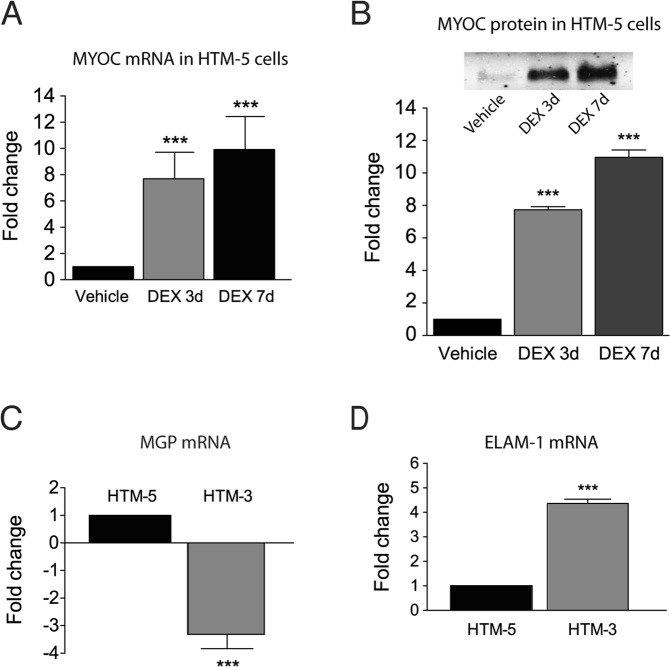
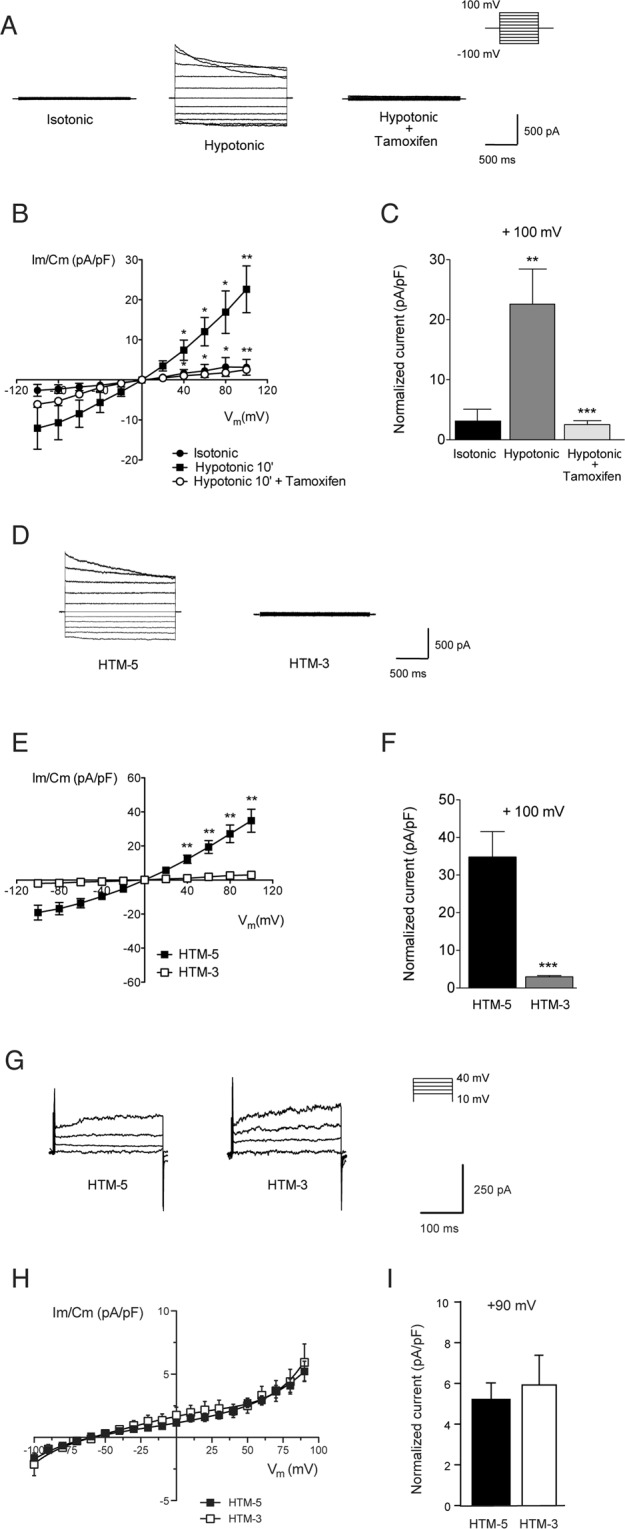
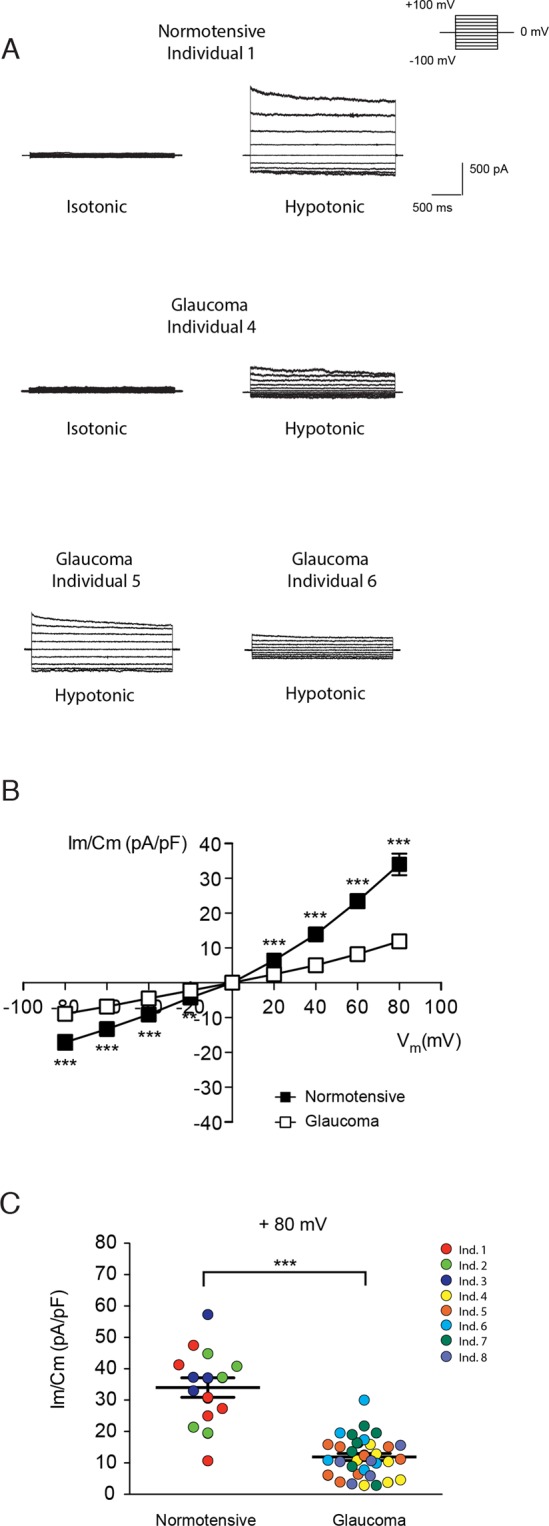
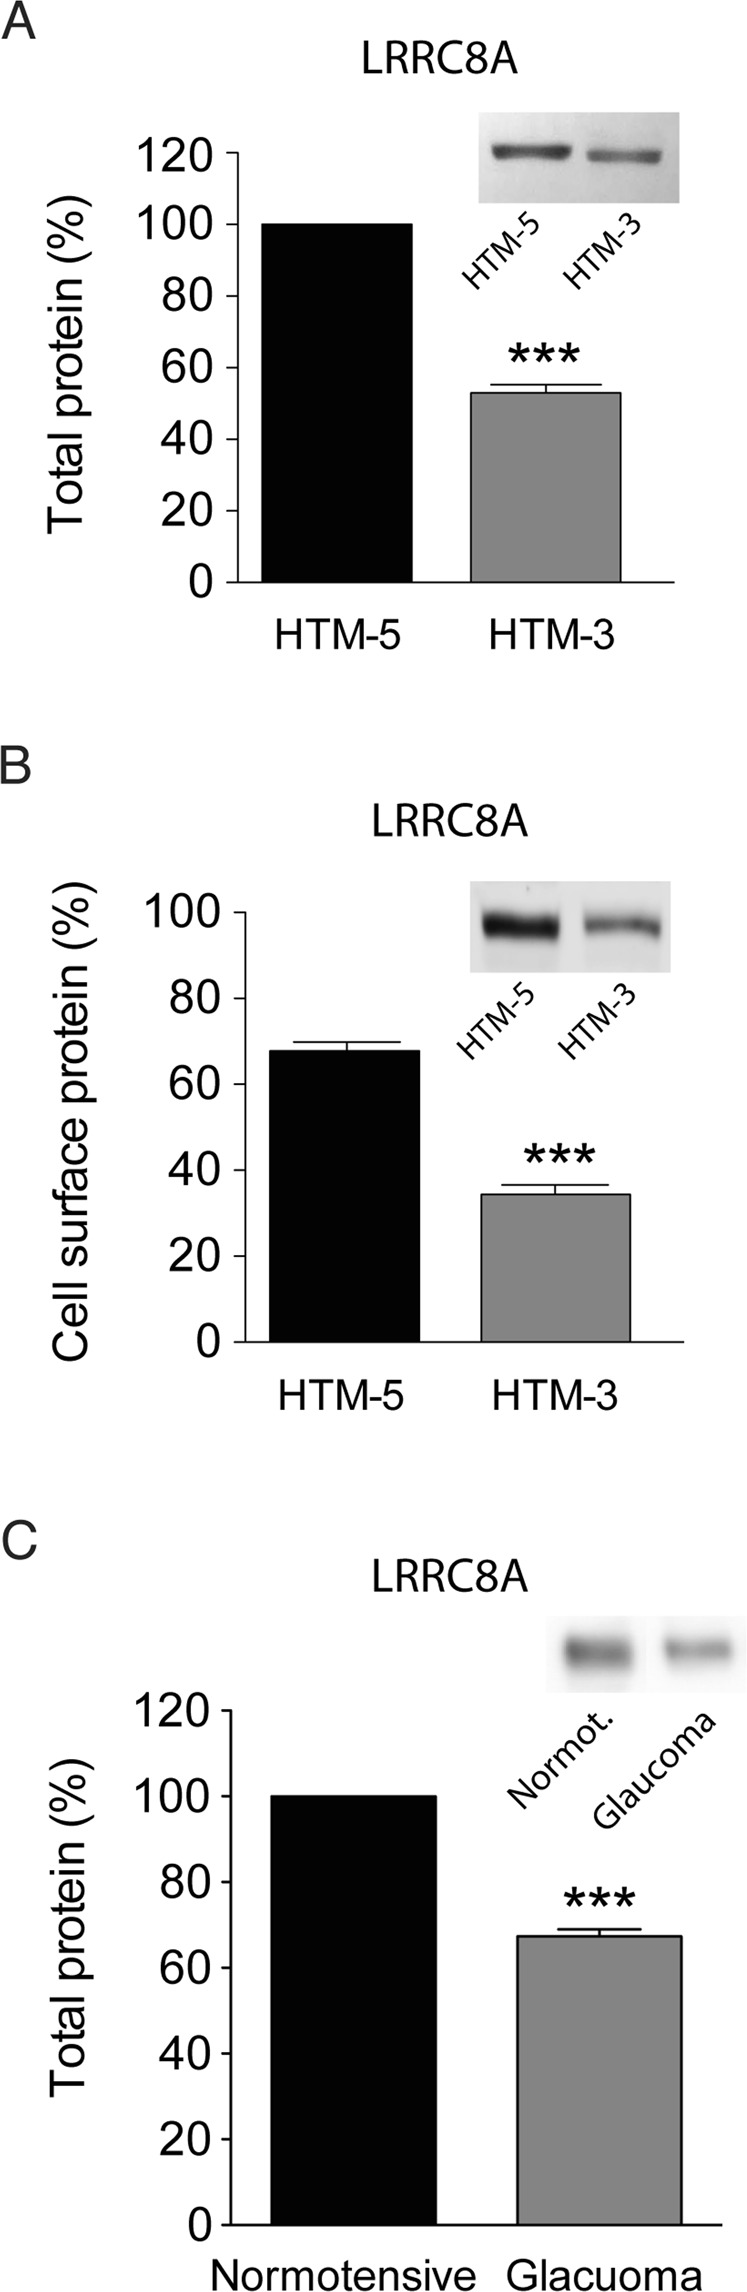
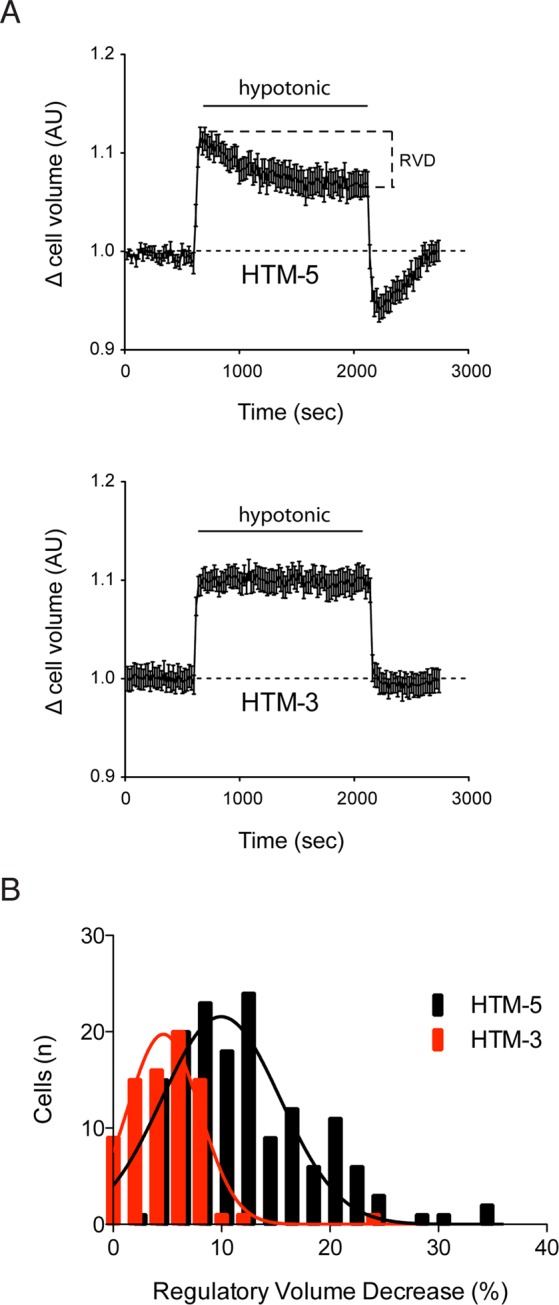
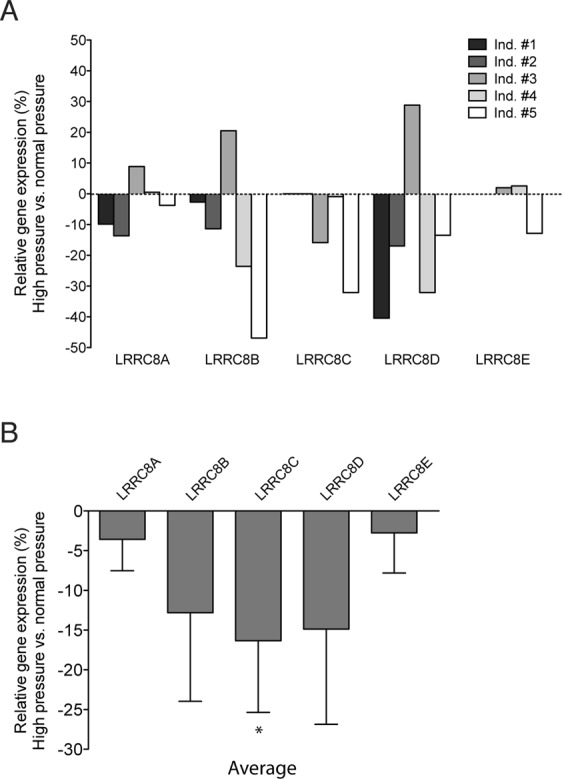
Regulation of cellular volume is an essential process to balance volume changes during cell proliferation and migration or when intracellular osmolality increases due to transepithelial transport. We previously characterized the key role of volume-regulated anion channels (VRAC) in the modulation of the volume of trabecular meshwork (TM) cells and, in turn, the aqueous humour (AH) outflow from the eye. The balance between the secretion and the drainage of AH determines the intraocular pressure (IOP) that is the major casual risk factor for glaucoma. Glaucoma is an ocular disease that causes irreversible blindness due to the degeneration of retinal ganglion cells. The recent identification of Leucine-Rich Repeat-Containing 8 (LRRC8A-E) proteins as the molecular components of VRAC opens the field to elucidate their function in the physiology of TM and glaucoma. Human TM cells derived from non-glaucomatous donors and from open-angle glaucoma patients were used to determine the expression and the functional activity of LRRC8-mediated channels. Expression levels of LRRC8A-E subunits were decreased in HTM glaucomatous cells compared to normotensive HTM cells. Consequently, the activity of VRAC currents and volume regulation of TM cells were significantly affected. Impaired cell volume regulation will likely contribute to altered aqueous outflow and intraocular pressure.


Conflict of interest statement

The authors declare no competing interests.

Figures

Figure 1
Figure 1
Validation of HTM-5 and HTM-3 cell lines. (A) Induction of Myocilin (MYOC) mRNA in HTM-5 cells treated with dexamethasone (DEX, 100 nM) at two different time points (3 days and 7 days) compared to HTM-5 cells treated with vehicle (0.1% ethanol). Values are the mean ± SEM of n = 8 cells (***p < 0.001 DEX-treated cells vs. vehicle, Student’s t-test). (B) MYOC protein quantified in HTM-5 extracts treated with vehicle, DEX 3 days and DEX 7 days. MYOC was significantly increased by DEX. Values are mean ± SEM of n = 8 cells (***p < 0.001 DEX-treated cells vs vehicle, Student’s t-test). Inset: Representative western blot showing MYOC in HTM-5 cells. A full-length blot is presented in Supplementary Fig. 1B. (C) mRNA expression of Matrix Gla Protein (MGP) and (D) Endothelial-Leukocyte Adhesion Molecule-1 (ELAM-1) in glaucomatous HTM-3 cells normalized to HTM-5 control cells. MGP was significantly down-regulated and ELAM-1 was significantly up-regulated in HTM-3 compared to HTM-5, as it has been described in glaucoma. Values are mean ± SEM of n = 3 cells (***p < 0.001 HTM-3 versus HTM-5, Student’s t-test).
Figure 2
Figure 2
Activation of VRAC and BKCa currents in HTM cell lines. (A) Representative VRAC currents recorded in isotonic extracellular medium, and at 10 min in hypotonic extracellular medium (30%) before and after the addition of tamoxifen (100 μM). (B) Current-voltage (I-V) curves showing VRAC currents in HTM-5 cells in (⦁) isotonic conditions, (▪) hypotonic conditions, and (◦) hypotonic conditions + tamoxifen. Values are the mean ± SEM of n = 5 independent cells. Current density is determined normalizing currents against cell capacitance (pA/pF). VRAC currents increased significantly after 10 min of hypotonicity (p < 0.001). **p < 0.01, *p < 0.05 isotonic vs. hypotonic, ANOVA plus Bonferroni post-tests. Tamoxifen blocked most of VRAC currents activated under hypotonic conditions (p < 0.001). **p < 0.01, *p < 0.05 hypotonic versus hypotonic + tamoxifen, ANOVA plus Bonferroni post-tests. (C) Peak currents measured at +100 mV in HTM-5 cells at each experimental condition (**p < 0.01 isotonic vs. hypotonic, ***p < 0.001 hypotonic vs. hypotonic + tamoxifen, Student’s t-test). (D) Representative experiment showing VRAC currents under hypotonic conditions in control HTM-5 cells and glaucomatous HTM-3 cells (recorded as described in A). (E) Normalized I-V relationship activated in (▪) HTM-5 and (▫) HTM-3 at 10 min in hypotonic conditions. Values are mean ± SEM of n = 10 cells (HTM-5) and n = 7 cells (HTM-3). VRAC currents were significantly lower in HTM-3 compared to HTM-5 cells (p < 0.001). **p < 0.01 HTM-3 vs. HTM-5, ANOVA plus Bonferroni post-tests. (F) Peak currents measured at + 100 mV under hypotonicity (***p < 0.001 HTM-3 vs. HTM-5, Student’s t-test). (G) Representative outward K+ currents mediated by the high conductance Ca2+-activated K+ (BKCa) channel in control HTM-5 and glaucomatous HTM-3 cells. (H) Current-voltage curves for BKCa in (▪) non-glaucomatous and (▫) glaucomatous HTM cells. Results are the mean ± SEM (n = 11 HTM-5, n = 10 HTM-3). No significant differences were found in current densities between cell lines (Two-way ANOVA and Bonferroni post-tests). (I) Peak currents measured at +90 mV in control HTM-5 and glaucomatous HTM-3 cells (glaucoma vs. non-glaucoma, Student’s t-test).
Figure 3
Figure 3
Activation of VRAC currents in primary HTM cells. (A) Representative whole-cell currents activated in primary non-glaucomatous (Ind. 1) and glaucomatous HTM cells (Ind. 4, 5 and 6) by depolarizing pulses, from −80 mV to +80 mV in 20 mV steps applied every 5 seconds from a 0 mV holding potential. VRAC currents were recorded in isotonic medium, and after 5 min in hypotonic medium (−30%) (For Ind. 5 and 6 only hypotonic conditions are shown). (B) Current-voltage (I-V) curves for VRAC in (▪) non-glaucomatous and (▫) glaucomatous HTM cells under hypotonic conditions for 5 min. Values are shown as the mean ± SEM of non-glaucomatous (n = 15) and glaucomatous (n = 33) primary HTM cells, from three and five individuals, respectively. The hypotonic-mediated increase in VRAC current was significantly smaller in glaucoma compared to control primary HTM cells (p < 0.001). ***p < 0.001 glaucoma vs. non-glaucoma, ANOVA plus Bonferroni post-tests. (C) Peak currents measured at +80 mV in control and glaucoma primary HTM cells in hypotonic conditions (***p < 0.001 glaucoma vs. non-glaucoma, Student’s t-test) represented as a dispersion (the colours indicate the eight individuals studied, Table 1).
Figure 4
Figure 4
Expression of LRRC8A-LRRC8E, KCNMA1 and NKCC1 genes in HTM cells. (A) Relative abundance of LRRC8 mRNAs in HTM-5 cells. Results are shown as the percentage of expression of LRRC8B-LRRC8E compared to the expression of the main subunit LRRC8A normalized against 18S RNA. Values are mean ± SEM of 4 sets of independent experiments performed by triplicate. LRRC8 were expressed in HTM-5, being LRRC8A the most abundant subunit (**p < 0.01, ***p < 0.001, Student’s t-tests). (B) LRRC8A-E expression was significantly down-regulated in glaucomatous HTM-3 cells vs. control HTM-5 cells (**p < 0.01, ***p < 0.001, Student’s t-tests). Results are expressed as fold change normalized against 18 S RNA. Values are mean ± SEM of 4 sets of independent experiments done by triplicate. (C) Gene expression of KCNMA1 (BKCa) and NKCC1 (Na+-K+-2Cl) in HTM-3 compared to HTM-5 cells determined by relative quantitative real-time PCR. KCNMA1 expression was not significantly altered in glaucomatous HTM-3 cells (Student’s t-tests) while the expression of NKCC1 was significantly down-regulated in HTM-3 versus HTM-5 (***p < 0.001, Student’s t-tests). Results are expressed as fold change normalized against 18 S RNA. Values are mean ± SEM of n = 3 (KCNMA1) and n = 4 (NKCC1) independent experiments done by triplicate.
Figure 5
Figure 5
Quantification of LRRC8A protein at HTM cells. (A) LRRC8A was significantly lower in HTM-3 compared to HTM-5. Data are expressed as the percentage of LRRC8A in HTM-3 normalized to its amount in HTM-5. Values are mean ± SEM of 7 protein extractions (***p < 0.001, Student’s t-tests). Total protein was previously quantified to load the same amount of protein of the two cell lines and the LRRC8A signal was normalized by β-actin. Inset: Representative western blot showing LRRC8A (95 KDa) in HTM-5 and HTM-3 cell extracts. Full-length blot is presented in Supplementary Fig. 5A. (B) Relative abundance of LRRC8A protein at cell surface in relation to total LRRC8A protein expressed as a percentage. Quantification shows a lower amount of LRRC8A protein at the PM of HTM-3 cells compared to that at HTM-5 cells. Values are mean ± SEM of 5 independent experiments (***p < 0.001, Student’s t-tests). Inset: Representative WB of cell surface biotinylation showing LRRC8A. Full-length blot is shown in Suppl. Figure 5B. A set of experiments without biotin was done as a negative control (not shown). (C) LRRC8A protein was also significantly lower in primary TM cells from glaucoma patients in comparison to non-glaucomatous donors. Protein extracts were previously quantified to load the same amount of each cell sample from Ind. 1–3 (control, normotensive) and Ind. 5–8 (glaucoma), and LRRC8A signal normalized by β-actin. Values are mean ± SEM of two different film intensities of two western blots from the same protein extracts (***p < 0.001, Student’s t-tests). Inset: Representative WB showing LRRC8A in control (Ind. 1) and glaucoma (Ind. 5) protein samples. Full-length blots are in Supplementary Fig. 5C.
Figure 6
Figure 6
Volume regulation of HTM cells. (A) RVD activated in HTM-5 and HTM-3 cells was measured using calcein as an index of cellular volume (see Material and Methods for details). After baseline at isotonic conditions (10 min), swollen was induced by application of hypotonic bath solution (27% for 30 min) to activate the RVD. Glaucomatous HTM-3 cells showed an inappreciable RVD in comparison to the RVD activated in control HTM-5 cells. Results are plotted as mean ± SEM of a set of two representative experiments (n = 17 HTM-5 cells, n = 15 HTM-3 cells). (B) RVD is determined as the percentage of cell volume recovery during the hypotonic period being significantly lower in HTM-3 cells (n = 79) than in HTM-5 cells (n = 153). Values are represented versus the distribution of the number of cells in each group (***p < 0.001, Student’s t-tests).
Figure 7
Figure 7
Differential expression of LRRC8A-LRRC8E genes under pressure in human TM. Paired ocular anterior segments from five donors were perfused at high P or physiological P during 7 d as in Material and Methods. For each individual, the relative expression of LRRC8 genes in human TM tissues was determined with Affymetrix GeneChips U95Av2 (individuals #1 and #2) or U133Plus2.0 (Ind. #3, #4, and #5). (A) Bars represent changes in the LRRC8 expression by high P treatment in each individual, plotted separately to assess individual molecular response to pressure. Because the two types of microarrays contain ≈12,625 and 54,678 probes respectively, LRR8C and LRRC8E were not detected in the U95Av2 platform (Ind. #1 and #2). (B) Expression of LRRC8 genes as mean ± SEM shows their tendency to decrease by elevated pressure insults. LRRC8C down-regulation is the only statistically significant because of the differential molecular response to pressure of the individual #3. (*p = 0.038 by the Student’s t-test).

References

    1. Quigley HA. Glaucoma. Lancet. 2011;377:1367–1377. doi: 10.1016/S0140-6736(10)61423-7. - DOI - PubMed
    1. Lütjen-Drecoll E. Importance of trabecular meshwork changes in the pathogenesis of primary open-angle glaucoma. J Glaucoma. 2000;9(6):417–8. doi: 10.1097/00061198-200012000-00001. - DOI - PubMed
    1. Wiederholt M, Thieme H, Stumpff F. The regulation of trabecular meshwork and ciliary muscle contractility. Prog. Retin. Eye Res. 2000;19:271–295. doi: 10.1016/S1350-9462(99)00015-4. - DOI - PubMed
    1. Gual A, et al. Effects of time of storage, albumin, and osmolality changes on outflow facility (C) of bovine anterior segment in vitro. Investig. Ophthalmol. Vis. Sci. 1997;38:2165–2171. - PubMed
    1. Mitchell CH, Fleischhauer JC, Stamer WD, Peterson-Yantorno K, Civan MM. Human trabecular meshwork cell volume regulation. Am. J. Physiol. Cell Physiol. 2002;283:C315–C326. doi: 10.1152/ajpcell.00544.2001. - DOI - PubMed

Publication types

MeSH terms