. 2019 Apr 1;9(1):5442.
doi: 10.1038/s41598-019-41901-y.

CO2 flux emissions from the Earth's most actively degassing volcanoes, 2005-2015

Affiliations

CO2 flux emissions from the Earth's most actively degassing volcanoes, 2005-2015

Alessandro Aiuppa et al. Sci Rep. .

Abstract

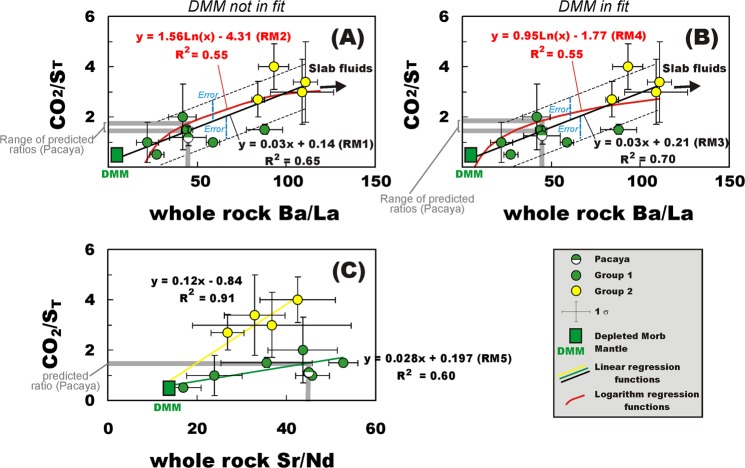
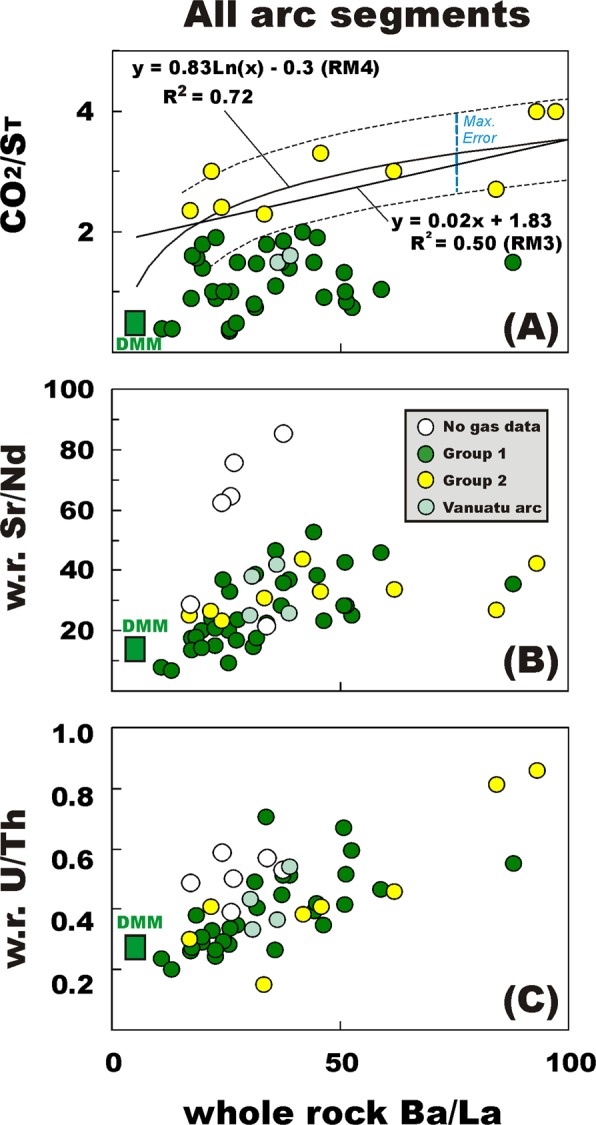
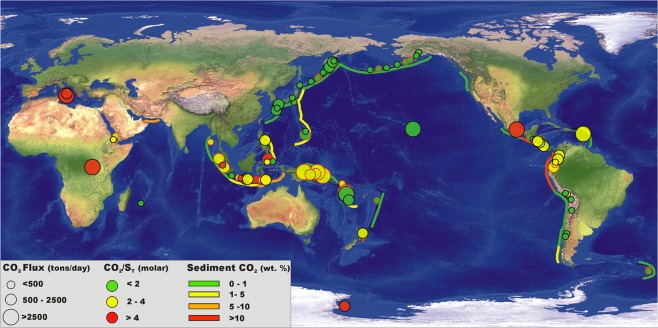
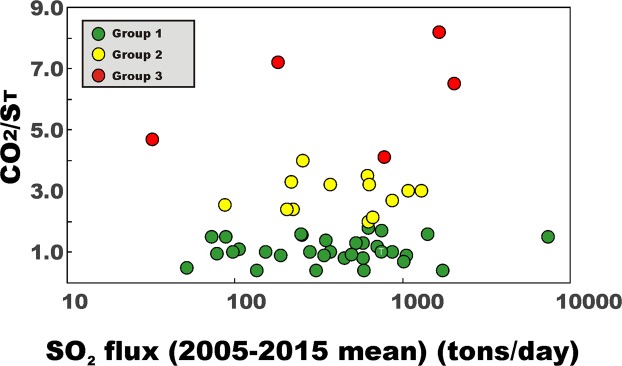
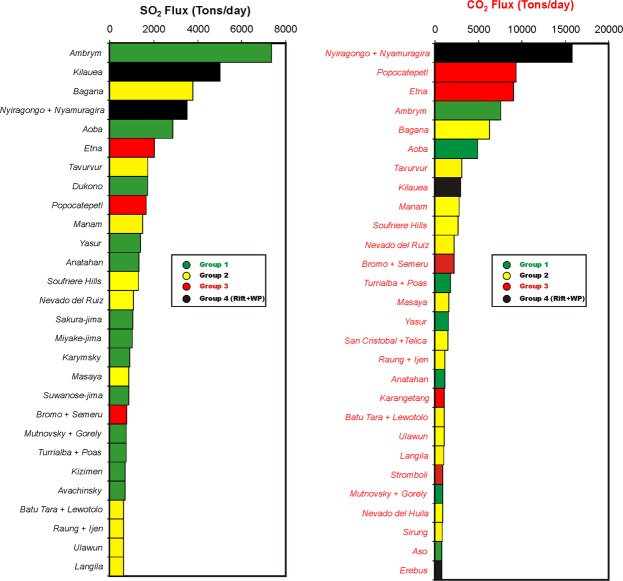
The global carbon dioxide (CO2) flux from subaerial volcanoes remains poorly quantified, limiting our understanding of the deep carbon cycle during geologic time and in modern Earth. Past attempts to extrapolate the global volcanic CO2 flux have been biased by observations being available for a relatively small number of accessible volcanoes. Here, we propose that the strong, but yet unmeasured, CO2 emissions from several remote degassing volcanoes worldwide can be predicted using regional/global relationships between the CO2/ST ratio of volcanic gases and whole-rock trace element compositions (e.g., Ba/La). From these globally linked gas/rock compositions, we predict the CO2/ST gas ratio of 34 top-degassing remote volcanoes with no available gas measurements. By scaling to volcanic SO2 fluxes from a global catalogue, we estimate a cumulative "unmeasured" CO2 output of 11.4 ± 1.1 Mt/yr (or 0.26 ± 0.02·1012 mol/yr). In combination with the measured CO2 output of 27.4 ± 3.6 Mt/yr (or 0.62 ± 0.08·1012 mol/yr), our results constrain the time-averaged (2005-2015) cumulative CO2 flux from the Earth's 91 most actively degassing subaerial volcanoes at 38.7 ± 2.9 Mt/yr (or 0.88 ± 0.06·1012 mol/yr).


Conflict of interest statement

The authors declare no competing interests.

Figures

Figure 1
Figure 1
The proxy approach for estimating the CO2/ST ratio for “unmeasured” volcanoes (i.e., those for which no gas data exist), based on the averaged trace-element composition of the corresponding volcanic rocks. The procedure is illustrated for Pacaya volcano in Guatemala. Firstly, the association between CO2/ST ratios in volcanic gases (corresponding to CO2/SO2 gas ratios in the high-temperature systems studied here) and whole-rock Ba/La ratios is established at the scale of the Central American Volcanic Arc (CAVA) segments, using data for volcanoes for which both gas and trace element data are available (see Table S1a). Secondly, the gas vs. trace-element trend is fitted via either a linear or logarithm best-fit regression function. Tests made excluding (panel A) or including (panel B) the compositional point of the Depleted Mid-ocean ridge Mantle (DMM; refs,) in the data-fitting found that the second option systematically led to the best-data fits (see Table 2). Finally, the preferred regression model function (RM3 in the Pacaya example; see panel B and Table 2) is used to calculate a “predicted” gas CO2/SO2 from available Ba/La data for Pacaya whole-rocks (uncertainty is estimated from confidence interval at one standard deviation on the regression). Our inferred gas CO2/ST ratio (1.4 ± 0.75; Table 2) is well within the magmatic gas range (CO2/SO2 ratio of 1.1 ± 1.0.) measured during recent plume observations. A similar CO2/ST ratio (see Table 2) is predicted using the CAVA gas vs. Sr/Nd ratio association (panel C). In this plot, the yellow and green dashed lines are the linear best-fit regression lines for Group 1 and 2 sub-populations, respectively.
Figure 2
Figure 2
Scatter plots of mean Ba/La whole-rock ratios vs. volcanic gas CO2/ST ratios (panels A, D and G), whole-rock Sr/Nd ratios (panels B, E and H) and whole-rock U/Th ratios (panels C, F and K) for three arc segments (left, Central America; middle, Southern America; right Sunda-Banda arc in Indonesia). Each symbol corresponds to an individual volcano for which gas and trace element information is simultaneously available (see Tables S1a–c for the list of volcanoes, compositions used, and data sources). The gas vs. trace element correlations are explained in terms of mixing between a C-Ba-Sr-U-poor Depleted Mid-ocean ridge Mantle (DMM) and C-Ba-Sr-U-rich slab fluids. C-poor arc volcanoes (Group 1, in green) plot close to the DMM, while Group 2 arc volcanoes (in yellow) are C-enriched to larger slab fluid influx. The even more C-rich signature of Group 3 arc volcanoes (in red) may reflect some addition of crustal carbon. For each arc segment, panels A, D, and G show the best-fit regression functions used to predict the volcanic gas CO2/ST ratios for “unmeasured” volcanoes (open symbols; see Tables 1 and S1b–d). The grey lines illustrate (for two “unmeasured” volcano examples) the procedure used to convert whole-rock Ba/La ratios into gas CO2/ST ratios, using the equations of the best-fit regression lines.
Figure 3
Figure 3
Scatter plots of mean Ba/La whole-rock ratios vs. (A) volcanic gas CO2/ST ratios, (B) whole-rock Sr/Nd ratios and (C) whole-rock U/Th ratios (panels C, F and K) for Group 1 volcanoes (green, see Table S1d) and Group 2 volcanoes (yellow, see Table S1e) globally. Each symbol corresponds to an individual arc volcano for which gas and trace element information is simultaneously available (see Tables S1d–e for the list of volcanoes, compositions used, and data sources). Volcanoes with no gas compositional information are shown as open circles. The Vanuatu arc volcanoes are plotted in light green. The best-fit regression functions through the populations of Group 1 and Group 2 volcanoes are separately illustrated. Group 1 volcanoes exhibit little change in gas CO2/ST ratios on increasing Ba/La. Their mean CO2/ST ratio of 1.2 ± 0.5 (see Table S1d) is thus adopted for all the “unmeasured” (for gas) Group 1 volcanoes (Table 1). For the “unmeasured” Group 2 volcanoes, we average the predicted volcanic gas CO2/ST ratios obtained from regression functions RM3 and RM4 (see Tables 1 and S1e).
Figure 4
Figure 4
Global map illustrating the location of the 91 strongest volcanic CO2 emitters (data from Table 1). CO2 flux information for both “measured” (circles with black borders) and “unmeasured” (circles with red borders) volcanoes is shown. Dimension of the symbols is proportional to CO2 flux, with color fill reflecting the CO2/ST ratio (see legend). Trenches are differently colored depending on CO2 bulk concentration in the trench sediments (data from ref.). The map shows that the most strongly CO2 degassing volcanoes are clustered in tropic to sub-tropical regions such as the Vanuatu-Papua New Guinea arc segments, in Central America, Southern American (Northern Volcanic Zone), and in the Lesser Antilles, in addition to Italy (Etna), Congo (Nyrangongo + Nyamuragira) and Hawaii (Kilauea). Volcanic CO2 fluxes are typically lower in higher latitude volcanic regions such as in the Aleutians-Kamchatka-Kuriles and in the South-Sandwich Islands, where no carbonate-rich lithologies are subducted at the trenches. The map was generated using the open source QGIS software (available at https://www.qgis.org/it/site/) (Copyright © 2019 AIUPPA. Permission is granted to copy, distribute and/or modify this document under the terms of the GNU Free Documentation License, Version 1.3 or any later version published by the Free Software Foundation; with no Invariant Sections, no Front-Cover Texts, and no Back-Cover Texts. A copy of the license is included in the section entitled “GNU Free Documentation License”). The base map is a relief and bathymetry Raster called «Natural Earth II with Shaded Relief and Water» file #NE2_HR_LC_SR_W.tiff (Made with Natural Earth. Free vector and raster map data @ naturalearthdata.com). As for the shaded relief, we use the CleanTOPO2 layer, a modified SRTM30 Plus World Elevation Data also edited by Tom Patterson, US National Park Service. The original source data is from ref..
Figure 5
Figure 5
Scatter plot exploring the relationship between the SO2 flux (2005–2015 mean; data from ref.) and the volcanic gas CO2/ST ratio for the population of “measured” volcanoes in Table 1. For Turrialba + Poas (T), we plot the best-guess estimate for the magmatic gas CO2/ST ratio for Turrialba volcano (data from 28 top-ranking volcanic point sources of SO2 (left) and CO2 (right) during 2005–2015. Data are from Table 1. SO2 fluxes are 2005–2015 means from ref.. The CO2 fluxes are calculated from SO2 using measured or predicted CO2/SO2 ratios (see Table 1). Different volcano groups are identified by different colours. The global CO2 budget is dominated by CO2-rich Group 2–3 arc volcanoes. Two rift volcanoes (Nyiragongo and Nyamuragira) and one within-plate (WP) volcano (Kilauea) appears in the top-10 list of CO2 emitting volcanoes.
Figure 6
Figure 6
The 28 top-ranking volcanic point sources of SO2 (left) and CO2 (right) during 2005–2015. Data are from Table 1. SO2 fluxes are 2005–2015 means from ref.. The CO2 fluxes are calculated from SO2 using measured or predicted CO2/SO2 ratios (see Table 1). Different volcano groups are identified by different colours. The global CO2 budget is dominated by CO2-rich Group 2–3 arc volcanoes. Two rift volcanoes (Nyiragongo and Nyamuragira) and one within-plate (WP) volcano (Kilauea) appears in the top-10 list of CO2 emitting volcanoes.

References

    1. Dasgupta R, Hirschmann MM. The deep carbon cycle and melting in Earth’s interior. Earth Planet. Sci. Lett. 2010;298:1–13. doi: 10.1016/j.epsl.2010.06.039. - DOI
    1. Dasgupta R, Hirschmann MM. Melting in the Earth’s deep upper mantle caused by carbon dioxide. Nature. 2006;440:659–662. doi: 10.1038/nature04612. - DOI - PubMed
    1. Berner, R. A. The Phanerozoic Carbon Cycle: CO2 and O2. Oxford University Press (2004).
    1. Lee C-T, et al. Continental arc–island arc fluctuations, growth of crustal carbonates, and long-term climate change. Geosphere. 2013;9:21–36. doi: 10.1130/GES00822.1. - DOI
    1. Royer DL, Donnadieu Y, Park J, Kowalczyk J, Goddéris Y. Error analysis of CO2 and O2 estimates from the long-term geochemical model GEOCARBSULF. Am. J. Sci. 2014;314:1259–1283. doi: 10.2475/09.2014.01. - DOI