. 2019 Apr 1;9(1):5425.
doi: 10.1038/s41598-019-41977-6.

Defining Dysbiosis in Patients with Urolithiasis

Affiliations

Defining Dysbiosis in Patients with Urolithiasis

Anna Zampini et al. Sci Rep. .

Abstract

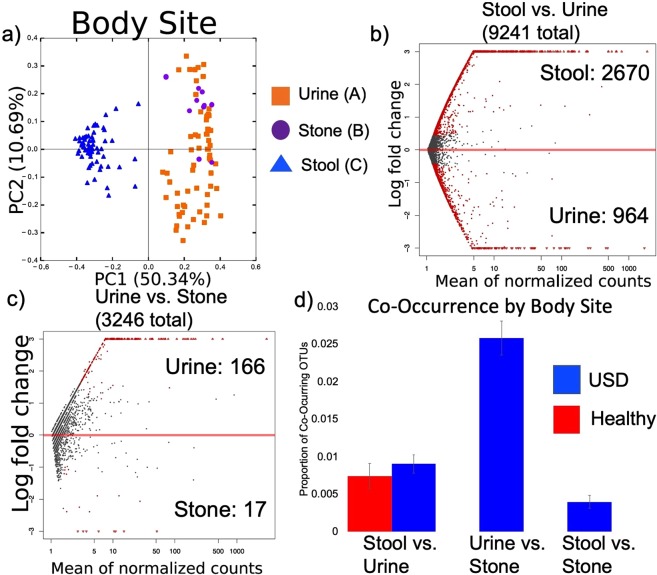
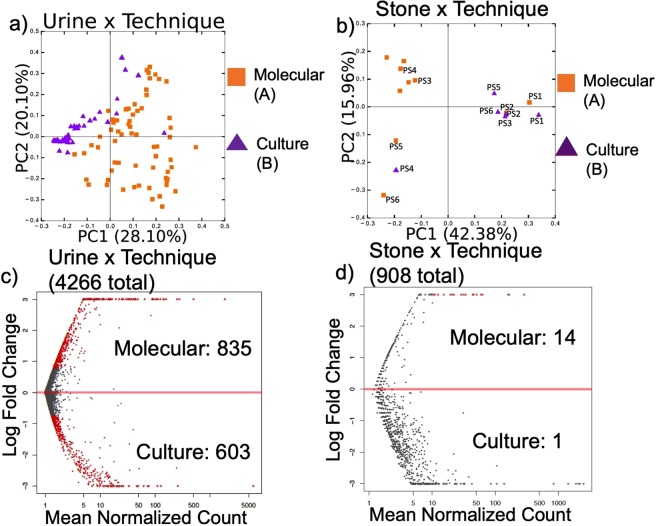
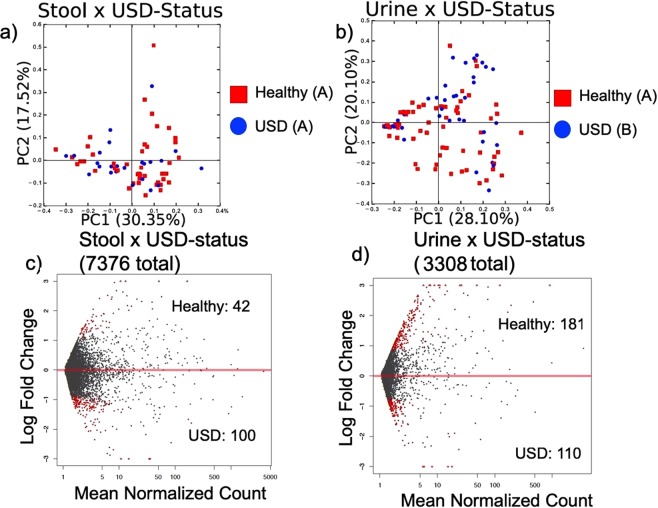
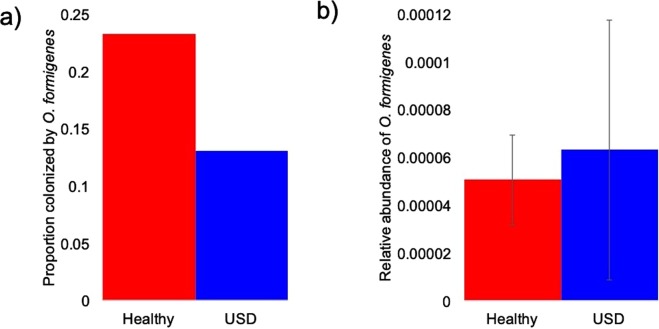
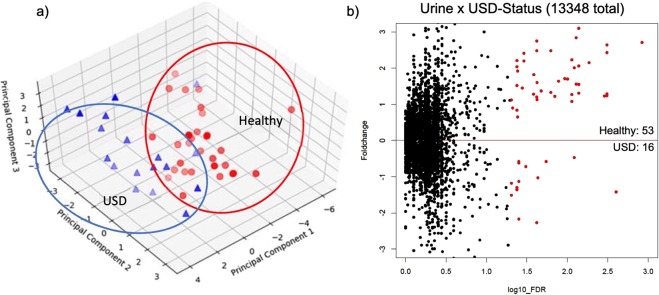
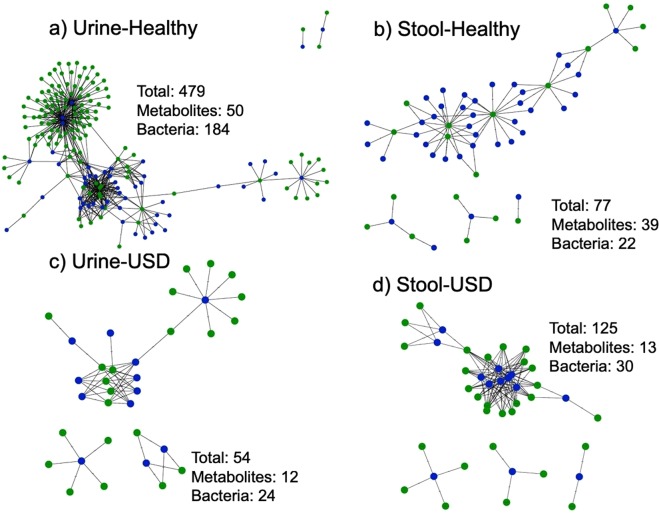
The prevalence of urinary stone disease (USD) is rapidly rising. However, the factors driving this increase are unknown. Recent microbiome studies suggest that dysbiosis may in part contribute to the increasing prevalence. The objective of the current study was to determine the nature and location of dysbiosis associated with USD. We conducted microbiome analysis from the gastrointestinal and urinary tracts, along with a metabolomic analysis of the urinary metabolome, from subjects with an active episode of USD or no history of the disease. Higher rates of antibiotic use among USD patients along with integrated microbiome and metabolomic results support the hypothesis that USD is associated with an antibiotic-driven shift in the microbiome from one that protects against USD to one that promotes the disease. Specifically, our study implicates urinary tract Lactobacillus and Enterobacteriaceae in protective and pathogenic roles for USD, respectively, which conventional, culture-based methods of bacterial analysis from urine and kidney stones would not necessarily detect. Results suggest that antibiotics produce a long-term shift in the microbiome that may increase the risk for USD, with the urinary tract microbiome holding more relevance for USD than the gut microbiome.


Conflict of interest statement

The authors declare no competing interests.

Figures

Figure 1
Figure 1
Microbiome analysis by specimen type. (a) PCoA plots based on a weighted UniFrac analysis by specimen type, with each principal component listed with % of the dissimilarity explained by the coordinate. Statistical significance was determined by an Adonis with 999 permutations. Letters denote differences with p < 0.05. (b,c) The differential abundance of OTUs by specimen type as assessed by a negative binomial Wald test. Red dots indicate significantly different OTUs (FDR < 0.05), gray dots indicate non-significant OTUs. Listed are the total number of OTUs defined within the group, along with the number of OTUs enriched in each specimen type. (d) The average proportion of OTUs found in both stool and urine, or urine and stone by USD-status. There were no significant differences by group.
Figure 2
Figure 2
Microbiome analysis by technique. (a,b) PCoA plots based on a weighted UniFrac analysis by technique for bacterial analysis, with each principal component listed with % of the dissimilarity explained by the coordinate. Statistical significance was determined by an Adonis with 999 permutations. Letters denote differences with p < 0.05. PS = “Paired Sample” and indicates the paired stone samples (molecular vs. culture). (c,d) The differential abundance of OTUs by technique as assessed by a negative binomial Wald test. Red dots indicate significantly different OTUs (FDR < 0.05), gray dots indicate non-significant OTUs. Listed are the total number of OTUs defined within the group, along with the number of OTUs enriched in each specimen type by group.
Figure 3
Figure 3
Microbiome analysis by USD-status. (a,b) PCoA plots based on a weighted UniFrac analysis by USD-status, with each principal component listed with % of the dissimilarity explained by the coordinate. Statistical significance was determined by an ANOSIM with 999 permutations. Letters denote differences with p < 0.05. (c,d) The differential abundance of OTUs by USD status as assessed by a negative binomial Wald test. Red dots indicate significantly different OTUs (FDR < 0.05), gray dots indicate non-significant OTUs. Listed are the total number of OTUs defined within the group, along with the number of OTUs enriched in each specimen type by group.
Figure 4
Figure 4
Metrics associated with Oxalobacter formigenes between healthy and USD groups. (a) Colonization rate of O. formigenes between groups. Significance was determined by a relative risk test, followed by a post-hoc Fisher’s exact test (p > 0.05); (b) Relative abundance of O. formigenes. Significance was determined by a student’s t-test (p > 0.05).
Figure 5
Figure 5
Urinary metabolomic data. (a) PCA plot of creatinine-normalized metabolite concentrations by group. (b) Metabolites significantly different between healthy and USD groups (red circles). The number of significantly different metabolites are indicated for each group.
Figure 6
Figure 6
Microbe-Metabolite interaction networks of microbes and metabolites significantly enriched in the healthy or USD groups, for the urine metabolome & both the urine and stool microbiome. Blue = metabolites, green = microbes. Listed are the total number of interactions, number of metabolites involved, and number of bacteria involved. (a) Healthy, urine metabolome × urine microbiome; (b) Healthy, urine metabolome × stool microbiome; (c) USD, urine metabolome × urine microbiome; (d) USD, urine metabolome × stool microbiome.

References

    1. Scales CD, Smith AC, Hanley JM, Saigal CS. & Project, U. D. i. A. Prevalence of kidney stones in the United States. European urology. 2012;62:160–165. doi: 10.1016/j.eururo.2012.03.052. - DOI - PMC - PubMed
    1. Ng M, et al. Global, regional, and national prevalence of overweight and obesity in children and adults during 1980–2013: a systematic analysis for the Global Burden of Disease Study 2013. The lancet. 2014;384:766–781. doi: 10.1016/S0140-6736(14)60460-8. - DOI - PMC - PubMed
    1. Schnabel RB, et al. 50 year trends in atrial fibrillation prevalence, incidence, risk factors, and mortality in the Framingham Heart Study: a cohort study. The Lancet. 2015;386:154–162. doi: 10.1016/S0140-6736(14)61774-8. - DOI - PMC - PubMed
    1. Menke A, Casagrande S, Geiss L, Cowie CC. Prevalence of and trends in diabetes among adults in the United States, 1988–2012. Jama. 2015;314:1021–1029. doi: 10.1001/jama.2015.10029. - DOI - PubMed
    1. Loftus PA, Wise SK. Epidemiology of asthma. Current opinion in otolaryngology & head and neck surgery. 2016;24:245–249. doi: 10.1097/MOO.0000000000000262. - DOI - PubMed

Publication types