. 2019 Jul;40(7):962-974.
doi: 10.1002/humu.23745. Epub 2019 Apr 1.

Aberrant regulation of epigenetic modifiers contributes to the pathogenesis in patients with selenoprotein N-related myopathies

Affiliations

Aberrant regulation of epigenetic modifiers contributes to the pathogenesis in patients with selenoprotein N-related myopathies

Christoph Bachmann et al. Hum Mutat. 2019 Jul.

Abstract

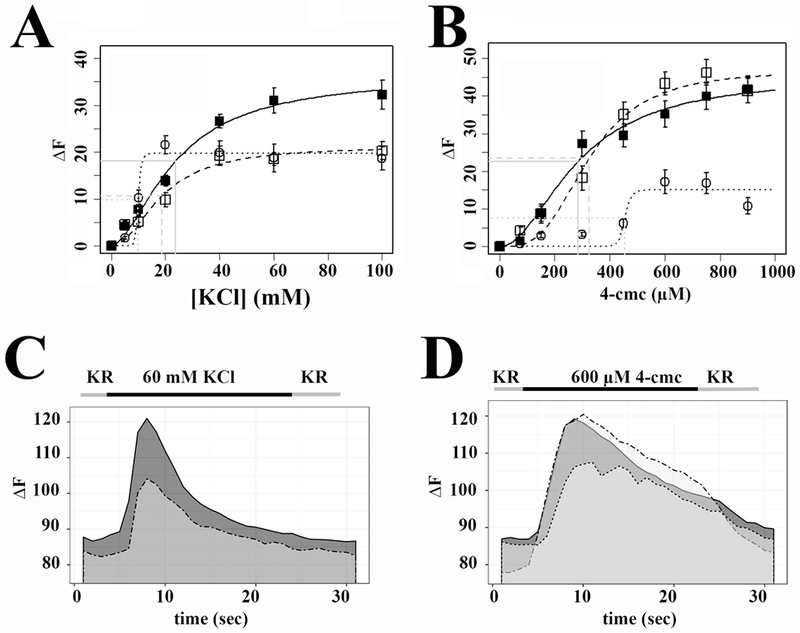
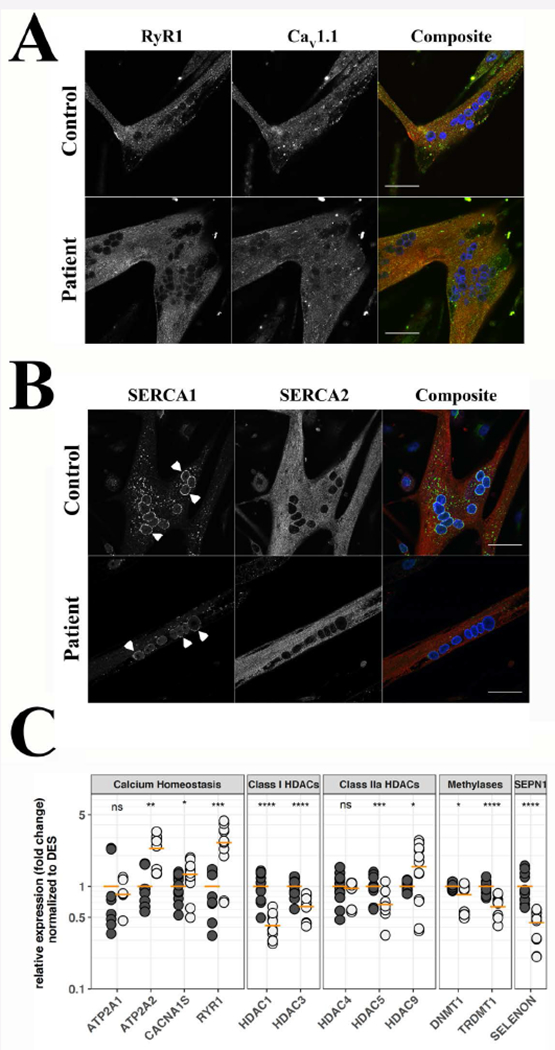
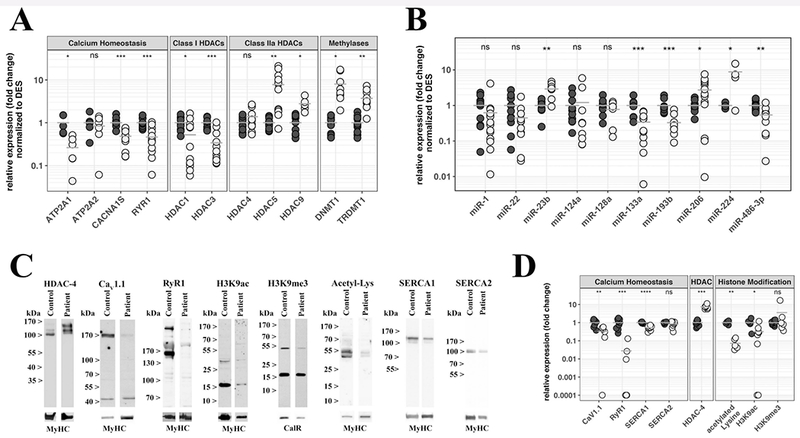
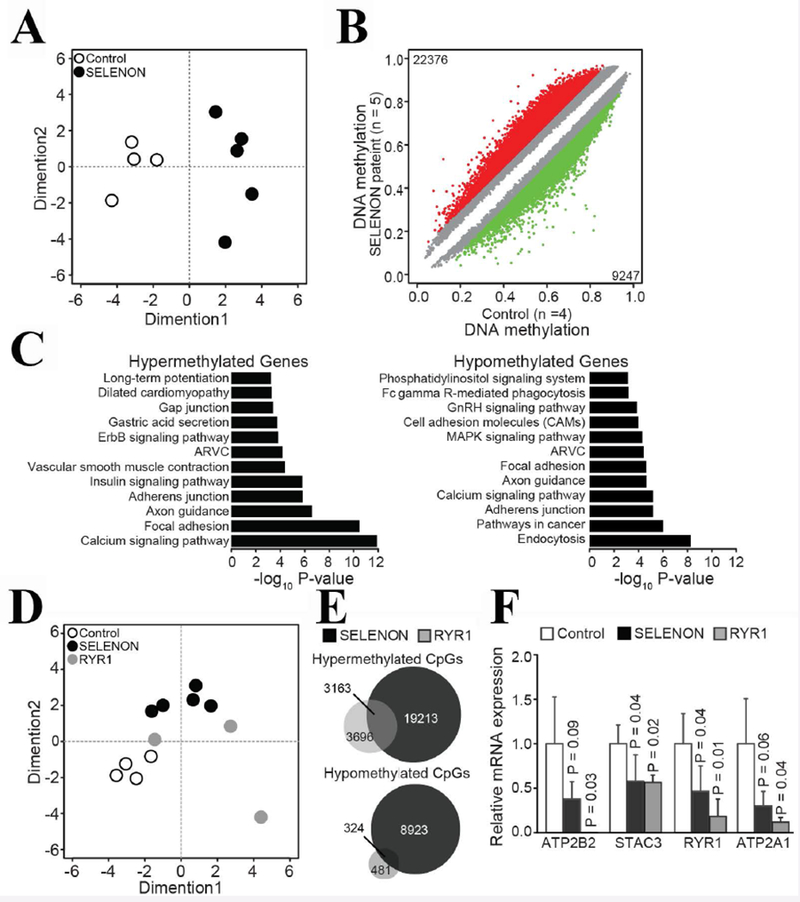
Congenital myopathies are early onset, slowly progressive neuromuscular disorders of variable severity. They are genetically and phenotypically heterogeneous and caused by pathogenic variants in several genes. Multi-minicore Disease, one of the more common congenital myopathies, is frequently caused by recessive variants in either SELENON, encoding the endoplasmic reticulum glycoprotein selenoprotein N or RYR1, encoding a protein involved in calcium homeostasis and excitation-contraction coupling. The mechanism by which recessive SELENON variants cause Multiminicore disease (MmD) is unclear. Here, we extensively investigated muscle physiological, biochemical and epigenetic modifications, including DNA methylation, histone modification, and noncoding RNA expression, to understand the pathomechanism of MmD. We identified biochemical changes that are common in patients harboring recessive RYR1 and SELENON variants, including depletion of transcripts encoding proteins involved in skeletal muscle calcium homeostasis, increased levels of Class II histone deacetylases (HDACs) and DNA methyltransferases. CpG methylation analysis of genomic DNA of patients with RYR1 and SELENON variants identified >3,500 common aberrantly methylated genes, many of which are involved in calcium signaling. These results provide the proof of concept for the potential use of drugs targeting HDACs and DNA methyltransferases to treat patients with specific forms of congenital myopathies.

Keywords: congenital myopathies; epigenetics; excitation-contraction coupling; gene expression; ryanodine receptor.


Conflict of interest statement

Conflict of interest: The Authors have declared that no conflict of interest exists.

Figures

Figure 1:
Figure 1:. Calcium homeostasis and ECC are affected by the presence of SELENON mutations.
A. Depolarization (KCl) dose response curve; controls, black squares continuous line; patient N° 17, open squares dashed line; patient N°18, open circles, dotted line. B 4-chloro-m-cresol dose response curve; controls, black squares continuous line; patient N° 17, open squares dashed line; patient N°18, open circles dotted line C. Representative traces showing changes in [Ca2+]i induced by stimulation with 60 mM KCl. Continuous line, control; dashed line, patient N°17. D. Representative trace showing changes in [Ca2+]i induced by stimulation with 600 µM 4-chloro-m-cresol. Continuous line, control; dashed line patient N° 17; dotted line patient N° 18. In panels A and B, each symbol represents the mean (±SEM) peak calcium released by 5-10 myotubes.
Figure 2:
Figure 2:. Cellular distribution of RyR1, Cav1.1, SERCA1 and SERCA2 and expression of selected transcripts, in differentiated myotubes from SELENON patients and healthy control.
A. Subcellular distribution of RyR1 and Cav1.1. B. Subcellular distribution of SERCA1 and SERCA2. Myotubes were visualized with a Nikon A1 plus confocal microscope equipped with a Plan Apo 60× oil objective (NA 1.4). Top panels show myotubes from a healthy control, bottom panels show myotubes from patient N° 17. The images corresponding to RyR1 are pseudocoloured in red and those corresponding to Cav1.1 in green in the composite images (right); the images corresponding to SERCA1 are pseudocoloured in green and those corresponding to SERCA2 in red in the composite images (right); DAPI (nucleus) staining is blue; orange pixels show areas of co-localization. Arrowheads in B indicate perinuclear staining of SERCA1. Bar indicates 50 µm. C. Expression levels of the indicated transcripts, as assessed by qPCR. Black circles control cells, grey circles patient cells. qPCRs were repeated 4 times on separate myotube cultures from the two patients. Horizontal orange line indicates the mean expression level in pooled data from patient N° 17 and 18. Pooled levels from control myotubes were set as 1. *P<0.05; ** <0.01; *** P<0.001; **** P<0.0001; n.s. not significantly different. Student’s t test.
Figure 3:
Figure 3:. Muscles from SELENON patients show significant changes in the expression levels of transcripts and proteins involved in ECC and in epigenetic regulation.
A. Expression levels of the indicated transcripts were determined by qPCR and normalized to the expression of DES. B. Expression levels of the indicated miRs were determined by qPCR and normalized to RNU44. Each reaction was performed in duplicate on muscle biopsies from healthy controls (black circles) and SELENON patients (empty circles). C. Western blot analysis and protein quantification of selected proteins. Top lanes, representative immunoblots probed with the indicated antibodies. Lower lanes show immunoreactivity to an antibody recognizing all MyHC isoform or the ER protein calreticulin used to normalize for protein loading. D. Comparison of the relative expression of the indicated proteins in muscle extracts from healthy controls (black circles), and SELENON patients (empty circles). Results were prepared using Excel’s “Conditional Formatting Plugin”. The relative protein content in patients was compared to that found in healthy controls that was set to 1. The horizontal grey bar represents the mean content levels in patient muscles. *P<0.05; **P<0.01; ***P<0.001; ****P< 0.0001 Student’s t test.
Figure 4:
Figure 4:. Muscles of patients with congenital myopathies leading to reduced RyR1 content show common changes in CpG methylation.
A. Multidimensional Scaling (MDS) plot analysis of genome-wide methylation profiles separated healthy control © muscle sample from patients with SELENON myopathy. MDS plot includes all probes on the array. B. Scatter plot shows differential methylated CpGs in patients with SELENON myopathy. Colored dots represent significant hypomethylated (green) or hypermethylated (red) CpGs together with numbers. Number of samples are indicated with n. C. Enriched KEGG pathways (P<0.001) within hypermethylated or hypomethylated CpGs associated genes. D MDS plot including controls, SELENON and RYR1 samples. E. Venn diagram shows overlap of CpGs hypermethylated in SELENON and RYR1 samples. F. qPCR analysis of selected transcripts. The ATP2B2 expression level in patients with recessive RYR1 mutations was below the detection level. The genes encoding these transcripts were hypermethylated in patients’ muscles. Results are presented as relative expression compared to control. P-values were calculated with Welch two sample t-test and error bars denote S.D.

References

    1. Arbogast S, Beuvin M, Fraysse B, Zhou H, Muntoni F & Ferreiro A (2009). Oxidative stress in SEPN1-related myopathy: from pathophysiology to treatment. Annals of Neurolology, 65, 677–686. doi: 10.1002/ana.21644. - DOI - PubMed
    1. Bachmann C, Jungbluth H, Muntoni F, Manzur AY, Zorzato F & Treves S (2017). Cellular, biochemical and molecular changes in muscles from patients with X-linked myotubular myopathy due to MTM1 mutations. Human Molecular Genetics, 26, 320–332. doi: 10.1093/hmg/ddw388. - DOI - PubMed
    1. Barski A, Cuddapah S, Cui K, Ron TY, Schones DE, Wang Z, Wei G, Chepelev I & Zhao K (2007). High resolution profiling of histone methylation in the human genome. Cell, 129, 823–837. doi:10.1016/j.cell.2007.05.009. - DOI - PubMed
    1. Bartel DP (2009) MicroRNAs: target recognition and regulatory functions. Cell, 136, 215–233. doi: 0.1016/j.cell.2009.01.002. - PMC - PubMed
    1. Beharry AW & Judge AR (2015). Differential expression of HDAC and HAT genes in atrophying skeletal muscle. Muscle and Nerve, 52, 1098–1101. doi: 10.1002/mus.24912. - DOI - PMC - PubMed

Publication types