. 2019 Jun 25:671:452-465.
doi: 10.1016/j.scitotenv.2019.03.155. Epub 2019 Mar 12.

Relationship between ecological condition and ecosystem services in European rivers, lakes and coastal waters

Affiliations

Relationship between ecological condition and ecosystem services in European rivers, lakes and coastal waters

B Grizzetti et al. Sci Total Environ. .

Abstract

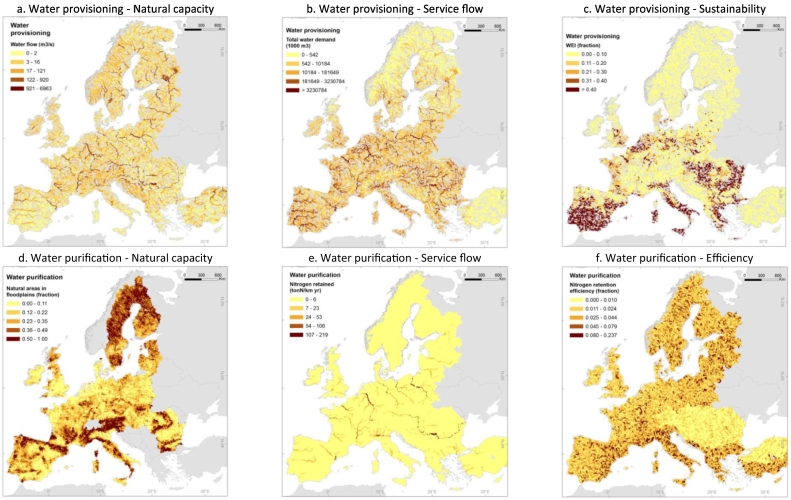
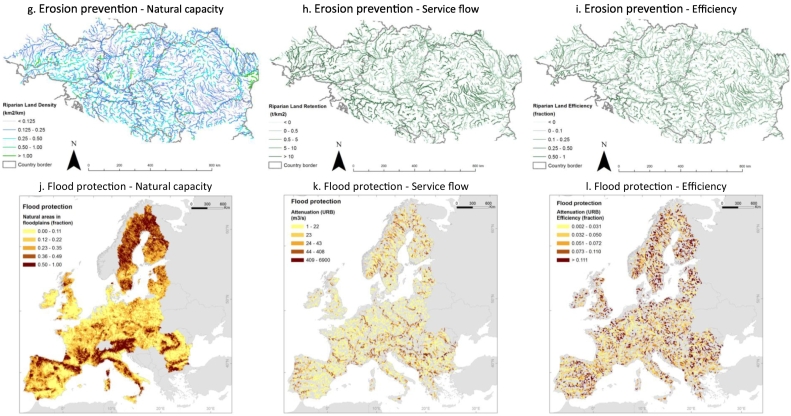
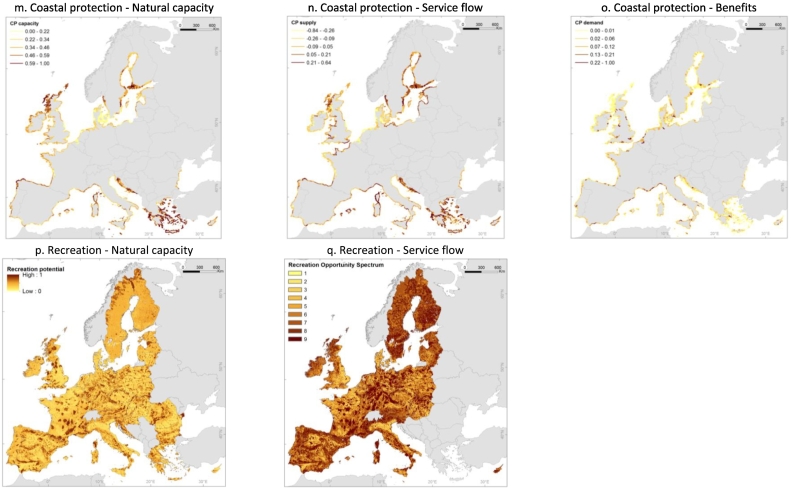
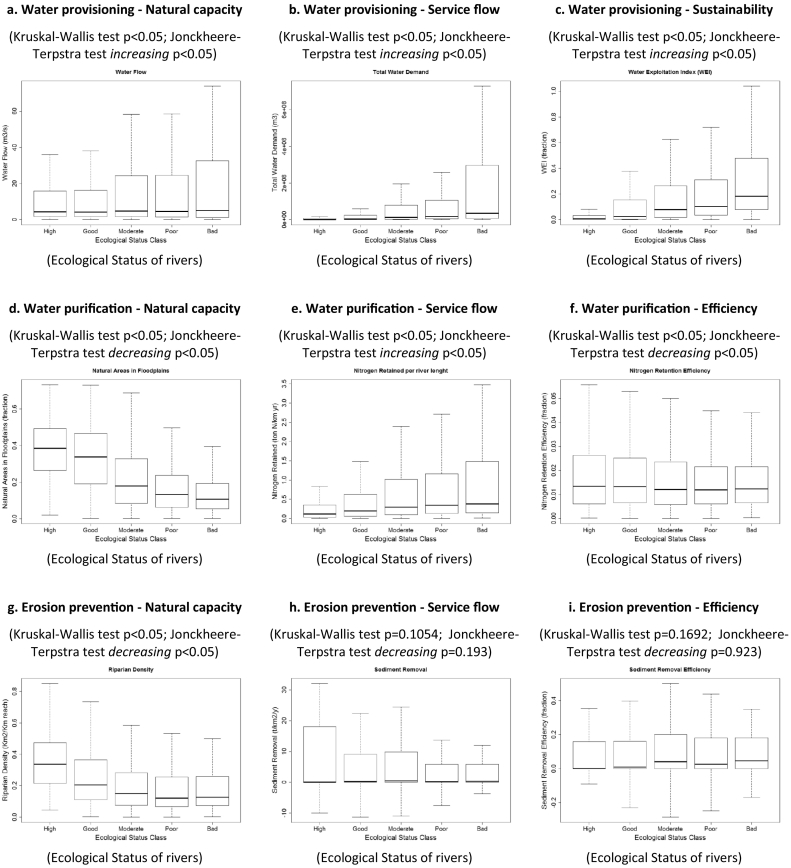
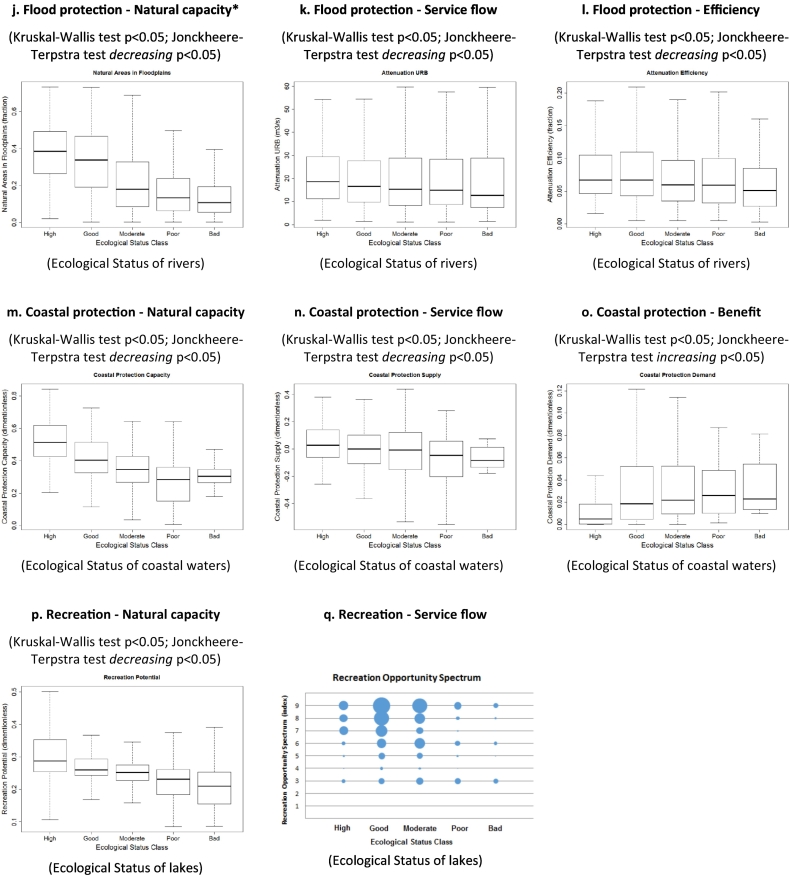
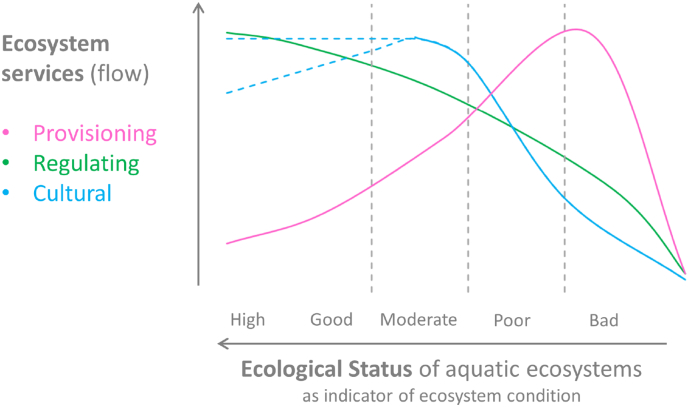
We quantify main ecosystem services (i.e. the contribution of ecosystems to human well-being) provided by rivers, lakes, coastal waters and connected ecosystems (riparian areas and floodplains) in Europe, including water provisioning, water purification, erosion prevention, flood protection, coastal protection, and recreation. We show European maps of ecosystem service capacity, flow (actual use), sustainability and efficiency. Then we explore the relationship between the services and the ecosystem condition at the European scale, considering the ecological status of aquatic ecosystems, reported under the EU Water Framework Directive, as a measure of the ecosystem integrity and biodiversity. Our results indicate that a higher delivery of the regulating and cultural ecosystem services analysed is mostly correlated with better conditions of aquatic ecosystems. Conversely, the use of provisioning services can result in pressures on the ecosystem. This suggests the importance of maintaining good ecological condition of aquatic ecosystems to ensure the delivery of ecosystem services in the future. These results at the continental scale, although limited to the ecosystem services under analysis, might be relevant to consider when investing in the protection and restoration of aquatic ecosystems called for by the current EU water policy and Biodiversity Strategy and by the United Nations Sustainable Development Goals.

Keywords: Biodiversity; Ecological status; Ecosystem condition; Ecosystem services; Europe; Sustainable Development Goals; Water Framework Directive.


Figures

Unlabelled Image
Graphical abstract
Fig. 1
Fig. 1
Conceptual framework to classify indicators of water ecosystem services.
Fig. 2
Fig. 2
European maps of the ecosystem services. Water provisioning in rivers and lakes: a. Natural capacity (total renewable water); b. Flow (total water demand, De Roo et al., 2012; Vandecasteele et al., 2014; Mubareka et al., 2013); c. Sustainability (Water Exploitation Index, WEI). Water purification in rivers and lakes (data refer to year 2005): d. Natural capacity (areas in floodplains, Pistocchi et al., 2015); e. Nitrogen retention in surface waters (Grizzetti et al., 2012); f. Nitrogen retention efficiency (based on the results of the GREEN model (Grizzetti et al., 2012)). Erosion prevention (data refers to annual means for the period 1995–2009) by riparian land in the Danube river basin (800,000 km2): g. Natural capacity (riparian land density, Vigiak et al., 2016 based on land map of Clerici et al., 2013); h. Flow (sediment removal by riparian land, Vigiak et al., 2016); i. Efficiency (efficiency of sediments removal, Vigiak et al., 2016). Flood protection in floodplains: j. Natural capacity (natural areas in floodplains, Pistocchi et al., 2015, it is the same as Fig. 2d); k. Flow (flood attenuation); l. Efficiency (efficiency of flood attenuation). Coastal protection (CP) in coastal areas (data are based on Liquete et al., 2016b and refer to year 2010): m. Natural capacity (coastal protection capacity); n. Flow (coastal protection supply); o. Benefits (coastal protection demand). Recreation (data are based on Zulian et al., 2013 and Liquete et al., 2016b and refer to year 2010): p. Natural capacity (Recreation Potential indicator); q. Flow (Recreation Opportunity Spectrum indicator, ROS) ROS values: 1 = Low provision not easily accessible, 2 = Low provision accessible, 3 = Low provision easily accessible, 4 = Medium provision not easily accessible, 5 = Medium provision accessible, 6 = Medium provision easily accessible, 7 = High provision not accessible, 8 = High provision accessible, 9 = High provision easily accessible.
Fig. 2
Fig. 2
European maps of the ecosystem services. Water provisioning in rivers and lakes: a. Natural capacity (total renewable water); b. Flow (total water demand, De Roo et al., 2012; Vandecasteele et al., 2014; Mubareka et al., 2013); c. Sustainability (Water Exploitation Index, WEI). Water purification in rivers and lakes (data refer to year 2005): d. Natural capacity (areas in floodplains, Pistocchi et al., 2015); e. Nitrogen retention in surface waters (Grizzetti et al., 2012); f. Nitrogen retention efficiency (based on the results of the GREEN model (Grizzetti et al., 2012)). Erosion prevention (data refers to annual means for the period 1995–2009) by riparian land in the Danube river basin (800,000 km2): g. Natural capacity (riparian land density, Vigiak et al., 2016 based on land map of Clerici et al., 2013); h. Flow (sediment removal by riparian land, Vigiak et al., 2016); i. Efficiency (efficiency of sediments removal, Vigiak et al., 2016). Flood protection in floodplains: j. Natural capacity (natural areas in floodplains, Pistocchi et al., 2015, it is the same as Fig. 2d); k. Flow (flood attenuation); l. Efficiency (efficiency of flood attenuation). Coastal protection (CP) in coastal areas (data are based on Liquete et al., 2016b and refer to year 2010): m. Natural capacity (coastal protection capacity); n. Flow (coastal protection supply); o. Benefits (coastal protection demand). Recreation (data are based on Zulian et al., 2013 and Liquete et al., 2016b and refer to year 2010): p. Natural capacity (Recreation Potential indicator); q. Flow (Recreation Opportunity Spectrum indicator, ROS) ROS values: 1 = Low provision not easily accessible, 2 = Low provision accessible, 3 = Low provision easily accessible, 4 = Medium provision not easily accessible, 5 = Medium provision accessible, 6 = Medium provision easily accessible, 7 = High provision not accessible, 8 = High provision accessible, 9 = High provision easily accessible.
Fig. 3
Fig. 3
Relationship between the indicators of the ecosystem services analysed in this study and the proxy of the ecological status for European aquatic ecosystems. p indicates the significance of the Kruskal-Wallis and the Jonckheere-Terpstra statistical tests. (*Fig. 3d is the same as 3j).
Fig. 3
Fig. 3
Relationship between the indicators of the ecosystem services analysed in this study and the proxy of the ecological status for European aquatic ecosystems. p indicates the significance of the Kruskal-Wallis and the Jonckheere-Terpstra statistical tests. (*Fig. 3d is the same as 3j).
Fig. 4
Fig. 4
Expected relationship between the level of ecosystem services (flow) and ecological status in aquatic ecosystems.

References

    1. Acuña V., Díez J.R., Flores L., Meleason M., Elosegi A. Does it make economic sense to restore rivers for their ecosystem services? J. Appl. Ecol. 2013;50:988–997.
    1. Adams W.M. The value of valuing nature. Science. 2014;346(6209):549–551. - PubMed
    1. Alfieri L., Salamon P., Bianchi A., Neal J., Bates P., Feyen L. Advances in pan-European flood hazard mapping. Hydrol. Process. 2014;28:4067–4077.
    1. Arnold J.G., Moriasi D., Gassman P.W., Abbaspour K.C., White M.J., Srinivasan R., Santhi C., Harmel R.D., van Griensven A., Van Liew M.W., Kannan N., Jha M. SWAT: model use, calibration, and validation. Trans. ASABE. 2012;55:1491–1508.
    1. Billen G., Lancelot C., Meybeck M. Ocean Margin Processes in Global Change Dahlam Workshop (Berlin, 1990) 1991. N, P, and Si retention along the aquatic continuum from land to ocean; pp. 19–44.

LinkOut - more resources