. 2019 Jun;160(6):1281-1296.
doi: 10.1097/j.pain.0000000000001523.

Platelet-derived growth factor activates nociceptive neurons by inhibiting M-current and contributes to inflammatory pain

Affiliations

Platelet-derived growth factor activates nociceptive neurons by inhibiting M-current and contributes to inflammatory pain

Omer Barkai et al. Pain. 2019 Jun.

Abstract

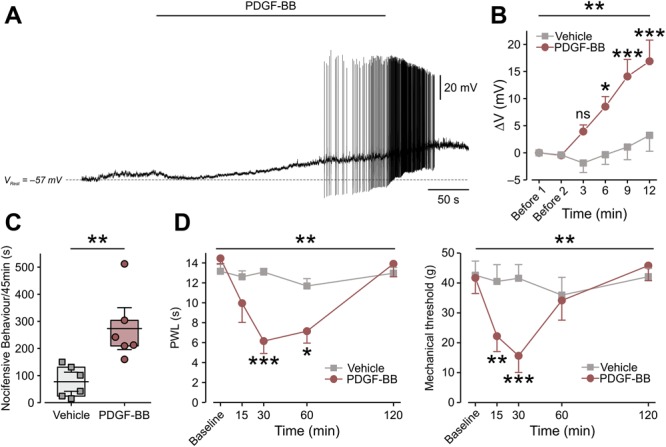
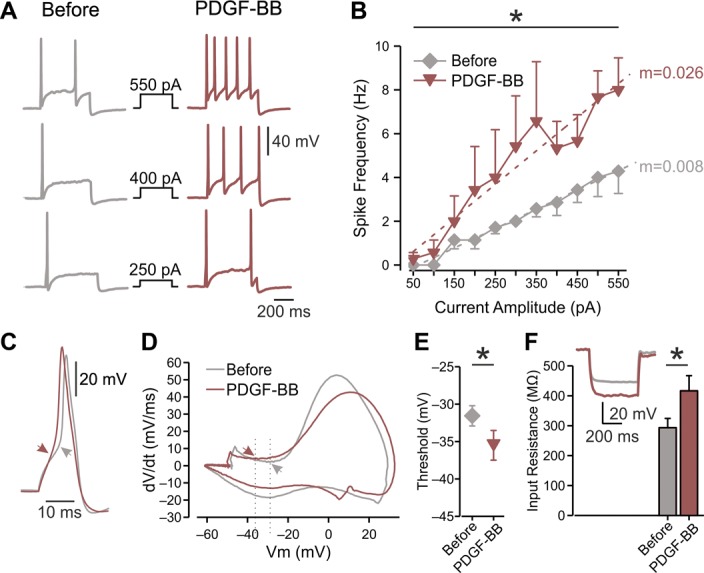
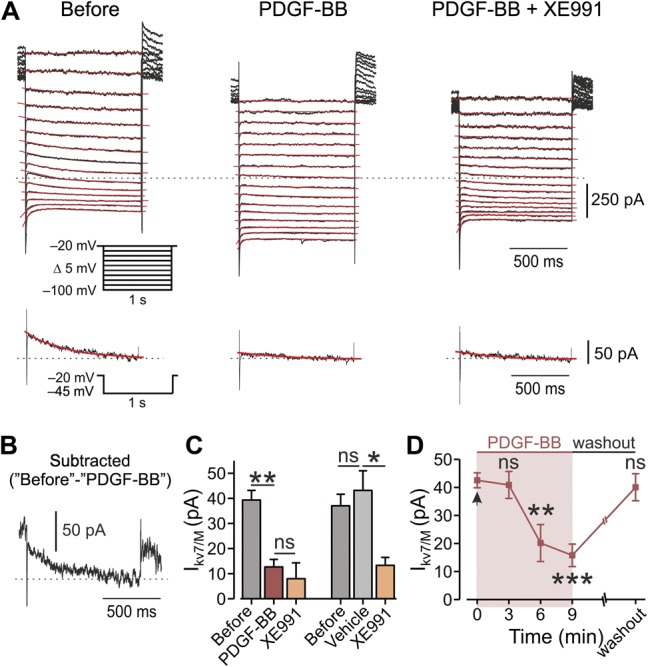
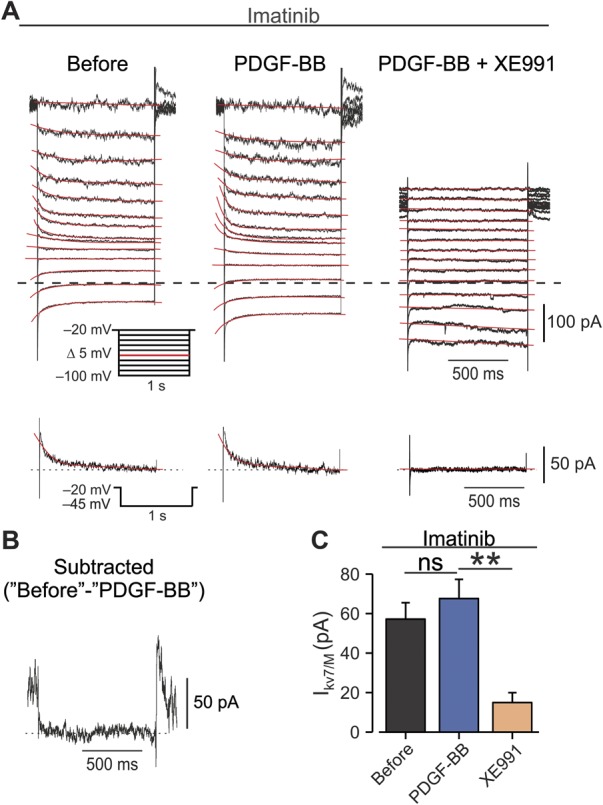
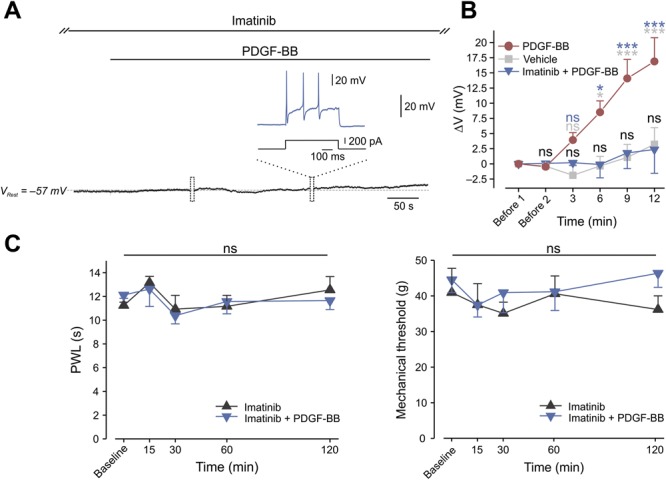
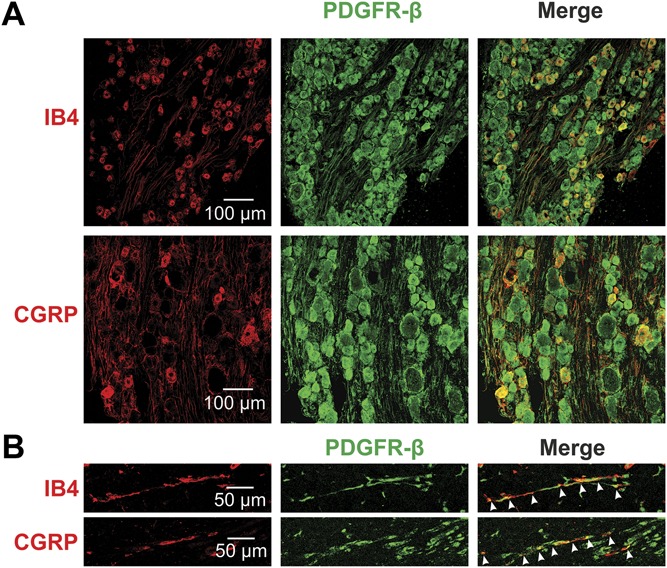
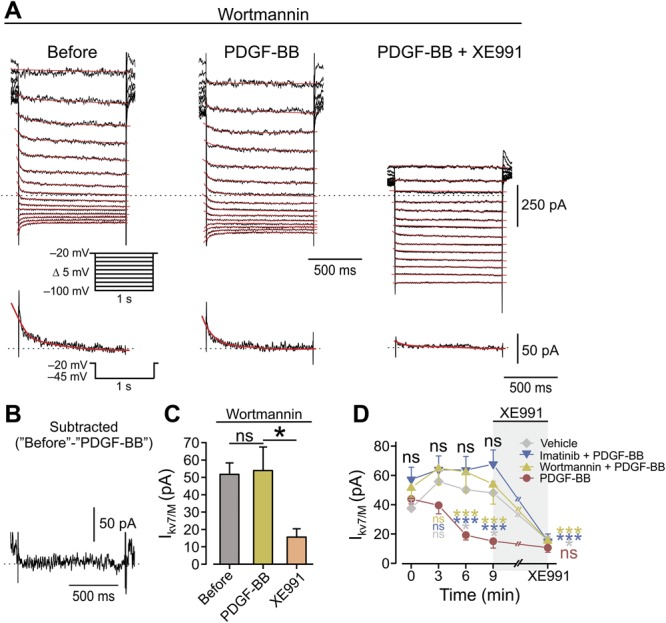
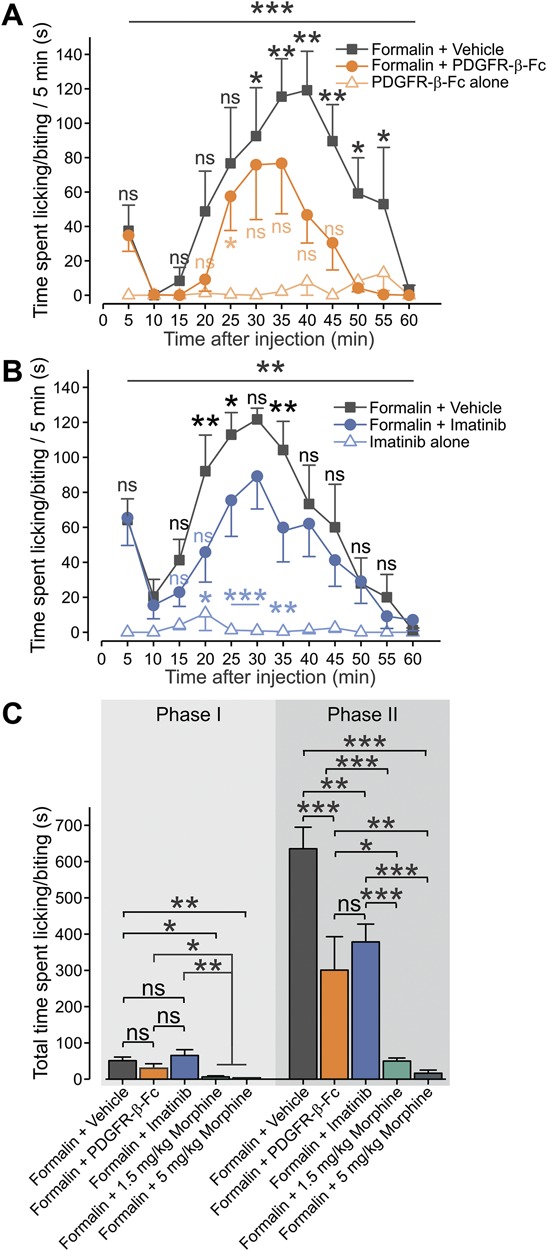
Endogenous inflammatory mediators contribute to the pathogenesis of pain by acting on nociceptors, specialized sensory neurons that detect noxious stimuli. Here, we describe a new factor mediating inflammatory pain. We show that platelet-derived growth factor (PDGF)-BB applied in vitro causes repetitive firing of dissociated nociceptor-like rat dorsal root ganglion neurons and decreased their threshold for action potential generation. Injection of PDGF-BB into the paw produced nocifensive behavior in rats and led to thermal and mechanical pain hypersensitivity. We further detailed the biophysical mechanisms of these PDGF-BB effects and show that PDGF receptor-induced inhibition of nociceptive M-current underlies PDGF-BB-mediated nociceptive hyperexcitability. Moreover, in vivo sequestration of PDGF or inhibition of the PDGF receptor attenuates acute formalin-induced inflammatory pain. Our discovery of a new pain-facilitating proinflammatory mediator, which by inhibiting M-current activates nociceptive neurons and thus contributes to inflammatory pain, improves our understanding of inflammatory pain pathophysiology and may have important clinical implications for pain treatment.


Conflict of interest statement

Sponsorships or competing interests that may be relevant to content are disclosed at the end of this article.

Figures

Figure 1.
Figure 1.
Platelet-derived growth factor-BB activates nociceptor-like cultured DRG neurons and induces nocifensive behavior and pain hypersensitivity. (A) Representative trace (12 of 18 neurons) of current-clamp perforated patch recordings from nociceptor-like cultured DRG neurons showing membrane voltage response to continuous focal application (marked by horizontal bar) of 125 ng/mL of PDGF-BB. Dashed lines indicate resting potentials before drug application (−57 mV). (B) Mean ± SEM of changes in resting membrane potential ΔV (Vt − V0) after focal application of PDGF-BB alone (red) or vehicle (5 μM HCl, light gray). Time point “Before 1” indicates the time where V0 values were measured (3 minutes before application of either PDGF-BB or vehicle). Time point “Before 2” indicates the time just before application of either PDGF-BB or vehicle. ns, not significant, *P < 0.05, **P < 0.01; ***P < 0.001; Repeated-measures (RM) 2-way ANOVA with post hoc Bonferroni. In the “PDGF-BB,” only neurons that showed depolarization without firing (n = 6 neurons) were used for the analysis; n = 5 cells for the “Vehicle” group. (C) Graph comparing box plots and individual values of the total time (in seconds) spent by rats licking, biting, flinching, and guarding the hind paw (nocifensive behavior) during 45 minutes after intraplantar injection of 50 μg/mL of PDGF-BB or its vehicle (2 mM of HCl). **P < 0.01; Student t-test; n = 6 rats per group. Box plots depict mean, 25th, 75th percentile, and SD. (D) The decrease in thermal (radiant heat) paw withdrawal latency (PWL, left) and mechanical threshold (electronic von Frey, right) after intraplantar injection of 12 μg/mL of PDGF-BB as compared to injection of vehicle (500 μM HCl, n = 6 rats per group, ***P < 0.001; **P < 0.01; RM 2-way ANOVA with post hoc Bonferroni). ANOVA, analysis of variance; DRG, dorsal root ganglion; PDGF, platelet-derived growth factor.
Figure 2.
Figure 2.
Platelet-derived growth factor-BB increases the excitability of nociceptor-like DRG neurons and increases the Rin. (A) Representative traces of typical voltage responses to 500 ms current steps (shown in middle) recorded from the same neuron before (left) and after ∼15 minutes of focal continuous application of 125 ng/mL of PDGF-BB (right, representative of n = 7). (B) Mean frequency–intensity (f-I) curves of DRG neurons recorded before (gray diamonds) and ∼15 minutes after (red inverted triangles) application of PDGF-BB. Note that PDGF-BB induced a significant increase in gain (m, dotted lines; *P < 0.05, paired t test; n = 7, see also Table 1). (C) Superimposed representative traces of a single action potential recorded from the same neuron before (gray) and after (red) the application of PDGF-BB. Arrows indicate the AP threshold, derived from the phase plots shown in (D). (D) Representative phase plots of rate of change of the membrane potential (dV/dt) vs membrane potential (Vm) during an action potential recorded from the same neuron before (gray) and 10 to 20 minutes after the application of PDGF-BB (red). Arrows and dashed lines indicate shift in threshold voltage and quantified in (E). (E) Thresholds for generation of action potentials calculated from the same neurons before and ∼15 minutes after application of PDGF-BB (mean ± SEM, *P < 0.05, paired t test, n = 7). (F) Bar graph depicting Rin before (gray) and after ∼15 minutes exposure to PDGF-BB (red); *P < 0.05, paired t test, n = 8. Inset: representative typical voltage responses to 500 ms, −100 pA current before (gray) and after (red) the treatment with PDGF-BB. All measurements described in this figure were performed at the native resting potential of each cell, adjusted after PDGF-BB application by injecting the appropriate repolarizing DC currents. AP, action potential; DRG, dorsal root ganglion; PDGF, platelet-derived growth factor.
Figure 3.
Figure 3.
Application of PDGF-BB leads to inhibition of IM in DRG neurons. (A) Voltage-clamp perforated patch recordings from DRG neurons showing families of IM evoked by a series of 1-second, 5-mV hyperpolarizing voltage steps from a holding potential of −20 mV (shown in inset). The 3 subpanels show the current responses before (left), after focal application of 125 ng/mL of PDGF-BB (middle), and after bath application of 10 μM of XE991 on top of focal application of PDGF-BB (right). The dotted line indicates zero current level. The current response obtained by stepping to −45 mV is shown at the bottom of each subpanel. The IM relaxation was fitted with a biexponential line (red), which was extrapolated to the beginning of the voltage step. (B) Subtracted trace of IM evoked by stepping to −45 mV before the application of PDGF-BB minus IM trace evoked by stepping to −45 mV after PDGF. (C) Left, bar graph depicting mean ± SEM of peak IM amplitude (measured by stepping to −45 mV), before (gray), 10 minutes after the application of PDGF-BB (red), and 10 minutes after the treatment with XE991 on top of PDGF-BB (orange). **P < 0.01, ns, not significant, RM one-way ANOVA with post hoc Bonferroni test, n = 7 neurons. Right, same as left but showing that a 10-minute application of vehicle (light gray) has no effect on IM amplitude, ns, not significant, *P < 0.05, RM one-way ANOVA with post hoc Bonferroni test n = 5 neurons. (D) Peak IM amplitude (measured by stepping to −45 mV, mean ± SEM), plotted vs time of application of PDGF-BB. Platelet-derived growth factor-BB application is indicated by the arrow (time “0”). One-way ANOVA with post hoc Bonferroni test, n = 13 neurons for 6 minutes, n = 11 neurons for 9 minutes. In 7 out of 9 neurons, ∼15 minutes washout of PDGF-BB led to full recovery of IM. ns, not significant; **P < 0.01. ANOVA, analysis of variance; DRG, dorsal root ganglion; PDGF, platelet-derived growth factor; RM, repeated-measures.
Figure 4.
Figure 4.
Inhibition of PDGFR prevents PDGF-BB–mediated IM attenuation. (A) Voltage-clamp perforated patch recordings from DRG neurons treated before and during the experiment with extracellular solution containing 10 µM of imatinib. Families of IM evoked by a series of 1-second, 5-mV hyperpolarizing voltage steps from a holding potential of −20 mV (shown in inset). The 3 subpanels show the current responses in cells treated with imatinib, before (left), after focal application of 125 ng/mL of PDGF-BB (middle), and after bath application of 10 μM of XE991 on top of focal application of PDGF-BB (right). The dotted line indicates zero current level. The current response obtained by stepping to −45 mV is shown at the bottom of each subpanel. (B) Subtracted IM trace, evoked by a −45-mV step before application of PDGF-BB from an IM trace evoked by the same step after PDGF-BB. (C) Bar graph depicting mean ± SEM of peak IM amplitude (measured by stepping to −45 mV) in cells treated with 10 µM of imatinib before (gray), 10 minutes after the application of PDGF-BB (blue), and 10 minutes after the bath application of XE991 on top of PDGF-BB (orange). n = 7, ns, not significant, **P < 0.01, RM one-way ANOVA with post hoc Bonferroni test. ANOVA, analysis of variance; DRG, dorsal root ganglion; PDGF, platelet-derived growth factor; RM, repeated-measures.
Figure 5.
Figure 5.
PDGFR is required for PDGF-BB–induced spontaneous firing and hypersensitivity to pain. (A) Representative trace (7 of 7 neurons) of membrane voltage changes in nociceptor-like cultured DRG neurons treated with 10 µM of imatinib. In these conditions, focal application (marked by the horizontal bar) of 125 ng/mL of PDGF-BB did not lead to membrane depolarization. Free-run recording was interrupted (marked by boxes) to examine the excitable properties of the neuron. Dashed lines indicate resting potentials before drug application (−57 mV). All recorded neurons (n = 7) showed no PDGF-BB–induced hyperexcitability, but fired normally in response to a depolarizing current step (inset). (B) Mean ± SEM of changes in resting membrane potential ΔV (Vt − V0) after focal application of PDGF-BB alone (red), vehicle (5 μM of HCl, light gray), or PDGF-BB on cells pretreated with imatinib (blue). Time point “Before 1” indicates the time where V0 values were measured (3 minutes before application of either PDGF-BB or vehicle). Time point “Before 2” indicates the time just before application of either PDGF-BB or vehicle. ns, not significant, *P < 0.05, **P < 0.01; ***P < 0.001; blue asterisks—comparison between “PDGF-BB” and “Vehicle” groups; light gray asterisks—comparison between “PDGF-BB” and “Imatinib + PDGF-BB” groups; black—comparison between “Imatinib + PDGF-BB” and “Vehicle” groups. RM 2-way ANOVA with post hoc Bonferroni, n = 5 cells in each group. The data of “PDGF-BB” and “Vehicle” is presented in Figure 1B and used here for the convenient comparison between these groups and the “Imatinib + PDGF-BB” group. Note that there is no significant difference between the “Imatinib + PDGF-BB” and the vehicle group. (C) Paw withdrawal latency (PWL, radiant heat, left) and mechanical threshold (von Frey, right) after intraplantar injection of 12 µg/mL of PDGF-BB together with 12 ng/g of imatinib as compared to injection of imatinib alone (12 ng/g). n = 6 rats per group, ns, not significant, RM 2-way ANOVA with post hoc Bonferroni. ANOVA, analysis of variance; DRG, dorsal root ganglion; PDGF, platelet-derived growth factor; RM, repeated-measures.
Figure 6.
Figure 6.
PDGFR-β is expressed in nociceptive DRG neurons and in nociceptive fibers. (A) PDGFR-β is colocalized with markers of nociceptive neurons (IB4, CGRP) shown by immunohistochemistry of rat DRG. (B) Immunohistochemical analysis of rat skin showing the expression of PDGFR-β in fibers also expressing the nociceptive markers IB4 and CGRP. Arrows indicate the double-labeled axons. CGRP, calcitonin gene-related peptide; DRG, dorsal root ganglion.
Figure 7.
Figure 7.
Inhibition of PI3K pathway prevents PDGF-induced inhibition of IM. (A) Voltage-clamp perforated patch recordings from DRG neurons pretreated before the experiment and perfused during the experiment with extracellular solution containing 20 nM of wortmannin. Families of IM evoked by a series of 1-second, 5-mV hyperpolarizing voltage steps from a holding potential of −20 mV (shown in inset). The 3 subpanels show the current responses in cells treated with wortmannin, before (left), after the focal application of 125 ng/mL of PDGF-BB (middle), and after the bath application of 10 μM of XE991 on top of focal application of PDGF-BB (right). The dotted line indicates zero current level. The current response obtained by stepping to −45 mV is shown at the bottom of each subpanel. (B) Subtracted trace of IM trace evoked by stepping to −45 mV before application of PDGF-BB minus IM trace evoked by stepping to −45 mV after PDGF-BB. (C) Bar graph depicting mean ± SEM of peak IM amplitude in cells pretreated with 20 nM of wortmannin and measured by stepping to −45 mV, before (gray), 10 minutes after the application of PDGF-BB (yellow), and 10 minutes after the bath application of XE991 on top of PDGF-BB (orange). ns, not significant, *P < 0.05, RM one-way ANOVA with post hoc Bonferroni test, n = 7. (D) Comparison of changes in peak IM amplitude (measured by stepping to −45 mV, mean ± SEM) with time, after focal application of PDGF-BB (red circles), vehicle (light gray diamonds), PDGF-BB onto cells treated with imatinib (blue inverted triangles), and PDGF-BB onto cells treated with wortmannin (yellow triangles). Black letters “ns”, comparison by the time points between the “Vehicle,” “Imatinib + PDGF-BB,” and “Wortmannin + PDGF-BB” groups; light gray letters and asterisks—comparison by the time points between the “PDGF-BB” and the “Vehicle” groups; blue letters and asterisks—comparison by the time points between the “PDGF-BB” and the “Imatinib + PDGF-BB” groups; orange letters and asterisks—comparison by the time points between the “PDGF-BB” and the “Wortmannin + PDGF-BB” groups. RM 2-way ANOVA with post hoc Bonferroni test, n = 9 for the “PDGF-BB” group; n = 7 neurons for the “Imatinib + PDGF-BB” and the “Wortmannin + PDGF-BB” groups, n = 4 for the “Vehicle” group. ns, not significant; *P < 0.05; ***P < 0.001. In each experiment, 10 minutes after the application of either PDGF-BB or vehicle, XE991 was added for 7 minutes (light gray shading). At time point “XE991,” the statistical comparison shown is between the peak IM amplitude values at the “9 minute” time point and the values after ∼7 minutes of XE991. ns, not significant; *P < 0.05; ***P < 0.001. ANOVA, analysis of variance; DRG, dorsal root ganglion; PDGF, platelet-derived growth factor; RM, repeated-measures.
Figure 8.
Figure 8.
Platelet-derived growth factor scavenging and inhibition of PDGFR reduces formalin-induced inflammatory pain. (A) Mean ± SEM of duration of paw licking and biting per 5 minutes plotted vs time after injection of 2% formalin with vehicle (PBS, gray squares); 2% formalin with 500 ng/40 μL of PDGFR-β-Fc (orange circles) and 500 ng/40 μL of PDGFR-β-Fc alone (light orange triangles). RM two-way ANOVA with post hoc Bonferroni, n = 6 rats per group; black bar and asterisks—comparison between the “Formalin + vehicle” and the “Formalin + PDGFR-β-Fc” groups; light orange bar and asterisks—comparison between the “PDGFR-β-Fc alone” and the “Formalin + PDGFR-β-Fc” groups. (B) Mean ± SEM of duration of paw licking and biting per 5 minutes plotted vs time after injection (at time “0”) of 2% formalin (dark gray); 2% formalin together with 60 ng/g of imatinib (blue) and 60 ng/g of imatinib alone (light blue). RM 2-way ANOVA with post hoc Bonferroni; n = 6 rats per group, ns, not significant; *P < 0.05; **P < 0.01, ***P < 0.001 black bar and asterisks—comparison between the “Formalin + vehicle” and the “Formalin + imatinib” groups; light blue bar and asterisks—comparison between the “Imatinib alone” and the “Formalin + imatinib” groups. (C) Summary of mean ± SEM of total duration of time spent in licking and biting in phase I (0-10 minutes) and phase II (10-60 minutes) after injection of 2% formalin with vehicle (dark gray); 2% formalin together with 500 ng/40 μL of PDGFR-β-Fc (orange); 2% formalin together with 60 ng/g of imatinib (blue); 2% formalin together with 1.5 mg/kg (green) and 5 mg/kg of morphine (dark green) Student t-test; ns, not significant; *P < 0.05, **P < 0.01; ***P < 0.001; n = 6 animals in all groups apart from the “Formalin + vehicle” group containing n = 12 animals. ANOVA, analysis of variance; PDGF, platelet-derived growth factor; RM, repeated-measures.

References

    1. Abbadie C, Taylor BK, Peterson MA, Basbaum AI. Differential contribution of the two phases of the formalin test to the pattern of c-fos expression in the rat spinal cord: studies with remifentanil and lidocaine. PAIN 1997;69:101–10. - PubMed
    1. Alhadeff AL, Su Z, Hernandez E, Klima ML, Phillips SZ, Holland RA, Guo C, Hantman AW, De Jonghe BC, Betley JN. A neural circuit for the suppression of pain by a competing need state. Cell 2018;173:140–52.e115. - PMC - PubMed
    1. Andrae J, Gallini R, Betsholtz C. Role of platelet-derived growth factors in physiology and medicine. Genes Dev 2008;22:1276–312. - PMC - PubMed
    1. Ansel JC, Tiesman JP, Olerud JE, Krueger JG, Krane JF, Tara DC, Shipley GD, Gilbertson D, Usui ML, Hart CE. Human keratinocytes are a major source of cutaneous platelet-derived growth factor. J Clin Invest 1993;92:671–8. - PMC - PubMed
    1. Antoniades HN, Galanopoulos T, Neville-Golden J, Kiritsy CP, Lynch SE. Injury induces in vivo expression of platelet-derived growth factor (PDGF) and PDGF receptor mRNAs in skin epithelial cells and PDGF mRNA in connective tissue fibroblasts. Proc Natl Acad Sci USA 1991;88:565–9. - PMC - PubMed

Publication types

MeSH terms

Substances