. 2019:22:101796.
doi: 10.1016/j.nicl.2019.101796. Epub 2019 Mar 27.

Evaluating the evidence for biotypes of depression: Methodological replication and extension of

Affiliations

Evaluating the evidence for biotypes of depression: Methodological replication and extension of

Richard Dinga et al. Neuroimage Clin. 2019.

Abstract

Background: Psychiatric disorders are highly heterogeneous, defined based on symptoms with little connection to potential underlying biological mechanisms. A possible approach to dissect biological heterogeneity is to look for biologically meaningful subtypes. A recent study Drysdale et al. (2017) showed promising results along this line by simultaneously using resting state fMRI and clinical data and identified four distinct subtypes of depression with different clinical profiles and abnormal resting state fMRI connectivity. These subtypes were predictive of treatment response to transcranial magnetic stimulation therapy.

Objective: Here, we attempted to replicate the procedure followed in the Drysdale et al. study and their findings in a different clinical population and a more heterogeneous sample of 187 participants with depression and anxiety. We aimed to answer the following questions: 1) Using the same procedure, can we find a statistically significant and reliable relationship between brain connectivity and clinical symptoms? 2) Is the observed relationship similar to the one found in the original study? 3) Can we identify distinct and reliable subtypes? 4) Do they have similar clinical profiles as the subtypes identified in the original study?

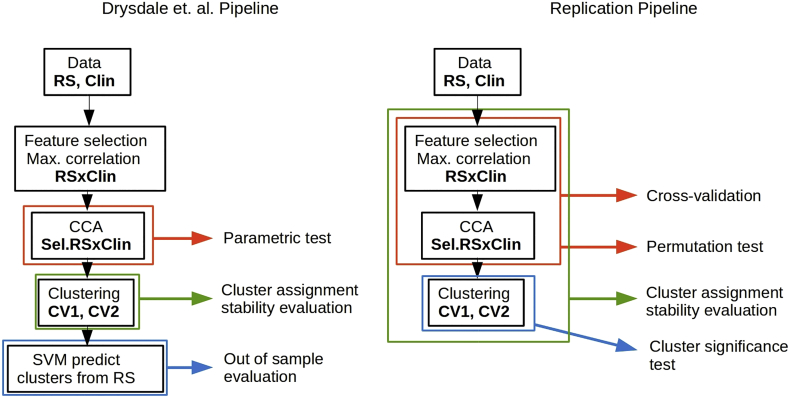
Methods: We followed the original procedure as closely as possible, including a canonical correlation analysis to find a low dimensional representation of clinically relevant resting state fMRI features, followed by hierarchical clustering to identify subtypes. We extended the original procedure using additional statistical tests, to test the statistical significance of the relationship between resting state fMRI and clinical data, and the existence of distinct subtypes. Furthermore, we examined the stability of the whole procedure using resampling.

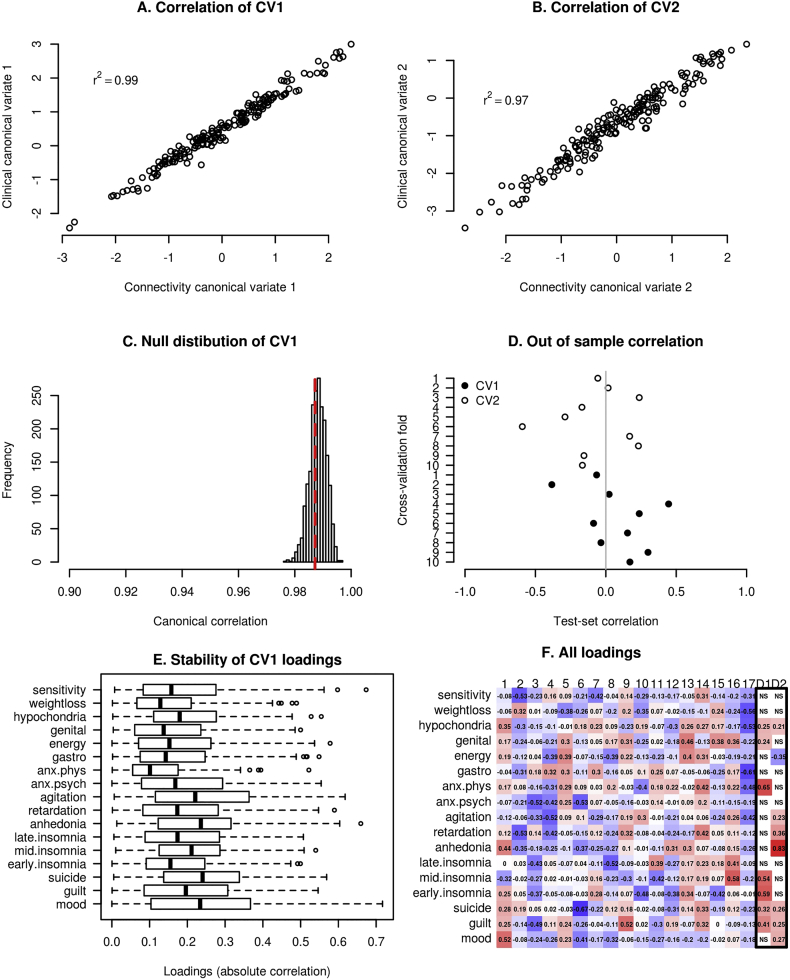
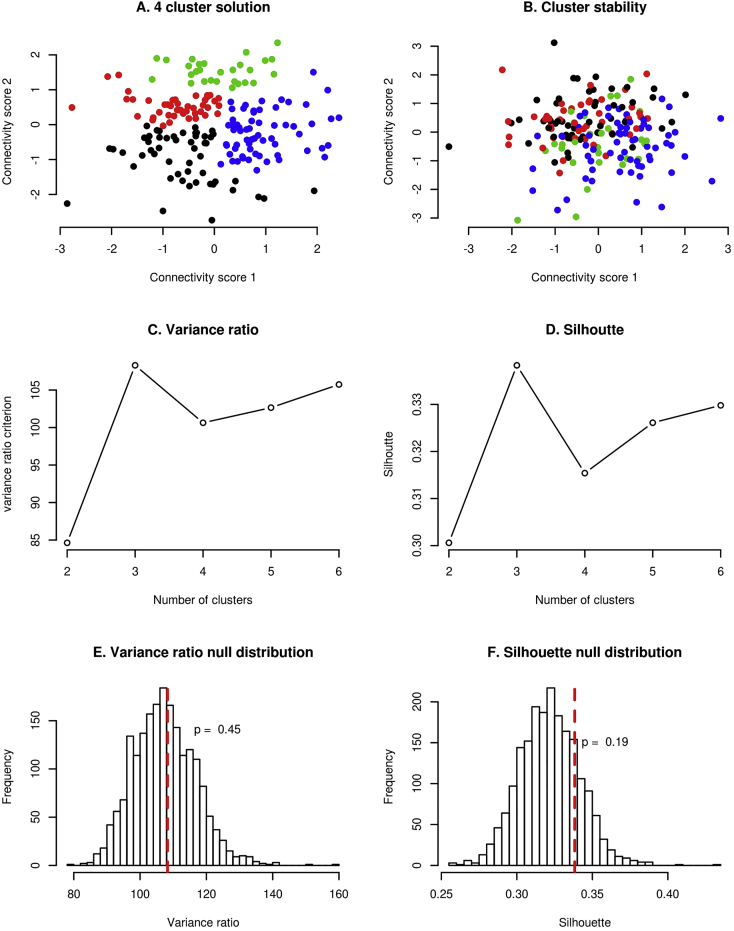
Results and conclusion: As in the original study, we found extremely high canonical correlations between functional connectivity and clinical symptoms, and an optimal three-cluster solution. However, neither canonical correlations nor clusters were statistically significant. On the basis of our extensive evaluations of the analysis methodology used and within the limits of comparison of our sample relative to the sample used in Drysdale et al., we argue that the evidence for the existence of the distinct resting state connectivity-based subtypes of depression should be interpreted with caution.

Keywords: Anxiety; Clustering; Machine learning; Major depressive disorder; Replication.


Figures

Fig. 1
Fig. 1
A scheme of the pipeline used in the original study and our pipeline. Data: in the original study, 220 depressed subjects have been analyzed as a part of a “cluster discovery” set and an additional 92 subjects were used as evaluation set. The clinical data (Clin) consisted of 17 HAM-D items. We have used 187 subjects with depression, anxiety disorder or depression-anxiety comorbidity. The clinical data consisted of 17 IDS items that best-matched the HAM-D item used in the original study. After preprocessing of fMRI data (RS), a correlation matrix between selected regions was created, resulting in ~35,000 features. A small subset of features (178 in the original study and 150 in our study) were selected based on their correlation with clinical symptoms (Sel.RS). Then, CCA was performed using these selected features and clinical symptoms. In the original study, a parametric test was used to the established statistical significance of CCA without taking a previous feature selection into an account. Hierarchical clustering was performed on first two resting state connectivity canonical variates (CV1, CV2). We have included an additional test, to test if the data cluster more than what is expected from data sampled from a Gaussian distribution. Stability of cluster assignment was evaluated in the original study by resampling of CV1 and CV2, We have extended the resampling stability evaluation to feature selection (in addition to the CCA procedures). Out of sample evaluation: in the original study, an additional 92 subjects were assigned to clusters according to a SVM model and clinical profiles of these clusters were compared to clinical profiles of clusters obtained in the cluster discovery set. We have evaluated the reproducibility of canonical correlations directly, using 10-fold cross-validation.
Fig. 2
Fig. 2
A, B) CCA finds a linear combination (canonical variate) of brain connectivity features that maximizes correlation with a linear combination of clinical symptoms. Canonical correlations are high and comparable to the original study (0.95 and 0.91). C) The null distribution of the first canonical correlation obtained using permutation test. Although canonical correlations in A and B are seemingly high, they are also high under the null hypothesis and thus not statistically significant. D) Out of sample canonical correlation for first two canonical pairs estimated by 10 fold cross-validation. Each point represents out of sample canonical correlation for each cross-validation fold. Although the canonical correlation was high in the training set as showed in A and B, id dropped to a chance level correlation in the test sets. E) Canonical loadings for the first canonical variate and their stability under resampling of the data using leave-one-out (jack-knife) procedure. F) Clinical canonical loadings for all canonical variates (1–17) and first two reported in the original study (D1-D2).
Fig. 3
Fig. 3
A) obtained 4-cluster solution using hierarchical clustering. B) Stability of the cluster assignment. Each subject is shown with the same color as it had in A, but the connectivity scores are recomputed under a small perturbation of the data i.e. leaving one subject out of the feature selection and CCA procedure. C) Variance ratio criterion is maximized at 3 clusters (4 in the original study). D) Silhouette index is maximized at 3 clusters. E, F) Null distribution of Variance ratio and silhouette indices. Showing that although these indices are maximized at 3 clusters, these results are not unusual even for the data simulated from a distribution with no clusters. Therefore these criteria do not imply evidence for the existence of clusters in our data or in the data presented in the original study.

References

    1. Beck A.T., Epstein N., Brown G., Steer R.A. An inventory for measuring clinical anxiety: psychometric properties. J. Consult. Clin. Psychol. 1988;56:893–897. - PubMed
    1. Chekroud A.M., Gueorguieva R., Krumholz H.M., Trivedi M.H., Krystal J.H., McCarthy G. Reevaluating the efficacy and predictability of antidepressant treatments. JAMA Psychiatry. 2017;74:370. - PMC - PubMed
    1. Cheng C., Dong D., Jiang Y., Ming Q., Zhong X., Sun X. State-related alterations of spontaneous neural activity in current and remitted depression revealed by resting-state fMRI. Front. Psychol. 2019;10 - PMC - PubMed
    1. Cusin C., Yang H., Yeung A., Fava M. Rating scales for depression. Handb. Clin. Rat. Scales Assess. Psychiatry Ment. Heal. 2009:7–35. Totowa, NJ: Humana press.
    1. Dong D., Li C., Ming Q., Zhong X., Zhang X., Sun X. Topologically state-independent and dependent functional connectivity patterns in current and remitted depression. J. Affect. Disord. 2019;250:178–185. - PubMed

Publication types