. 2019 May 21;87(6):e00911-18.
doi: 10.1128/IAI.00911-18. Print 2019 Jun.

Combining Monophosphoryl Lipid A (MPL), CpG Oligodeoxynucleotide (ODN), and QS-21 Adjuvants Induces Strong and Persistent Functional Antibodies and T Cell Responses against Cell-Traversal Protein for Ookinetes and Sporozoites (CelTOS) of Plasmodium falciparum in BALB/c Mice

Affiliations

Combining Monophosphoryl Lipid A (MPL), CpG Oligodeoxynucleotide (ODN), and QS-21 Adjuvants Induces Strong and Persistent Functional Antibodies and T Cell Responses against Cell-Traversal Protein for Ookinetes and Sporozoites (CelTOS) of Plasmodium falciparum in BALB/c Mice

Sakineh Pirahmadi et al. Infect Immun. .

Abstract

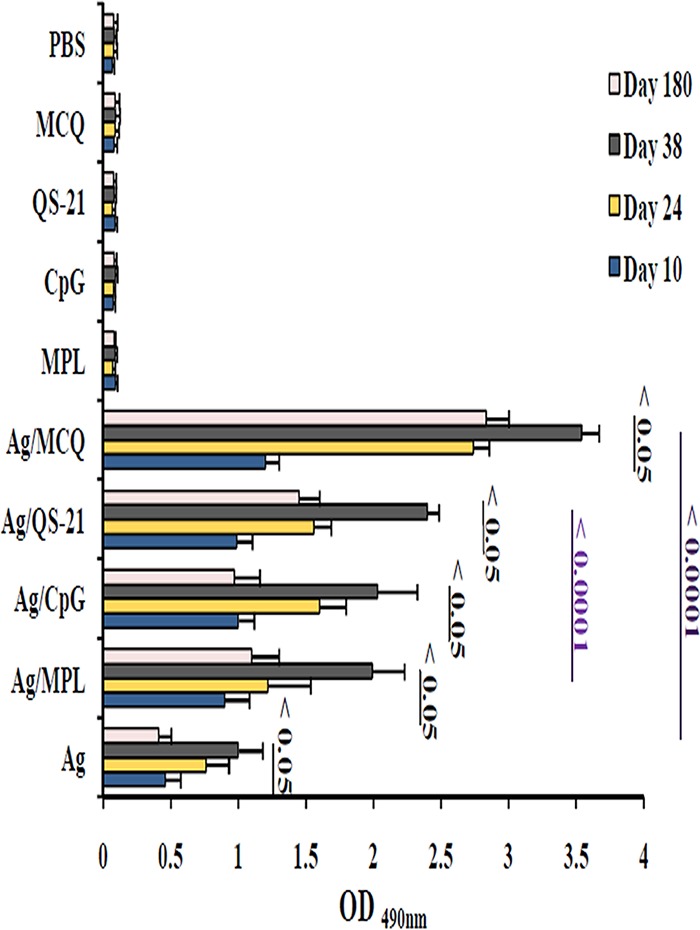
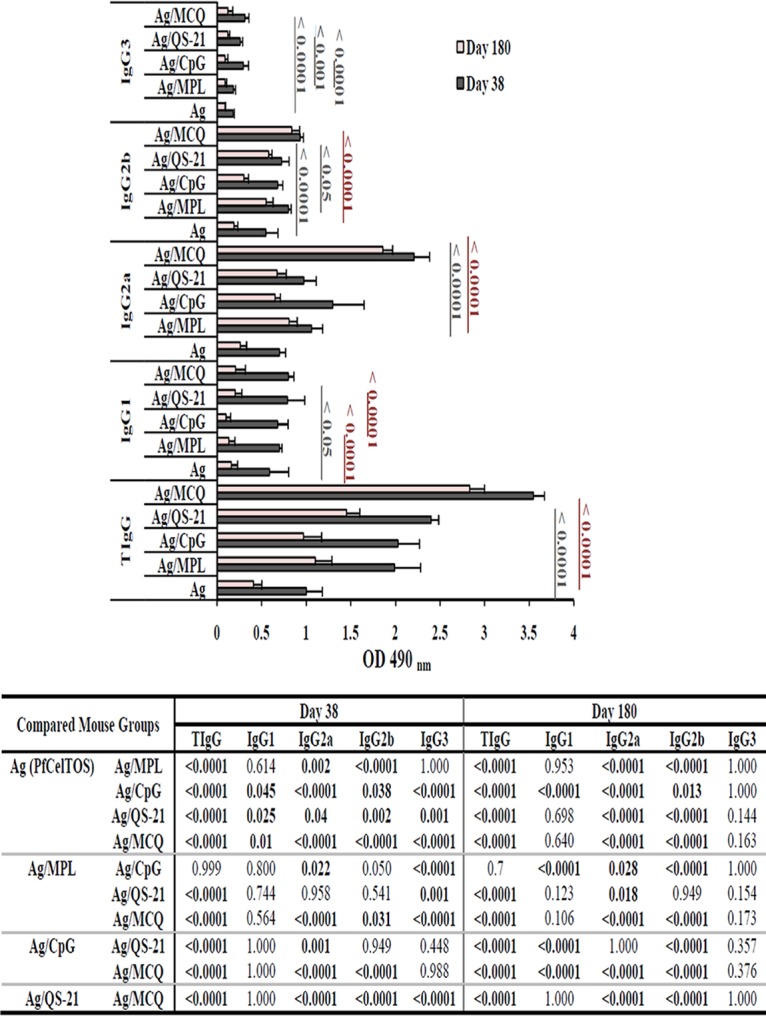
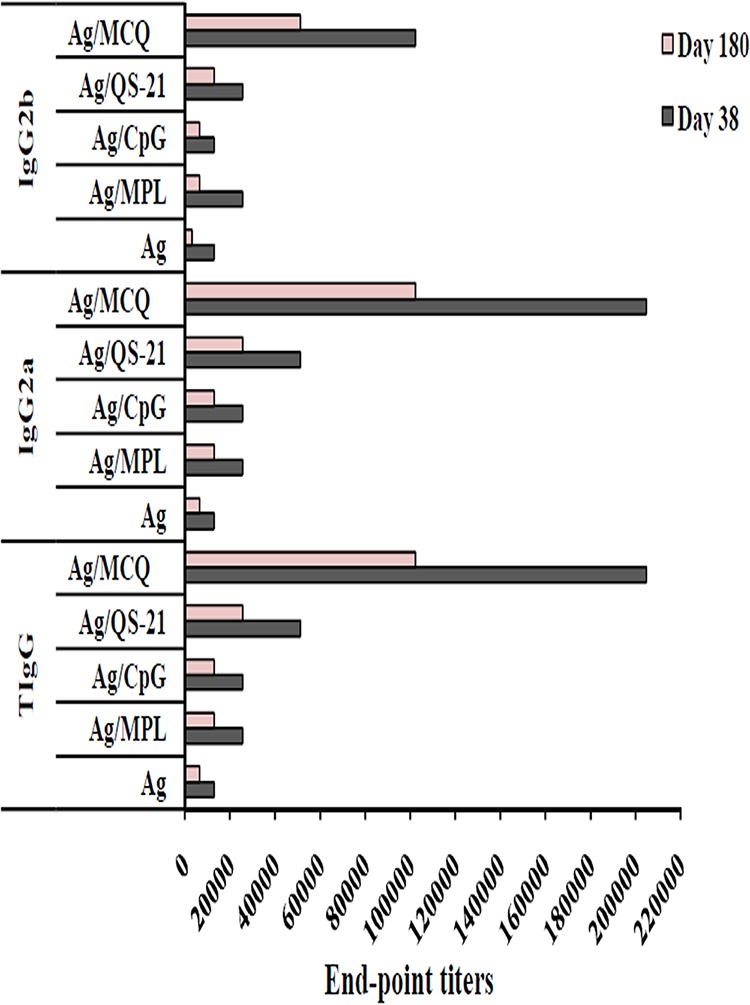
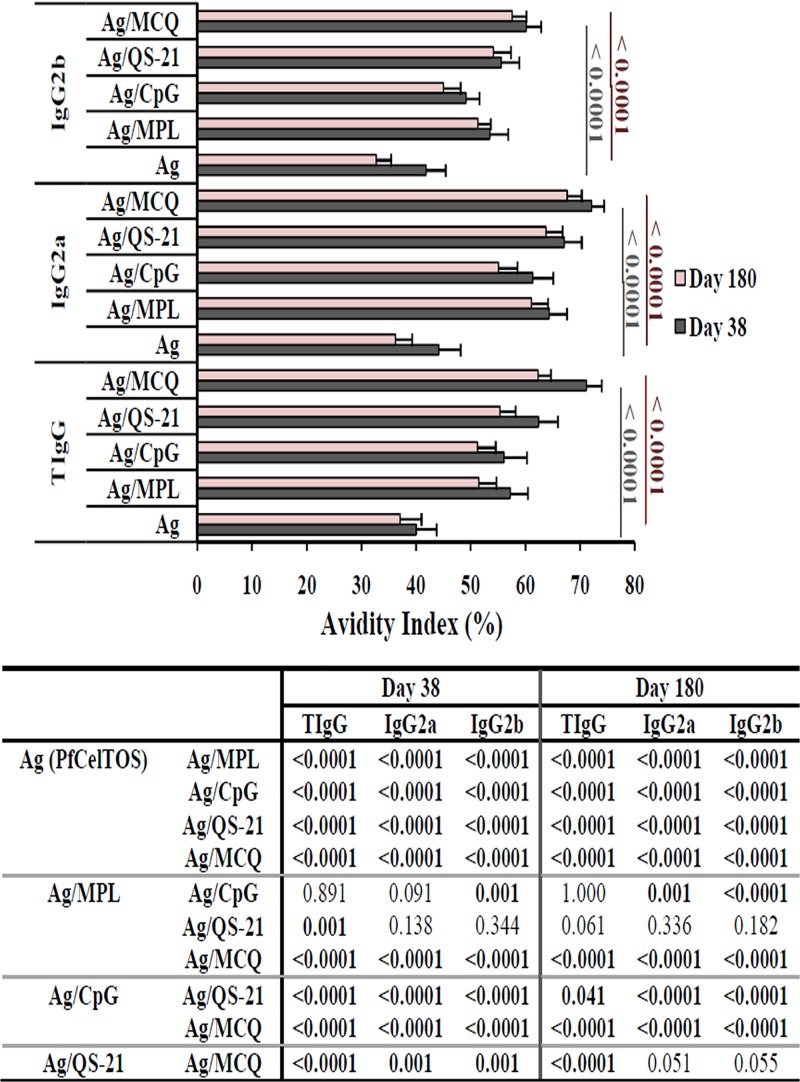
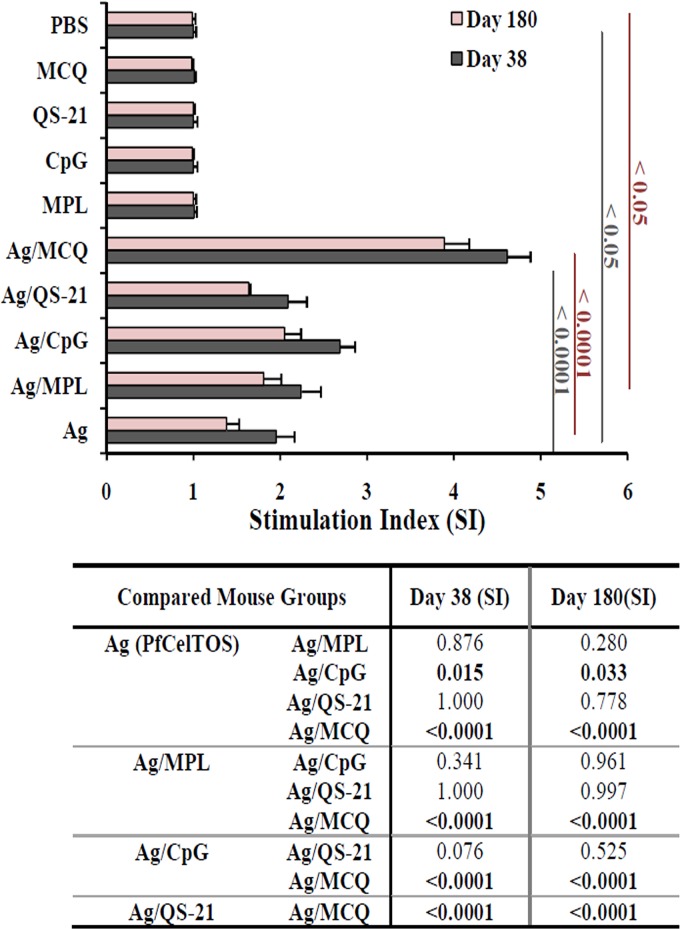
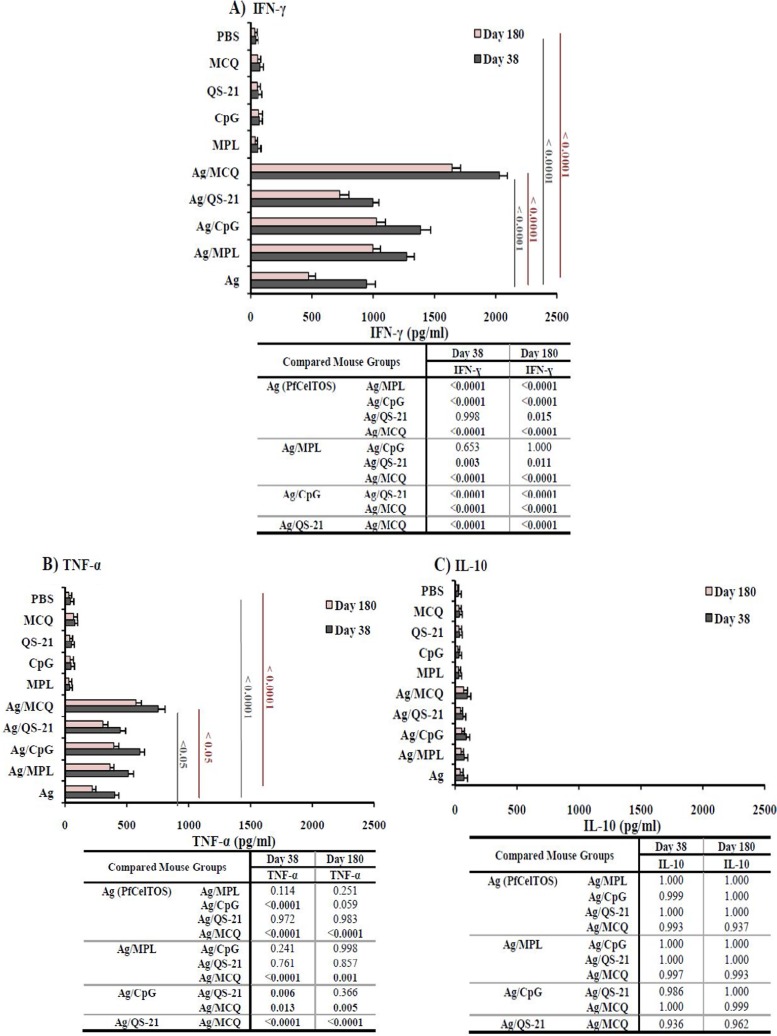
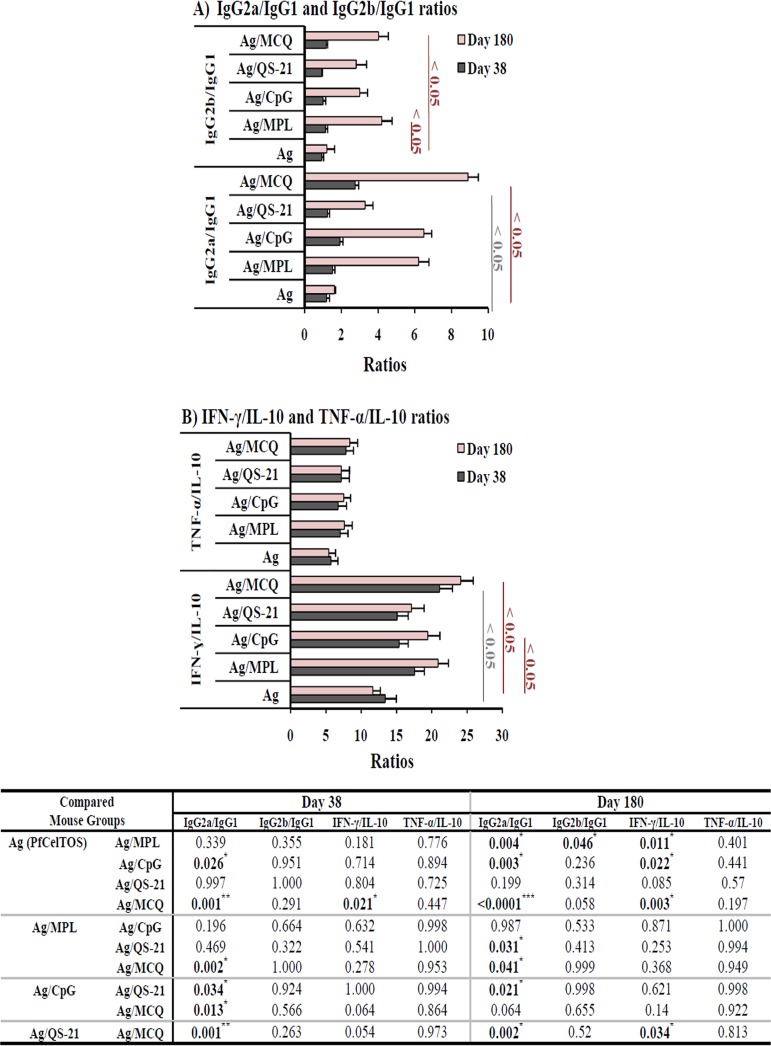
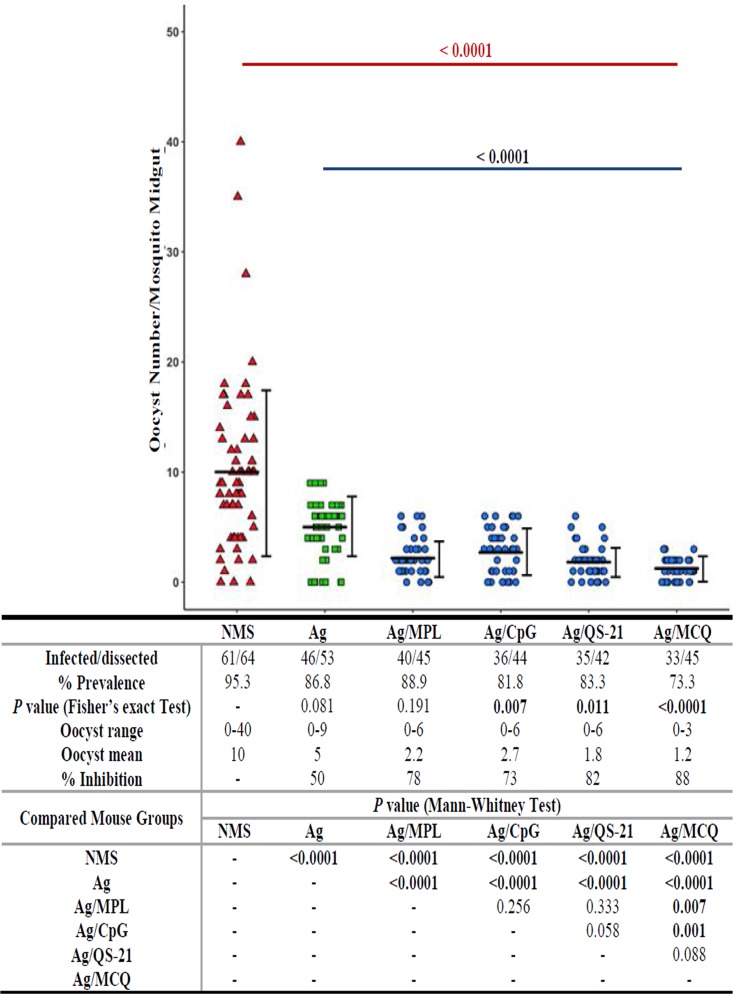
Plasmodium falciparum cell-traversal protein for ookinetes and sporozoites (PfCelTOS) is an advanced vaccine candidate that has a crucial role in the traversal of the malaria parasite in both mosquito and mammalian hosts. As recombinant purified proteins are normally poor immunogens, they require to be admixed with an adjuvant(s); therefore, the objective of the present study was to evaluate the capacity of different vaccine adjuvants, monophosphoryl lipid A (MPL), CpG, and Quillaja saponaria Molina fraction 21 (QS-21), alone or in combination (MCQ [MPL/CpG/QS-21]), to enhance the immunogenicity of Escherichia coli-expressed PfCelTOS in BALB/c mice. This goal was achieved by the assessment of anti-PfCelTOS IgG antibodies (level, titer, IgG isotype profile, avidity, and persistence) and extracellular Th1 cytokines using an enzyme-linked immunosorbent assay (ELISA) on postimmunized BALB/c mouse sera and PfCelTOS-stimulated splenocytes, respectively. Also, an assessment of the transmission-reducing activity (TRA) of anti-PfCelTOS obtained from different vaccine groups was carried out in female Anopheles stephensi mosquitoes by using a standard membrane feeding assay (SMFA). In comparison to PfCelTOS alone, administration of PfCelTOS with three distinct potent Th1 adjuvants in vaccine mouse groups showed enhancement and improvement of PfCelTOS immunogenicity that generated more bias toward a Th1 response with significantly enhanced titers and avidity of the anti-PfCelTOS responses that could impair ookinete development in A. stephensi However, immunization of mice with PfCelTOS with MCQ mixture adjuvants resulted in the highest levels of induction of antibody titers, avidity, and inhibitory antibodies in oocyst development (88%/26.7% reductions in intensity/prevalence) in A. stephensi It could be suggested that adjuvant combinations with different mechanisms stimulate better functional antibody responses than adjuvants individually against challenging diseases such as malaria.

Keywords: CpG; MPL; PfCelTOS; Plasmodium falciparum; QS-21; adjuvants; malaria; vaccine.


Figures

FIG 1
FIG 1
Anti-PfCelTOS IgG antibody levels in vaccine mouse sera at different time points by an ELISA. Groups of 6- to 8-week-old female BALB/c mice were immunized subcutaneously with recombinant PfCelTOS alone or formulated with different adjuvants (MPL, CpG, QS-21, and MCQ [MPL/CpG/QS-21]). Anti-PfCelTOS IgG antibody levels were compared between the sera collected from different immunized mouse groups on day 10, day 24 (10 days after the first boost), and day 38 (10 days after the second boost) after the first immunization. The individual mouse serum samples were incubated in duplicate wells with 1:200-diluted sera for 90 min. There was a significant difference in total IgG antibody levels between different immunization time points in vaccine groups (P < 0.05 by a paired-sample t test). The bars and error bars show the mean OD490 values and standard deviations (SD) for 16 individual mice in each group, respectively. The ELISA cutoffs were calculated as the mean OD490 of preimmune mouse sera (as the negative controls; n = 30) plus 3 SD. The cutoffs for IgG on days 10, 24, 38, and 180 after the first immunization were an OD490 of 0.1 each. Ag, PfCelTOS antigen.
FIG 2
FIG 2
Assessment of anti-PfCelTOS IgG subclass profiles and longevity. Preimmune sera (n = 30) were used as negative controls to determine the ELISA cutoffs, which were calculated as the mean OD490 plus 3 SD. The cutoffs for total IgG (TIgG), IgG1, IgG2a, IgG2b, and IgG3 were OD490 values of 0.101, 0.064, 0.072, 0.093, and 0.091, respectively, on day 38 and 0.1, 0.083, 0.089, 0.108, and 0.068, respectively, on day 180 after the first immunization. The bars and error bars show the mean OD490 values and standard deviations (SD) for 16 individual mice (day 38) and 10 individual mice (day 180) in each group, respectively. The highest levels of total IgG, IgG2a, and IgG2b were detected in group 5, which received PfCelTOS in combination with MCQ (MPL/CpG/QS-21) adjuvants on days 38 and 180 after the first immunization (P < 0.05 by one-way ANOVA). The table shows multiple comparisons of means for anti-PfCelTOS IgG and its subclasses among the nonadjuvanted (group 1) and adjuvanted (groups 2 to 5) vaccine groups on days 38 and 180 after the first immunization, which were performed by using Tukey’s HSD post hoc test.
FIG 3
FIG 3
Evaluation of endpoint titers of anti-PfCelTOS total IgG, IgG2a, and IgG2b antibodies. For titration, 1:200 to 1:409,600 dilutions of mouse sera from different vaccine groups (groups 1 to 5) were analyzed using an ELISA. The bars show the last dilution of test sera in which OD490 values were above that of cutoff. Among all the vaccine groups (groups 1 to 5), the highest endpoint titers of anti-PfCelTOS total IgG, IgG2a, and IgG2b were detected in mouse group 5 receiving PfCelTOS/MCQ (MPL/CpG/QS-21) on days 38 and 180 after the first immunization. The cutoffs for total IgG, IgG2a, and IgG2b were OD490 values of 0.1, 0.072, and 0.093, respectively, on day 38 and 0.1, 0.089, and 0.108, respectively, on day 180.
FIG 4
FIG 4
Avidity analyses of anti-PfCelTOS IgG, IgG2a, and IgG2b antibodies by an ELISA. The avidity index (AI) was calculated as the portion of the OD value of urea-treated serum samples compared to that of untreated samples multiplied by 100. AI values of <30%, 30 to 50%, and >50% correspond to low, intermediate, and high avidity, respectively. The bars and error bars show the mean AIs and SD for 16 individual mice (day 38) and 10 individual mice (day 180) in each group, respectively. The comparisons between the groups for AIs were analyzed by one-way ANOVA, followed by Tukey’s HSD post hoc test, and a P value of <0.05 was considered statistically significant, as shown in the table. The highest AI of anti-PfCelTOS total IgG, IgG2a, and IgG2b antibodies was observed in vaccine group 5 (PfCelTOS/MCQ [MPL/CpG/QS-21]) on days 38 and 180 after the first immunization.
FIG 5
FIG 5
Proliferation of lymphocytes in cultured splenocyte cells of immunized mice (groups 1 to 10) in the presence of PfCelTOS antigen in vitro. On days 38 and 180 after the first immunization, spleens from each mouse group (4 mice from each vaccine and control group) were removed, and lymphocyte proliferation was evaluated using the MTT assay. On day 180 after the primary immunization, lymphocyte proliferation was significantly reduced in all the mouse vaccine groups (P < 0.05 by a paired-sample t test). Data were analyzed using one-way ANOVA, followed by Tukey’s HSD post hoc test. MCQ, MPL/CpG/QS-21.
FIG 6
FIG 6
Assessment of IFN-γ, TNF-α, and IL-10 production in vaccine groups (groups 1 to 5) and control groups (groups 6 to 10) on days 38 and 180 after the first immunization by an ELISA. (A) For immunized mice receiving PfCelTOS with different adjuvants alone or in combination, the mean IFN-γ responses in the presence of ConA (as the positive control) and no antigen (as the negative control) were in the range of 1,821 to 2,101 and 21 to 35 pg/ml, respectively. (B) Among different vaccine groups, the mean TNF-α responses in the presence of ConA (as the positive control) and no antigen (as the negative control) were in the range of 964 to 1,150 and 20 to 38 pg/ml, respectively. (C) IL-10 responses in the presence of ConA (as the positive control) and no antigen (as the negative control) were in the range of 152 to 459 and 19 to 35 pg/ml, respectively. On day 180 after primary immunization, the levels of all cytokines were significantly reduced in all the vaccine mouse groups (P < 0.05 by a paired-sample t test). The table shows multiple comparisons of IFN-γ, TNF-α, and IL-10 among the nonadjuvanted (group 1) and adjuvanted (groups 2 to 5) vaccine groups on days 38 and 180 after the first immunization, which was performed by using Tukey’s HSD post hoc test. MCQ, MPL/CpG/QS-21.
FIG 7
FIG 7
Evaluation of Th1/Th2 ratios. Th1 (anti-PfCelTOS IgG2a and IgG2b antibodies and cytokines IFN-γ and TNF-α) and Th2 (anti-PfCelTOS IgG1 and the cytokine IL-10) responses were analyzed in different vaccine groups on days 38 and 180 after the first immunization. (A) For immunized mice receiving PfCelTOS alone or with different adjuvants (groups 1 to 5), an increase in the IgG2a/IgG1 ratio was observed in mouse group 5, which received PfCelTOS in combination with MCQ (MPL/CpG/QS-21), on day 38 (ratio, 2.76; P < 0.05 by one-way ANOVA) and day 180 (8.9). (B) In mouse group 5, which received the antigen with MCQ adjuvants, the IFN-γ/IL-10 ratios (day 38 ratio, 21.1; day 180 ratio, 24.12) were significantly higher than those in mouse group 1, which received the antigen alone (P < 0.05 by one-way ANOVA). The table shows multiple comparisons of IgG2a/IgG1, IgG2b/IgG1, IFN-γ/IL-10, and TNF-α/IL-10 (Th1/Th2) ratios among the nonadjuvanted (group 1) and adjuvanted (groups 2 to 5) vaccine groups on days 38 and 180 after the first immunization using Tukey’s HSD post hoc test.
FIG 8
FIG 8
Inhibition of P. falciparum NF54 parasite development by anti-PfCelTOS polyclonal antibodies in A. stephensi mosquitoes. Pooled mouse sera (n = 16) from different vaccine groups (groups 1 to 5) collected on day 38 after the first immunization were admixed with mature P. falciparum NF54 cultured gametocytes and fed to A. stephensi mosquitoes (n = 50/cup) in standard membrane feeding assays (SMFAs). Pooled normal mouse serum (NMS) (n = 30 randomly selected from 160 female BALB/c mice before immunization) was used as the negative control. On days 9 to 10 after feeding, the mosquitoes’ midguts were dissected, and oocyst counts, which revealed the successful development of P. falciparum in A. stephensi mosquitoes, were recorded. Two separate membrane feeds were done using serum from each vaccine group (groups 1 to 5), and oocyst counts were pooled for statistical analysis. The dots represent the numbers of oocysts in individual mosquitoes, and the horizontal and vertical lines indicate the arithmetic means and standard deviations (SD) of oocyst counts, respectively. The prevalence of infected mosquitoes in the vaccine groups (groups 1 to 5) and the control group (NMS), range of oocyst numbers, mean number of oocysts, percent inhibition relative to the NMS control group, and multiple comparisons of different vaccine groups and the NMS control group are indicated in the table. A two-tailed Mann-Whitney U test and Fisher’s exact test were used to estimate the differences in infection intensity and prevalence, respectively, using IBM SPSS 20.0 for Windows. MCQ, MPL/CpG/QS-21.

References

    1. World Health Organization. 2017. World malaria report 2017. World Health Organization, Geneva, Switzerland: https://apps.who.int/iris/bitstream/10665/259492/1/9789241565523-eng.pdf.
    1. World Health Organization. 2012. Global plan for insecticide resistance management in malaria vectors. World Health Organization, Geneva, Switzerland: https://www.who.int/malaria/publications/atoz/gpirm/en/.
    1. Dondorp AM, Yeung S, White L, Nguon C, Day NP, Socheat D, von Seidlein L. 2010. Artemisinin resistance: current status and scenarios for containment. Nat Rev Microbiol 8:272–280. doi:10.1038/nrmicro2331. - DOI - PubMed
    1. Greenwood BM. 2008. Control to elimination: implications for malaria research. Trends Parasitol 24:449–454. doi:10.1016/j.pt.2008.07.002. - DOI - PubMed
    1. malERA Consultative Group on Vaccines. 2011. A research agenda for malaria eradication: vaccines. PLoS Med 8:e1000398. doi:10.1371/journal.pmed.1000398. - DOI - PMC - PubMed

Publication types

MeSH terms