. 2019 Jun 5;39(23):4489-4510.
doi: 10.1523/JNEUROSCI.2881-18.2019. Epub 2019 Apr 1.

p75 Neurotrophin Receptor Activation Regulates the Timing of the Maturation of Cortical Parvalbumin Interneuron Connectivity and Promotes Juvenile-like Plasticity in Adult Visual Cortex

Affiliations

p75 Neurotrophin Receptor Activation Regulates the Timing of the Maturation of Cortical Parvalbumin Interneuron Connectivity and Promotes Juvenile-like Plasticity in Adult Visual Cortex

Elie Baho et al. J Neurosci. .

Abstract

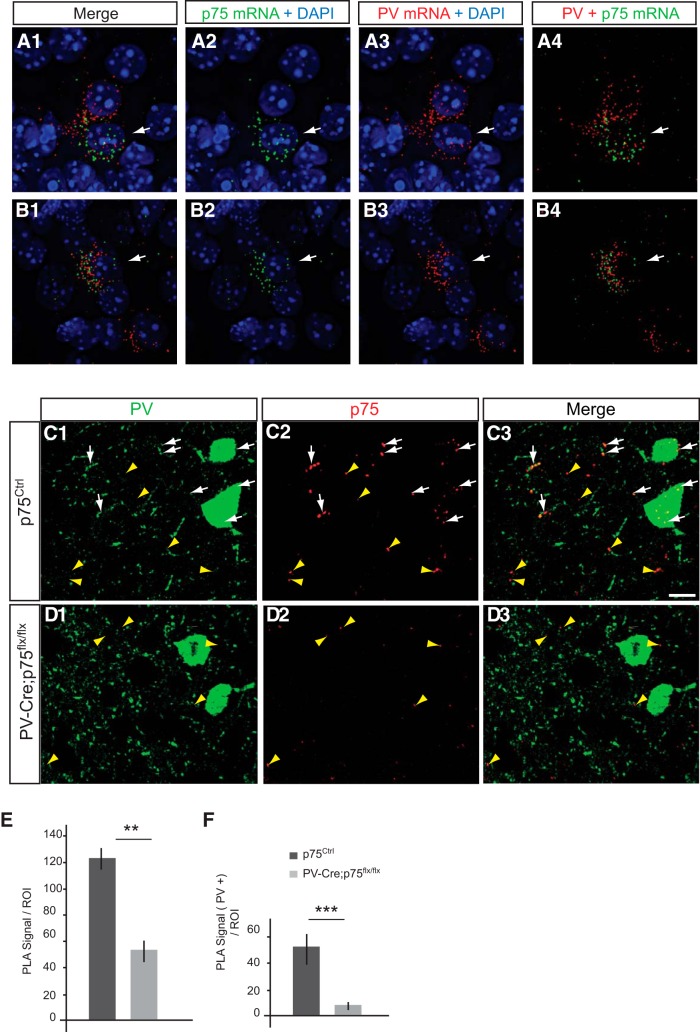
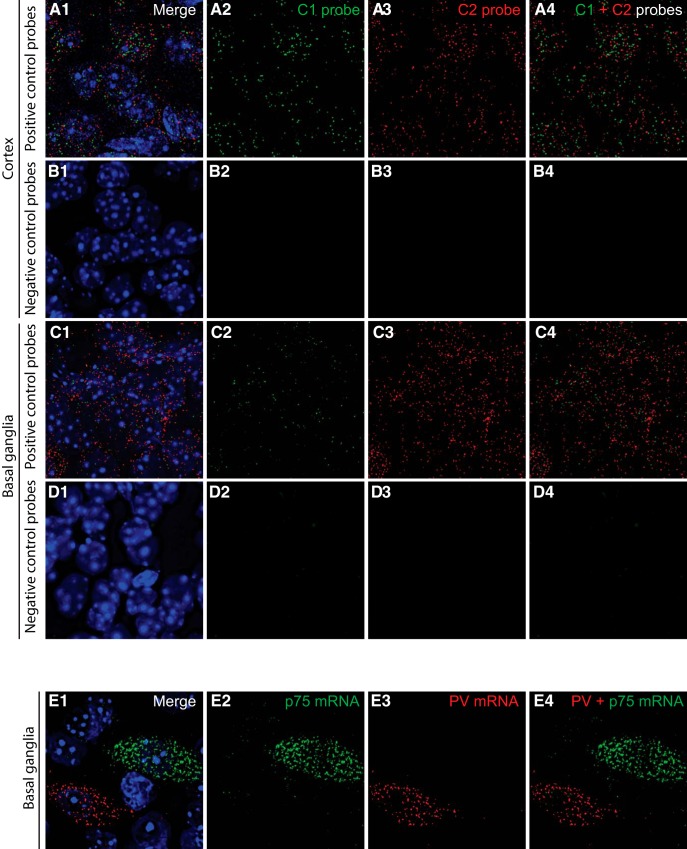
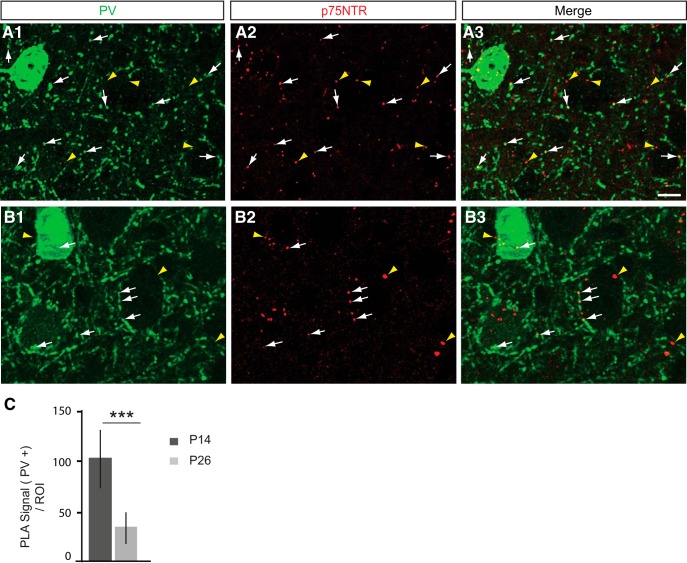
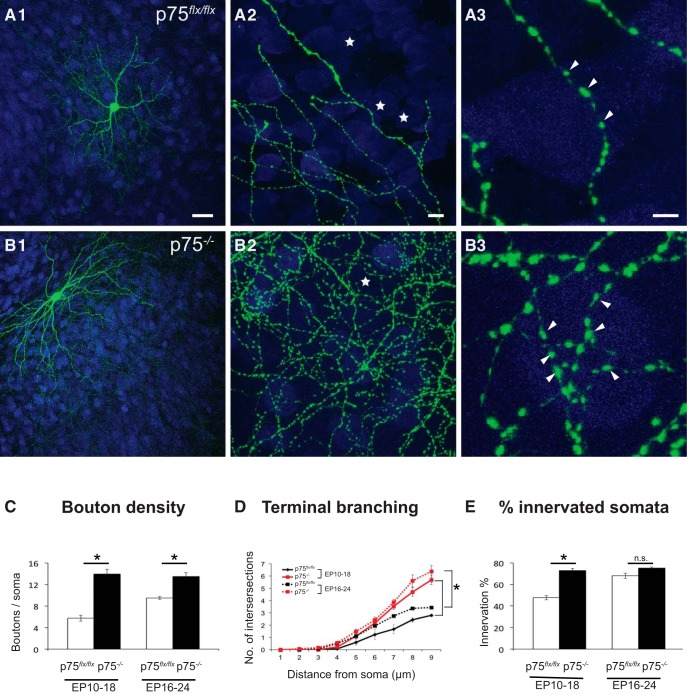
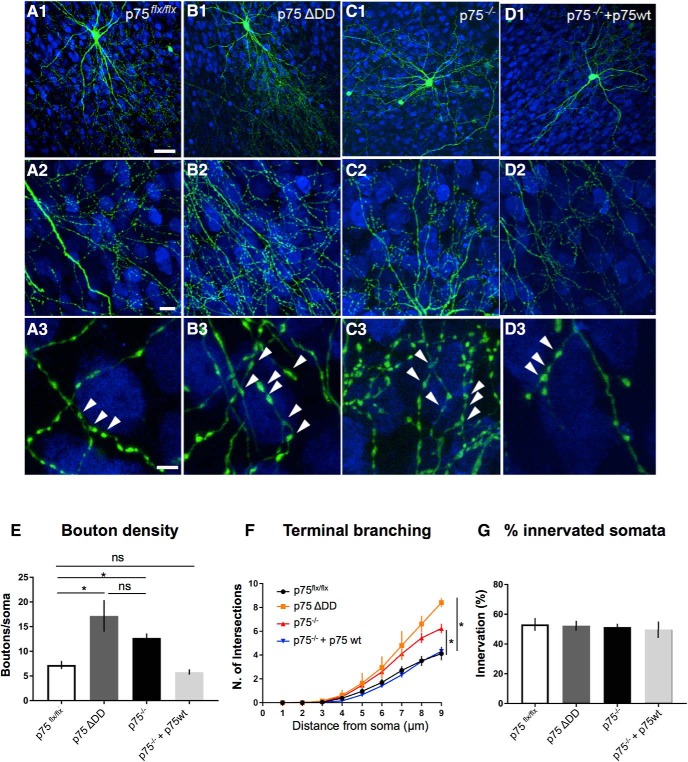
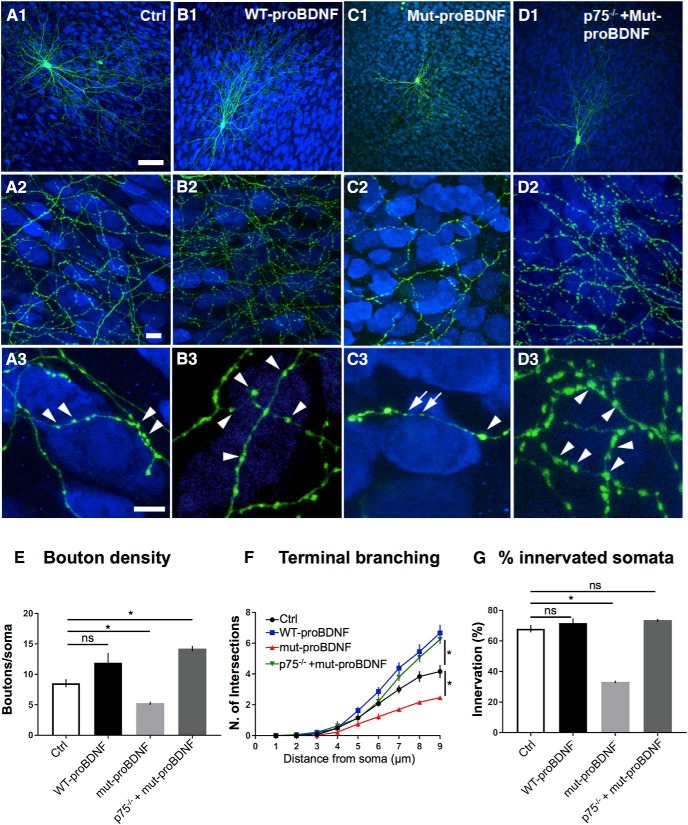
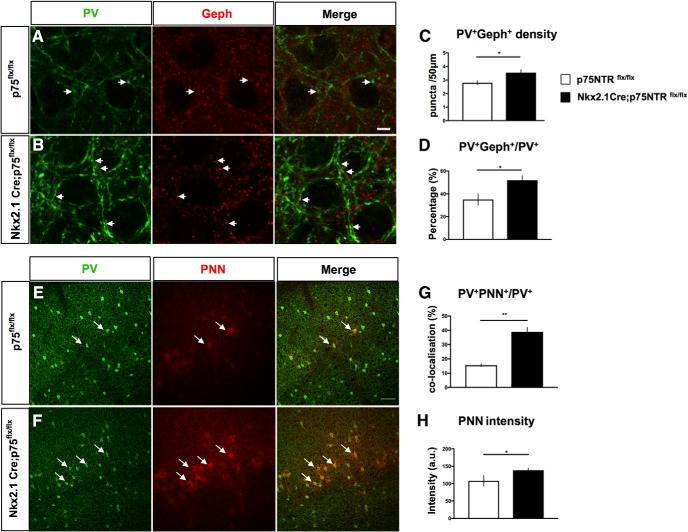
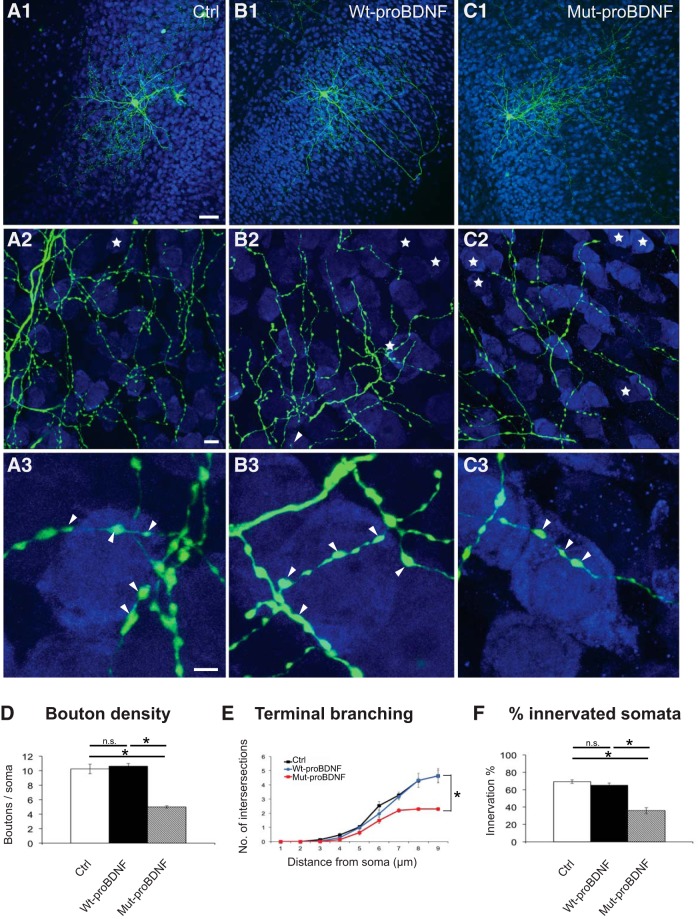
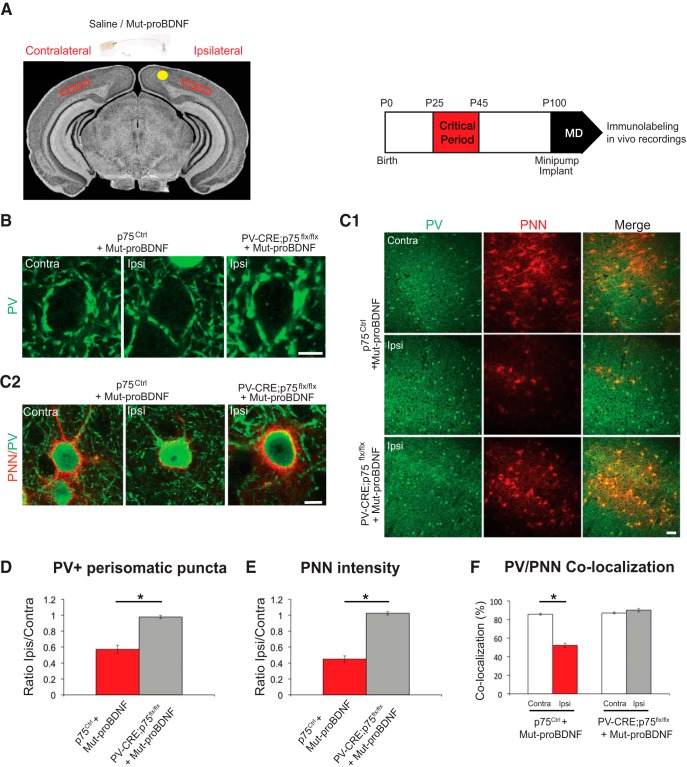
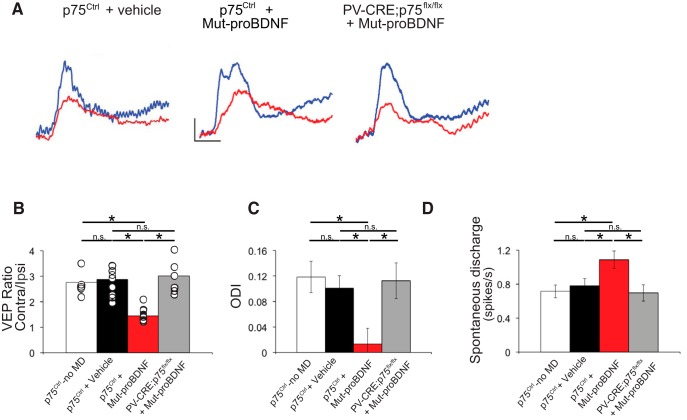
By virtue of their extensive axonal arborization and perisomatic synaptic targeting, cortical inhibitory parvalbumin (PV) cells strongly regulate principal cell output and plasticity and modulate experience-dependent refinement of cortical circuits during development. An interesting aspect of PV cell connectivity is its prolonged maturation time course, which is completed only by end of adolescence. The p75 neurotrophin receptor (p75NTR) regulates numerous cellular functions; however, its role on cortical circuit development and plasticity remains elusive, mainly because localizing p75NTR expression with cellular and temporal resolution has been challenging. By using RNAscope and a modified version of the proximity ligation assay, we found that p75NTR expression in PV cells decreases between the second and fourth postnatal week, at a time when PV cell synapse numbers increase dramatically. Conditional knockout of p75NTR in single PV neurons in vitro and in PV cell networks in vivo causes precocious formation of PV cell perisomatic innervation and perineural nets around PV cell somata, therefore suggesting that p75NTR expression modulates the timing of maturation of PV cell connectivity in the adolescent cortex. Remarkably, we found that PV cells still express p75NTR in adult mouse cortex of both sexes and that its activation is sufficient to destabilize PV cell connectivity and to restore cortical plasticity following monocular deprivation in vivo Together, our results show that p75NTR activation dynamically regulates PV cell connectivity, and represent a novel tool to foster brain plasticity in adults.SIGNIFICANCE STATEMENT In the cortex, inhibitory, GABA-releasing neurons control the output and plasticity of excitatory neurons. Within this diverse group, parvalbumin-expressing (PV) cells form the larger inhibitory system. PV cell connectivity develops slowly, reaching maturity only at the end of adolescence; however, the mechanisms controlling the timing of its maturation are not well understood. We discovered that the expression of the neurotrophin receptor p75NTR in PV cells inhibits the maturation of their connectivity in a cell-autonomous fashion, both in vitro and in vivo, and that p75NTR activation in adult PV cells promotes their remodeling and restores cortical plasticity. These results reveal a new p75NTR function in the regulation of the time course of PV cell maturation and in limiting cortical plasticity.

Keywords: GABAergic perisomatic synapses; PV cells; critical period plasticity; ocular dominance plasticity; p75NTR; perineural nets.


Figures

Figure 1.
Figure 1.
A subset of PV cells express p75NTR mRNA and protein. A, B, Images from coronal brain section of P14 mouse hybridized with PV (Pvalb) and p75 (Ngfr) probes using fluorescent multiplex RNAscope technology. p75 mRNA (A2, B2; green dots) is detected in cells expressing PV mRNA (A3, B3; red dots). White arrows indicate p75 and PV signals around the same nucleus, identified by DAPI staining (blue). C, D, Cortical slices from p75NTRflx/flx (C) or PV_Cre;p75NTRflx/flx (D) P60 mice coimmunostained with PV (C1, D1; green) and p75NTR using PLA (C2, D2; red dots). White arrows indicate PLA signals that colocalize with PV signals (C1–C3, D1–D3). The p75NTR signal can be observed in PV cell boutons. Yellow arrowheads indicate PLA signals without PV colocalization (C1–C3, D1–D3). Scale bar, 10 μm. E, Quantification of PLA signal reveals a significant reduction of total PLA signals per ROI in PV_Cre;p75NTRflx/flx compared with WT littermates. t test, df = 8, t = 5.391, **p = 0.004. F, Further, PLA signals that colocalized with PV labeling decrease significantly in PV_Cre;p75NTRflx/flx compared with WT littermates. t test, df = 8, t = 8,728, ***p = 0.0006.
Figure 2.
Figure 2.
Controls for RNAscope probe specificity. A–D, Validation of the RNAscope Fluorescent Multiplex assay using positive and negative control probes, provided by the manufacturer. Coronal brain slices were hybridized with the RNAscope positive control probes (A, C) and negative control probes (B, D). Images were taken from the cortex (A, B) and the basal ganglia (C–E). E, In the basal ganglia, cells express exclusively either PV mRNA or p75 mRNA.
Figure 3.
Figure 3.
p75NTR expression in cortical PV cells decreases during the first postnatal month. A, B, Cortical slices from P14 (A) and P26 (B) WT mice immunostained with PV to label PV cells (A1, B1; green) and PLA-mediated labeling for p75NTR (A2, B2; red dots, henceforth indicated in figures as p75). White arrows indicate PLA signals that colocalize with PV signals (A1–A3, B1–B3). Yellow arrowheads indicate PLA signals without PV colocalization (A1–A3, B1–B3). At both ages, p75NTR signal can be found in both PV-positive cell somata and putative boutons. Scale bar, 10 μm. C, Quantification of p75NTR PLA intensity in PV cells at different postnatal ages shows a significant decline of p75NTR signal in PV cells and boutons between P14 and P26 (unpaired t test with Welch's correction, df = 22.44, t = 7.642, ***p < 0.0001). n = 4 animals for each age point.
Figure 4.
Figure 4.
Cre-mediated inactivation of p75NTR in single PV cells induces the formation of more complex innervations. A, Control PV cell transfected with Pg67-GFP in EP18 organotypic cultures from p75flx/flx mice shows immature perisomatic innervation with one terminal, axonal branching, and small boutons. B, PV cells transfected with PG67-Cre/GFP from EP10–EP18 (p75−/− PV cells) show exuberant perisomatic innervation characterized by multiple terminal axonal branches (B2) bearing numerous clustered boutons (B3; arrowheads) around neuronal somata (NeuN immunostaining, blue). Stars indicate NeuN-positive somata that are not innervated. A3, B3, From regions in A2 and B2. Scale bars: A1, B1, 50 μm; A2, B2, 5 μm; A3, B3, 3 μm. Perisomatic bouton density (C), terminal branching (D), and percentage of innervated cells (E) of p75flx/flx and p75−/− PV cells transfected at EP10–EP18 or EP16–EP24 (C) EP10–EP18: unpaired t test, df = 13, t = 8.835, p < 0.0001, EP16–EP24: Mann–Whitney test, p = 0.0022. D, EP10–EP18: Mann–Whitney test: at 5, 6 μm: p = 0.0037; at 7–9 μm: p = 0.0003; EP16–EP24: unpaired t test: at 6 μm: df = 10, t = 2.513, p = 0.0307; at 7 μm: df = 10, t = 4.908, p = 0.0006; at 8 μm: df = 10, t = 5.065, p = 0.0005; at 9 μm: df = 10, t = 6.063, p = 0.0001. E, EP10–EP18: unpaired t test, df = 13, t = 7.017, p < 0.0001; EP16–EP24: unpaired t test, df = 10, t = 1.642, p = 0.1315. EP10–EP18: n = 8 p75−/− PV cells, n = 7 p75flx/flx PV cells. EP16–EP24: n = 6 p75−/− PV cells, n = 6 p75flx/flx PV cells. * indicate p < 0.05.
Figure 5.
Figure 5.
p75NTRΔDD mimics, whereas p75NTRwt rescues, the innervation phenotype of p75NTR−/− PV cells. A, Control PV cell transfected with Pg67-GFP in EP24 organotypic cultures from p75flx/flx mice. B, PV cells transfected with PG67-GFP and a dominant negative mutant form of p75NTR, p75NTRΔDD, from EP16–EP24 (p75−/− p75ΔDD PV cells) shows more complex perisomatic innervation characterized by multiple terminal axonal branches (B2) bearing numerous clustered boutons (B3; arrowheads) around NeuN-positive somata (blue). C, PV cells transfected with PG67-Cre/GFP (p75−/− PV cells) resemble p75ΔDD PV cells. D, p75−/− PV cells transfected with p75NTR cDNA (p75−/− + p75wt PV cells) are indistinguishable from control PV cells. A3–D3, Regions in A2–D2. Scale bars: A1–D1, 50 μm; A2–D2, 10 μm; A3–D3, 5 μm. E, Perisomatic boutons density (one-way ANOVA, F(3,26) = 8.854, p = 0.0003). F, Terminal branching (one-way ANOVA, at 7 μm: F(3,26) = 4.529, p = 0.0110; at 8 μm: F(3,26) = 10.15, p = 0.0001; at 9 μm: F(3,26) = 16.05, p < 0.0001). G, Percentage of innervated cells (one-way ANOVA, F(3,26) = 1.303, p = 0.3101). PV cells: n = 9 p75flx/flx, n = 5 p75ΔDD, n = 9 p75−/− PV cells, n = 7 p75−/− + p75wt. * indicate p < 0.05.
Figure 6.
Figure 6.
mut-proBDNF-mediated activation of p75NTR in PV cells during their maturation phase impairs the development of their innervations. A, Control PV cell (A1, green represents Ctrl) at EP24 with exuberant innervation field characterized by extensive branching contacting the majority of potential targets, dense boutons along axons (A2), and terminal branches with prominent and clustered boutons (A3; arrowheads) around NeuN-positive somata (blue). B, PV cell treated with wt-proBDNF from EP16–EP24 shows overall similar axon size (B1) and perisomatic bouton density (B3; arrowheads); however, axonal branching appears slightly increased (B3). C, PV cell treated with mut-proBDNF shows a reduction both in percentage of innervated cells (C2) and perisomatic innervation (C3). Boutons appear more irregular with some large (arrowheads) and many smaller ones (arrows). D, p75NTR−/− PV cells treated with mut-proBDNF are undistinguishable from untreated p75NTR−/− PV cells (compared with Fig. 4B1–B3). Scale bars: A1–D1, 50 μm; A2–D2, 10 μm; A3–D3, 5 μm. E, Perisomatic boutons density (one-way ANOVA, F(3,31) = 11.89, p < 0.0001; p75flx/flx vs p75ΔDD PV cells, p = 0.0002; p75flx/flx vs p75−/− PV cells, p = 0.0141; p75flx/flx vs p75−/− + p75wt PV cells, p = 0.8533; p75ΔDD vs p75−/− PV cells, p = 0.1314). F, Terminal branching (one-way ANOVA, at 7 μm: F(3,31) = 15.27, p < 0.0001; at 8 μm: F(3,31) = 14.10, p < 0.0001; at 9 μm: F(3,31) = 21.08, p < 0.0001). Both WT PV cells treated with wt-proBDNF and p75NTR−/− cells treated with mut-proBDNF show significantly higher sholl intersection numbers than Ctrl PV cell at 8 and 9 μm (p < 0.05), whereas PV cells treated with mut-proBDNF show significantly reduced sholl intersection numbers than Ctrl PV cell at 7, 8, and 9 μm (p < 0.01). G, Percentage of innervated cells of the four experimental groups (one-way ANOVA, F(3,31) = 69.65, p < 0.0001). * indicate p < 0.05. n = 9 Ctrl PV cells, n = 11 wt-proBDNF-treated PV cells, n = 8 mut-proBDNF-treated PV cells, n = 7 mut-proBDNF-treated p75−/− PV cells.
Figure 7.
Figure 7.
Blocking or increasing tPA activity during early postnatal development reduces and increases mBDNF levels in organotypic cultures, respectively. A, Full Western blot of mBDNF expression in brain samples from adult wt, CaMKII;BDNFflox/flox, and BDNFflox/flox mice. Each lane represents a different mouse brain. The 14 kDa band, corresponding to mBDNF, is not detectable when Bdnf is deleted in pyramidal cells (CaMKII-Cre;BDNFlox/lox conditional KO mouse), thus confirming the specificity of the antibody we used for these experiments (1:200, Santa Cruz Biotechnology, N20:sc-546). B, C, Western blot analysis of mBDNF (14 kDa) of cortical organotypic cultures treated with either PPACK (B) or tPA (C) for 8 d, from EP10–EP18. Each lane represents a single sample, which is constituted by 6 organotypic cultures pooled together. PPACK treatment significantly decreases mBDNF levels (B), whereas tPA increases them (C). Unpaired t test, *p < 0.05 (B) n = 3 Ctrl and n = 3 PPACK-treated samples. C, n = 5 Ctrl and n = 4 tPA-treated samples. Samples are from different mice.
Figure 8.
Figure 8.
Modulation of tPA activity affects the formation of PV cell innervations during early postnatal development. A, Control EP18 PV cell (A1, green represents Ctrl). B, PV cell treated with the tPA inhibitor PPACK from EP10–EP18 shows simpler axonal arborization, contacting less potential targets (B2, blue represents NeuN-positive somata). C, PV cell treated with tPA in the same time window shows a very complex axonal arbor (C2) and an increase in both terminal branching and perisomatic boutons (C3, arrowheads) compared with control cells (A2, A3). D, PV cell treated simultaneously with tPA and mut-proBDNF shows axonal branching and perisomatic innervation more similar to those formed by PV cell treated with mut-proBDNF alone, suggesting that the effects of tPA application may be mediated by a decrease in endogenous proBDNF/mBDNF ratio. Stars indicate NeuN-positive somata that are not innervated. Scale bars: A1–D1, 50 μm; A2–D2, 10 μm; A3–D3, 5 μm. E, Perisomatic boutons density (one-way ANOVA, F(3,20) = 121.2, p < 0.0001). F, Terminal branching (one-way ANOVA, at 5 μm: F(3,20) = 5.692, p = 0.0055; at 6 μm: F(3,20) = 19.67, p < 0.0001; at 7 μm: F(3,20) = 34.58, p < 0.0001; at 8 μm: F(3,20) = 32.81, p < 0.0001; at 9 μm: F(3,20) = 62.47, p < 0.0001). G, Percentage of innervated cells (one-way ANOVA, F(3,20) = 61.99, p < 0.0001) of the four experimental groups. * indicate p < 0.05. N = 6 PV cells for all experimental groups.
Figure 9.
Figure 9.
Cortical PV cells form more perisomatic boutons and are precociously enwrapped by PNN in Nkx2.1_Cre;P75NTRflx/flx mice. A, B, Cortical slices from P14 p75NTRflx/flx (A) or Nkx2.1_Cre;p75NTRflx/flx (B) mice coimmunostained with PV (green) and gephyrin (Geph, red). Arrows indicate examples of perisomatic PV+Geph+ puncta. C, D, Perisomatic PV+Geph+ density (C) and percentage of PV+ puncta colabeled with gephyrin (D) are significantly increased in Nkx2.1_Cre;p75NTRflx/flx mice compared with control littermates. C, Unpaired t test, df = 8, t = 2.438, *p = 0.0407. D, Unpaired t test, df = 8, t = 2.404, *p = 0.0429. N = 4 p75NTRflx/flx and 6 Nkx2.1Cre;p75NTRflx/flx mice. E, F, Cortical slices from P18 p75NTRflx/flx (E) or Nkx2.1_Cre;p75NTRflx/flx (F) mice labeled with anti-PV antibody (green) and WFA, which stains perineuronal nets (PNN, red). Arrows indicate examples of PV+ somata enwrapped by PNN. G, H, The proportion of PV somata surrounded by PNN (G) and mean PNN intensity (H) are significantly increased in Nkx2.1_Cre;p75NTRflx/flx mice compared with control littermates. G, Unpaired t test, df = 4, t = 7.369, **p = 0.0018. H, Unpaired t test, df = 4, t = 3.157, *p = 0.0343. N = 3 mice for both genotypes.
Figure 10.
Figure 10.
mut-proBDNF destabilizes PV cell innervation, even after it has reached maturity. A, Control PV cell (A1, Ctrl, green) at EP32 with exuberant innervation field characterized by extensive branching contacting the majority of potential targets, dense boutons along axons (A2), and terminal branches with prominent and clustered boutons (A3; arrowheads) around NeuN-positive somata (blue). B, PV cell treated with wt-proBDNF from EP26-EP32 shows overall similar axon size (B1), percentage of potentially targeted neurons (B2), and perisomatic innervations (B3) as control, untreated PV cells. C, PV cell treated with mut-proBDNF from EP26-EP32 shows a drastic reduction both in percentage of innervated cells (C2) and perisomatic innervation (C3). Stars indicate NeuN-positive somata that are not innervated. Scale bars: A1–C1, 50 μm; A2–C2, 10 μm; A3–C3, 5 μm. D, Perisomatic bouton density (one-way ANOVA, F(2,18) = 93.34, p < 0.0001). E, Terminal branching (one-way ANOVA, at 5 μm: F(2,18) = 5.994, p = 0.0101; at 6 μm: F(2,18) = 4.790, p = 0.0215; at 7 μm: F(2,18) = 7.444, p = 0.0044; at 8 μm: F(2,18) = 14.77, p = 0.0002; at 9 μm: F(2,18) = 24.12, p < 0.0001) and (F) percentage of innervated cells of the three experimental groups (one-way ANOVA, F(2,18) = 44.29, p < 0.0001). * indicate p < 0.05. n = 9 Ctrl, n = 6 wt-proBDNF-treated PV cells, n = 6 mut-proBDNF-treated PV cells.
Figure 11.
Figure 11.
proBNDF-mediated p75NTR activation in cortical PV cells reduces their perisomatic boutons. A, Experimental approach. B, The intensity of perisomatic PV immunostaining (green) is reduced in the binocular visual cortex ipsilateral to the minipump-releasing mut-proBDNF (Ipsi) compared with the contralateral cortex (Contra) in the same animal. On the other hand, perisomatic PV intensity in the ipsilateral cortex of PV_Cre;p75flx/flx mice is similar to that observed in the contralateral, untreated cortex. C, Low (C1) and high (C2) magnification of PNN (red, WFA staining) enwrapping PV cells (green) shows a dramatic reduction in both PNN density and intensity in the visual cortex infused with mut-proBFNF. This effect is abolished in PV_Cre;p75flx/flx mice. Scale bars: C1, 100 μm; B, C2, 10 μm. D, Quantification of the mean intensity of perisomatic PV-positive puncta in ipsilateral compared with contralateral cortex. I/C ratio is obtained for each animal and then averaged between different animals. Mean I/C ratio is significantly reduced in Mut-proBDNF-infused p75Ctrl mice compared with Mut-proBDNF-infused PV_Cre;p75flx/flx mice (unpaired t test, df = 8, t = 6.077, p = 0.0003). E, The ratio of mean PNN intensity around PV cells in ipsilateral versus contralateral cortex is significantly lower in p75Ctrl than PV_Cre;p75flx/flx mice infused with mut-proBDNF (unpaired t test, df = 8, t = 15.33, p < 0.001). F, The percentage of PV cells colocalizing with PNN is significantly reduced in the cortex infused with mut-proBDNF (Ipsi) compared with the untreated cortex (Contra) in p75Ctrl (paired t test, df = 5, t = 15.33, p < 0.0001) but not PV_Cre;p75flx/flx (paired t test, df = 3, t = 1.521, p = 0.2255). * indicate p < 0.05. n = 6 p75Ctrl mice; n = 4 PV_Cre;p75flx/flx mice.
Figure 12.
Figure 12.
proBNDF-mediated p75NTR activation in cortical PV cells restores ocular dominance plasticity in adult visual cortex in vivo. A, Typical VEP responses to the stimulation of either contralateral (blue) or ipsilateral (red) eye to the cortex in which the recording is performed in p75NTRCtrl mice infused with either vehicle or mut-proBDNF, and PV_Cre;p75NTRflx/flx mice infused with mut-proBDNF. Calibration bars: 50 μV, 100 ms. B, C/I VEP ratio mean values. Three days of monocular deprivation do not affect the C/I VEP ratio in adult mice, although it leads to a significant decrease in the C/I VEP ratio in animals treated with mut-proBDNF. Mut-proBDNF effects are, however, abolished in PV_Cre;p75flx/flx mice (one-way ANOVA, F(2,18) = 8.903, p = 0.0021). p75NTRCtrl + vehicle: n = 9 mice; p75NTRCtrl + mut-proBDNF: n = 5 mice; PV_Cre;p75flx/flx +mut-proBDNF: n = 7 mice. C, ODI of p75NTRCtrl mice infused with vehicle solution and PV_Cre;p75flx/flx mice infused with mut-proBDNF are not significantly different from those of undeprived animals, whereas ODIs in p75Ctrl mice treated with mut-proBDNF are significantly shifted toward the open eye (one-way ANOVA, F(2,443) = 5.203, p = 0.0058). D, Mean spontaneous discharge is significantly increased only in p75Ctrl mice treated with mut-proBDNF (one-way ANOVA, F(2,443) = 4.580, p = 0.0107). p75NTRCtrl + vehicle: n = 9 mice, 174 cells; p75NTRCtrl + mut-proBDNF: n = 5 mice, 147 cells; PV_Cre;p75flx/flx +mut-proBDNF: n = 6 mice, 125 cells. Gray area represents the C/I VEP ratio (B) or the ODI range (C) (mean ± SEM) in adult nondeprived animals (n = 5 mice, 99 cells). * indicate p < 0.05.

References

    1. Anastasia A, Deinhardt K, Chao MV, Will NE, Irmady K, Lee FS, Hempstead BL, Bracken C (2013) Val66Met polymorphism of BDNF alters prodomain structure to induce neuronal growth cone retraction. Nat Commun 4:2490. 10.1038/ncomms3490 - DOI - PMC - PubMed
    1. Baho E, Di Cristo G (2012) Neural activity and neurotransmission regulate the maturation of the innervation field of cortical GABAergic interneurons in an age-dependent manner. J Neurosci 32:911–918. 10.1523/JNEUROSCI.4352-11.2012 - DOI - PMC - PubMed
    1. Bavelier D, Levi DM, Li RW, Dan Y, Hensch TK (2010) Removing brakes on adult brain plasticity: from molecular to behavioral interventions. J Neurosci 30:14964–14971. 10.1523/JNEUROSCI.4812-10.2010 - DOI - PMC - PubMed
    1. Beurdeley M, Spatazza J, Lee HH, Sugiyama S, Bernard C, Di Nardo AA, Hensch TK, Prochiantz A (2012) Otx2 binding to perineuronal nets persistently regulates plasticity in the mature visual cortex. J Neurosci 32:9429–9437. 10.1523/JNEUROSCI.0394-12.2012 - DOI - PMC - PubMed
    1. Bogenmann E, Thomas PS, Li Q, Kim J, Yang LT, Pierchala B, Kaartinen V (2011) Generation of mice with a conditional allele for the p75(NTR) neurotrophin receptor gene. Genesis 49:862–869. 10.1002/dvg.20747 - DOI - PMC - PubMed

Publication types

MeSH terms

Substances

Grants and funding