Clinical Trial
. 2019 May 15;202(10):2856-2872.
doi: 10.4049/jimmunol.1700950. Epub 2019 Apr 1.

The Activation State of CD4 T Cells Alters Cellular Peptidase Activities, HIV Antigen Processing, and MHC Class I Presentation in a Sequence-Dependent Manner

Affiliations
Clinical Trial

The Activation State of CD4 T Cells Alters Cellular Peptidase Activities, HIV Antigen Processing, and MHC Class I Presentation in a Sequence-Dependent Manner

Julie Boucau et al. J Immunol. .

Abstract

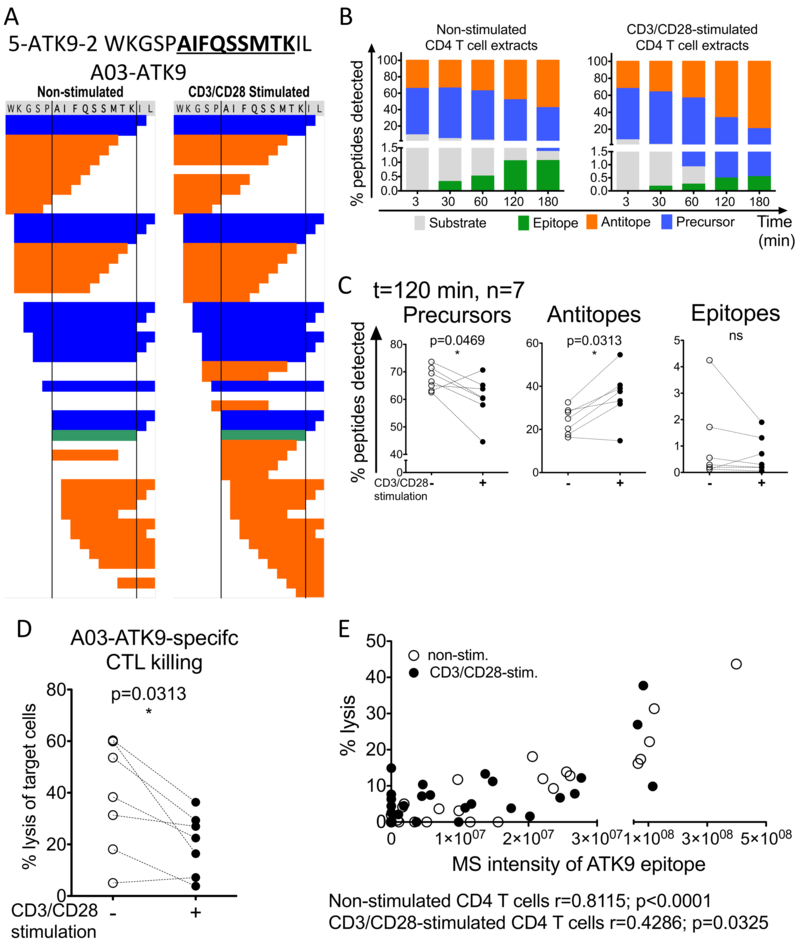
CD4 T cell activation is critical to the initiation of adaptive immunity. CD4 T cells are also the main targets of HIV infection, and their activation status contributes to the maintenance and outcome of infection. Although the role of activation in the differentiation and proliferation of CD4 T cells is well studied, its impact on the processing and MHC class I (MHC-I) presentation of epitopes and immune recognition by CD8 T cells are not investigated. In this study, we show that the expression and hydrolytic activities of cellular peptidases are increased upon TCR-dependent and MHC-peptide activation of primary CD4 T cells from healthy or HIV-infected persons. Changes in peptidase activities altered the degradation patterns of HIV Ags analyzed by mass spectrometry, modifying the amount of MHC-I epitopes produced, the antigenicity of the degradation products, and the coverage of Ags by degradation peptides presentable by MHC-I. The computational analysis of 2237 degradation peptides generated during the degradation of various HIV-antigenic fragments in CD4 T cells identified cleavage sites that were predictably enhanced, reduced, or unchanged upon cellular activation. Epitope processing and presentation by CD4 T cells may be modulated by the activation state of cells in a sequence-dependent manner. Accordingly, cellular activation modified endogenous Ag processing and presentation and killing of HIV-infected CD4 T cells by CD8 T cells in a way that mirrored differences in in vitro epitope processing. The clearance of HIV-infected cells may rely on different immune responses according to activation state during HIV infection.


Figures

Figure 1:
Figure 1:
CD3/CD28-stimulation increases peptidase activities in primary CD4 T cells. A. The surface expression of CD25 (circle) and CD69 (triangle) was monitored by flow cytometry in non-stimulated (open) and CD3/CD28-stimulated (plain) CD4 T cells at 8, 24 and 48h. Results are shown for n=3-4 healthy donors. B. The peptidase activities (proteasomal chymotryptic (circle), tryptic- (triangle) and caspase-like (inversed triangle), aminopeptidase (square), lysosomal cathepsin S (dark circle) and Omnicathepsin (diamond) were measured with peptidase-specific fluorogenic substrates in the same samples at 8, 24 and 48h post-stimulation. The fold change in activities was calculated by dividing the peptidase activity for the stimulated samples by their paired non-stimulated counterparts. n=4 healthy donors. C. Peptidase activities in paired non-stimulated (open circles) and CD3/CD28-stimulated (filled circles) primary CD4 T cells measured at 48h post-stimulation. Results are shown for n=15-17 healthy donors. Wilcoxon matched-pairs signed rank t test were performed (* p<0.05, ** p<0.01, *** p<0.001). D. Peptidase activities were plotted against the percentage of CD25+ CD4+ T cells in each experiment. n=10-12 healthy donors. Correlation was calculated by Spearman test (r>0.5 and p<0.02). E. The surface expression of CD25 was monitored by flow cytometry in CD4 T cells stimulated with increasing concentrations of a cognate peptide (0, 0.001, 0.01, 0.1, 1 and 10 μg/mL) presented by the autologous B cell line at 48h post-stimulation. Results are shown for n=3 CD4 T cell clones. F. The surface expression of CD25 was monitored by flow cytometry in CD4 T cells stimulated by autologous B cell lines incubated with no peptide (open circle), the cognate peptide at 1 μg/mL (filled square), an irrelevant peptide at 1 μg/mL (open square) or CD3/CD28 (filled circle) at 8, 24 and 48h in the left panel. Results are shown for n=3 CD4 T cell clones. The fold change in the percentage of CD25-positive CD4 T cells (Percentage of stimulated sample divided by percentage of non-stimulated sample) is represented on the right panel for the irrelevant peptide (white), the matched peptide (grey) and CD3/CD28-stimulated CD4 T cell clones. G. Peptidase activities were plotted against the percentage of CD25+ CD4+ T cells for a representative CD4 T cell clone across the different peptide concentrations tested. Correlation was calculated by Spearman test (r>0.5 and p<0.035).
Figure 2:
Figure 2:
The expression of proteasomal subunits and post-proteasomal peptidases is modified upon CD3/CD28-stimulation. The expression of 13 proteasomal subunits (catalytic subunit of the 20S core beta1, beta2, beta5; non-catalytic subunits of the 20S core alpha2, and beta4; constitutive proteasome 19S subunits S1, S4 and S6alpha; catalytic subunits of the immunoproteasome beta1i, beta2i and beta5i; and immunoproteasome 11S lid subunits PA28alpha and PA28beta), 3 aminopeptidases (ERAP1, ERAP2, LAP) and 2 post-proteasomal proteases (TOP, TPPII) were assessed in paired non-stimulated (open circles), CD3/CD28-stimulated (filled circles) CD4 T cell samples by Western blot. The ratios of protein of interest over actin (loading control) are presented for each sample pair. N=7-9 healthy donors. Wilcoxon matched-pairs signed rank t tests were performed (* p<0.05, ** p<0.01).
Figure 3:
Figure 3:
CD3/CD28-stimulation decreased HLA-A03/11-ATK9 epitope production. A. Representative degradation patterns of 5-ATK9-2 (HIV-1 RT, aa 153-168) during 120min degradation in paired non-stimulated (left) and CD3/CD28-stimulated cytosolic extracts. The degradation products were identified by mass spectrometry and classified as original substrate (grey), optimal epitope (green), precursors or peptides encompassing the optimal epitope (blue) and antitopes, peptides in which the optimal epitope has been cleaved (orange). B. Quantification of the degradation products at 3, 30, 60, 120 and 180min in paired non-stimulated and CD3/CD28-stimulated cytosolic extracts. C. Percentage of precursors (left), antitopes (middle) and epitopes (right) produced in paired non-stimulated (open circles), CD3/CD28-stimulated (filled circles) CD4 T cell extracts for each donor (n=7) at t= 120 min. Wilcoxon matched-pairs signed rank t tests were performed (* p<0.05). D. The degradation products purified from degradation in paired non-stimulated (open circles), CD3/CD28-stimulated (filled circles) CD4 T cell extracts were loaded onto HLA-A03 EBV-transformed B cell targets. Lysis of the target cells was measured by 51Cr release assay upon killing by cognate HLA-A03 ATK9-specific CTLs. Results are shown for n=7 donors. Wilcoxon matched-pairs signed rank t tests were performed (* p<0.05). E. Percentage of cell target lysis was plotted against the optimal epitope ATK9 MS peak intensity in each experiment. Results shown for n=7 donors. Correlation was calculated by Spearman test (r>0.4 and p<0.05).
Figure 4:
Figure 4:
The degradation patterns of 5-ATK9-2 vary according to activation state of cell extracts. A. Quantification of the degradation products at 3, 30, 60, 120 and 180min in paired non-stimulated (left) and CD3/CD28-stimulated (right) cytosolic extracts according to peptide lengths (shorter fragments <7aa in gray, MHC class I potential binders 8-12aa in green and potential MHC-I precursors 13-15aa in orange). The numbers of peptides identified at each time point is indicated above each bar. B. Percentage of short fragments (left) and MHC class I binders (right) produced in paired non-stimulated (open circles), CD3/CD28-stimulated (filled circles) CD4 T cell extracts for each donor (n=7). Wilcoxon matched-pairs signed rank t tests were performed (* p<0.05). C. Cleavage patterns of 5-ATK9-2 after degradation in non-stimulated (open bars) and CD3/CD28-stimulated (filled bars) at 180min showing the relative amount of fragments starting (N-terminus, top) or ending (C-terminus, bottom) at each residue. Stars (blue for decrease, red for increase) indicate statistically significant differences in cleavage sites between degradation in non-stimulated and CD3/CD28-stimulated extracts. D. Percentage of fragments starting (top) or ending (bottom) at the amino acids highlighted in panel C. Results are shown for n=10 donors. Wilcoxon matched-pairs signed rank t tests were performed (* p<0.05, ** p<0.01, *** p<0.001).
Figure 5:
Figure 5:
Resting and CD3/CD28-stimulated CD4 T cell extracts process HIV1 Gag p24-10-35m differently. A. Sequence of HIV-1 Gag p24-10-35m and map of the MHC class I optimal epitopes. B. Cleavage patterns of p24-10-35m after degradation in non-stimulated (open bars) and CD3/CD28-stimulated (filled bars) at 120min showing the relative amount of fragments starting (N-terminus cleavage site) at each amino acid residue. Stars indicate the statistically significant difference between degradation in non-stimulated and CD3/CD28-stimulated extracts. N=11 donors. C. Percentage of HLA-B57-KI8 optimal epitope produced by degradation of p24-10-35m peptide in paired non-stimulated (open circles), CD3/CD28-stimulated (filled circles) CD4 T cell extracts (n=11 donors). Wilcoxon matched-pairs signed rank t tests were performed (* p<0.05, ** p<0.01, *** p<0.001). D. Percentage of N-extended precursor fragments of HLA-B44-EV9, HLA-B57-ISW9, HLA-A26-EL9 and Cw01-VL8 (left to right) detected after degradation of p24-10-35m peptide in paired non-stimulated (open circles), CD3/CD28-stimulated (filled circles) CD4 T cell extracts (t= 120 min, n=11 donors). Wilcoxon matched-pairs signed rank t test were performed (* p<0.05, ** p<0.01). E. Heat map representing the numbers (top) or relative amount (bottom) of all 8-11aa fragments encompassing each residue. One representative experiment out of 11 is shown. (F) Heat map representing the relative amount of all peptides <7aa (top), and 12-18aa (bottom) peptides containing a specific amino acid residue. One representative experiment out of 11 is shown.
Figure 6:
Figure 6:
Cellular activation reproducibly modulates specific cleavage sites. A. The degradation of 18 long HIV peptides in matching resting and CD3/CD28-stimulated cytosolic extracts yielded 1664 fragments and 238 distinct cleavages sites. Each fragment was quantified and relative changes in cleavage sites framing each fragment were scored in resting and activated cells, showing motifs that were increased (red, n=110), decreased (grey, n=52)) or unchanged (0-10% modulation, n=76) upon cellular activation. B. In 6 additional long HIV peptides yielding 92 cleavage sites of which 72 were also found in the training set. 50 motifs (or 69.44% of total) were accurately predicted to increase (red, n=32), decrease (blue, n=15), and remain unchanged (n=3) upon cellular activation. Inset zooms in on motifs scoring between 0-0.2. C. The degradation of 19 long HIV peptides in matching resting and CD3/CD28-stimulated cytosolic extracts yielded 1766 fragments and 226 distinct cleavages sites. Each fragment was quantified and relative changes in cleavage sites framing each fragment were scored in resting and activated cells, showing motifs that were increased (red, n=109), decreased (grey, n=56)) or unchanged (n=54) upon cellular activation. D. In 5 additional long HIV peptides yielding 110 cleavage sites of which 74 were also found in the training set. 55 motifs (or 69.6% of total) were accurately predicted to increase (red, n=40), decrease (blue, n=11), and remain unchanged (n=4) upon cellular activation. Inset zooms in on motifs scoring between 0-0.2.
Figure 7:
Figure 7:
Cellular activation changes endogenous antigen processing and epitope presentation by HIV-infected CD4 T cells to CD8+ T cells. A. Relative amount of N-extended (up to 3 aa) epitopes produced during the degradation of HIV-1 Gag-p24 5-TW10-3 (left) and 5-KF11-3 (right) in extracts of paired unstimulated (open symbols) and CD3/CD28-stimulated (filled symbols) HLA-B57+ CD4 T cells at 2, 5 and 8 h. The production of the optimal epitope is marked by a filled or open star for non-stimulated and CD3/CD28-stimulated conditions respectively. Results are shown for one representative experiment. B. Percentage of degranulating CD107a+ CD8 T cells, HLA-B57 TW10 (left) and HLA-B57-KF11 (right) after incubation with unstimulated (open symbols) or CD3/CD28-stimulated (filled symbols) HLA-B57+ CD4 T cells infected with HIV-1 NL4-3-ΔEnv-GFP pseudotyped with VSVg. CD107a degranulation of CTL was measured at 3, 24 and 48 h post-infection after 6 h of incubation at a 5:1 CTL:CD4 ratio. The results of n=5 for TW10 and n=4 for KF11 Infection and degranulation experiments are shown. C. Percentage of CD107a+ TW10- (left) and KF11-specific (right) CD8 T cells after incubation with peptide-pulsed unstimulated (open symbols) and CD3/CD28-stimulated (filled symbols) HLA-B57+ CD4 T cells. CD4 T cells were pulsed with increasing concentrations (0, 0.0002, 0.002, 0.02, 0.2, 2 μg/mL) of TW10 (left) or KF11 (right). Percentage of CD107a+ CD8 T cells were measured after 6 h of incubation at a 5:1 CTL:CD4 ratio. Results are shown for one representative experiment. D. The antigenic peptide equivalent, TW10 (left) and KF11 (right), displayed at the surface of HIV-infected unstimulated (open symbols) and CD3/CD28-stimulated (filled symbols) HLA-B57+ CD4 T cells, TW10 (left) and KF11 (right), was calculated for each time point using the peptide titration curves. The results of n=5 (TW10) and n=4 (KF11) infection and degranulation experiments are shown.

References

    1. Smith-Garvin JE, Koretzky GA, and Jordan MS. 2009. T cell activation. Annual review of immunology 27: 591–619. - PMC - PubMed
    1. Chun TW, Chadwick K, Margolick J, and Siliciano RF. 1997. Differential susceptibility of naive and memory CD4+ T cells to the cytopathic effects of infection with human immunodeficiency virus type 1 strain LAI. J Virol 71: 4436–4444. - PMC - PubMed
    1. Baldauf HM, Pan X, Erikson E, Schmidt S, Daddacha W, Burggraf M, Schenkova K, Ambiel I, Wabnitz G, Gramberg T, Panitz S, Flory E, Landau NR, Sertel S, Rutsch F, Lasitschka F, Kim B, Konig R, Fackler OT, and Keppler OT. 2012. SAMHD1 restricts HIV-1 infection in resting CD4(+) T cells. Nat Med 18: 1682–1687. - PMC - PubMed
    1. Ruffin N, Brezar V, Ayinde D, Lefebvre C, Schulze Zur Wiesch J, van Lunzen J, Bockhorn M, Schwartz O, Hocini H, Lelievre JD, Banchereau J, Levy Y, and Seddiki N. 2015. Low SAMHD1 expression following T-cell activation and proliferation renders CD4+ T cells susceptible to HIV-1. AIDS 29: 519–530. - PMC - PubMed
    1. Hosmane NN, Kwon KJ, Bruner KM, Capoferri AA, Beg S, Rosenbloom DI, Keele BF, Ho YC, Siliciano JD, and Siliciano RF. 2017. Proliferation of latently infected CD4+ T cells carrying replication-competent HIV-1: Potential role in latent reservoir dynamics. J Exp Med 214: 959–972. - PMC - PubMed

Publication types

Substances