. 2019 May;3(5):381-391.
doi: 10.1038/s41551-019-0376-5. Epub 2019 Apr 1.

High-throughput, label-free, single-cell photoacoustic microscopy of intratumoral metabolic heterogeneity

Affiliations

High-throughput, label-free, single-cell photoacoustic microscopy of intratumoral metabolic heterogeneity

Pengfei Hai et al. Nat Biomed Eng. 2019 May.

Abstract

Intratumoral heterogeneity, which is manifested in almost all of the hallmarks of cancer, including the significantly altered metabolic profiles of cancer cells, represents a challenge to effective cancer therapy. High-throughput measurements of the metabolism of individual cancer cells would allow direct visualization and quantification of intratumoral metabolic heterogeneity, yet the throughputs of current measurement techniques are limited to about 120 cells per hour. Here, we show that single-cell photoacoustic microscopy can reach throughputs of approximately 12,000 cells per hour by trapping single cells with blood in an oxygen-diffusion-limited high-density microwell array and by using photoacoustic imaging to measure the haemoglobin oxygen change (that is, the oxygen consumption rate) in the microwells. We demonstrate the capability of this label-free technique by performing high-throughput single-cell oxygen-consumption-rate measurements of cultured cells and by imaging intratumoral metabolic heterogeneity in specimens from patients with breast cancer. High-throughput single-cell photoacoustic microscopy of oxygen consumption rates should enable the faster characterization of intratumoral metabolic heterogeneity.


Figures

Fig. 1|
Fig. 1|. System schematic and working modes of SCM-PAM.
a, System schematic of SCM-PAM. b, High-resolution mode of SCM-PAM with opticaldiffraction-limited lateral resolution. c, High-throughput mode of SCM-PAM with a single-cell metabolism measurement throughput of about 3,000 cells over 15 min.
Fig. 2|
Fig. 2|. ScM-PAM of single-cell trapping and oxygen sealing in a high-density microwell array.
a, SCM-PAM of a microwell array without loading. Each well can be clearly identified. b, SCM-PAM of a microwell array loaded with a single B16 cell per well. c, SCM-PAM of a microwell array loaded with fully oxygenated blood. d, SCM-PAM of a microwell array loaded with fully deoxygenated blood. e, SCM-PAM of a microwell array loaded with blood immediately after heating select columns. f, SCM-PAM of the microwell array loaded with blood 300 min after heating select columns. H, columns with heating; N, columns without heating. g, Oxygen sealing of an array from the outside air with various initial sO2 values. The sO2 of the blood in the microwells remained unchanged during 300 min of monitoring, showing that the microwell array was fully sealed and there was no oxygen diffusion between the microwells and the outside air (n = 3 groups; the error bars show the s.d.). h, Oxygen sealing of an array between microwells. The sO2 of the blood in the microwells remained unchanged during 300 min of monitoring after heating select columns, showing that the array was fully sealed and there was no oxygen diffusion between the microwells (n = 3 groups; the error bars show the s.d.).
Fig. 3|
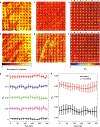
Fig. 3|. SCM-PAM of cellular metabolic heterogeneity in cultured cells.
a-d, SCM-PAM of single-cell OCRs of cultured RAW264.7 cells. a, SCM-PAM of sO2 changes in the microwells measured in high-resolution mode. b, Oxygen consumption curves of 92 RAW264.7 cells measured by SCM-PAM in high-resolution mode. c, SCM-PAM of sO2 changes in the microwells in high-throughput mode. d, Oxygen consumption curves of 2,746 RAW264.7 cells measured by SCM-PAM in high-throughput mode. e-h, SCM-PAM of single-cell OCRs of cultured A549 cells. e, SCM-PAM of sO2 changes in the microwells measured in high-resolution mode. f, Oxygen consumption curves of 86 A549 cells measured by SCM-PAM in high-resolution mode. g, SCM-PAM of sO2 changes in the microwells in high-throughput mode. h, Oxygen consumption curves of 2,761 A549 cells measured by SCM-PAM in high-throughput mode. i, Single-cell OCR distribution of the two cell lines, measured by SCM-PAM in high-throughput mode. b,d,f,h, Each data point represents the change in oxygen content in a single microwell at a measurement time point. The lines connect the data points at different measurement time points in the same microwell and are guides to allow the visualization of the changes in oxygen content.
Fig. 4|
Fig. 4|. SCM-PAM of intratumoral metabolic heterogeneity in a breast cancer patient.
a-d, Single-cell OCRs of normal breast tissue cells measured by SCM-PAM. a, SCM-PAM of sO2 changes in the microwells in high-resolution mode. b, Oxygen consumption curves of 87 normal cells measured by SCM-PAM in high-resolution mode. c, SCM-PAM of sO2 changes in the microwells in high-throughput mode. d, Oxygen consumption curves of 2,438 normal cells measured by SCM-PAM in high-throughput mode. e-h, Single-cell OCRs of cancerous breast tissue cells measured by SCM-PAM. e, SCM-PAM of sO2 changes in the microwells in high-resolution mode. f, Oxygen consumption curves of 93 cancer cells measured by SCM-PAM in high-resolution mode. g, SCM-PAM of sO2 changes in the microwells in high-throughput mode. h, Oxygen consumption curves of 2,463 cancer cells measured by SCM-PAM in high-throughput mode. i, Single-cell OCR distribution of normal and cancer cells from the patient measured, by SCM-PAM in high-throughput mode. b,d,f,h, Each data point represents the change in oxygen content in a single microwell at a measurement time point. The lines connect the data points at different measurement time points in the same microwell and are guides to allow the visualization of the change in oxygen content.
Fig. 5|
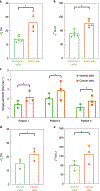
Fig. 5|. Elevated and chaotic cellular metabolic heterogeneity in cancer measured by SCM-PAM.
a,b, Elevated cellular metabolic heterogeneity in cultured cells, measured using SCM-PAM (n = 5 groups, 14,055 normal cells and 13,257 cancer cells). a, Cv values of the single-cell OCR distributions of cultured RAW264.7 and A549 cells. *P = 0.015. b, Chi-squared goodness-of-fit to normal distributions of the single-cell OCR distributions of RAW264.7 and A549 cells. *P = 0.011. c, Average single-cell OCRs of normal and cancerous breast tissue cells from three breast cancer patients. For all three patients, the cancer cells consumed oxygen faster than the normal cell on average. *P = 0.030, 0.040 and 0.015 for Patients 1, 2 and 3, respectively. d,e, Elevated cellular metabolic heterogeneity in breast cancer patients, measured using SCM-PAM (n = 3 patients, 7,549 normal cells and 6,807 cancer cells). d, Cv values of the single-cell OCR distributions of normal and cancer cells from breast cancer patients. *P = 0.013. e, Chi-squared goodness-of-fit to normal distributions of the single-cell OCR distributions of normal and cancer cells from breast cancer patients. *P = 0.023. Paired one-tailed f-tests were used in the statistical testing; the error bars show the s.d.
Fig. 6|
Fig. 6|. Oxygen consumption of cancer and normal cells in hypoxia measured by SCM-PAM.
a-c, Oxygen consumption of cultured cells in hypoxia measured by SCM-PAM (n = 5 groups). a, Normalized single-cell OCRs of cultured RAW264.7 and A549 cells at different sO2 levels. b,c, Normalized Cv (b) and χ2 (c) values of the single-cell OCR distributions of RAW264.7 and A549 cells at different sO2 levels. d-f, Oxygen consumption of normal and cancer cells from the three breast cancer patients in hypoxia, measured by SCM-PAM (n = 3 patients). d, Normalized single-cell OCRs of normal and cancer cells from breast cancer patients at different sO2 levels. e,f, Normalized Cv (e) and χ2 values of the single-cell OCR distributions of normal and cancer cells from breast cancer patients at different sO2 levels. The error bars show the s.d.

Comment in

References

    1. Fisher R, Pusztai L & Swanton C Cancer heterogeneity: implications for targeted therapeutics. Br. J. Cancer 108, 479–485 (2013). - PMC - PubMed
    1. Almendro V, Marusyk A & Polyak K Cellular heterogeneity and molecular evolution in cancer. Annu. Rev. Pathol. 8, 277–302 (2013). - PubMed
    1. Zhao Y, Butler EB & Tan M Targeting cellular metabolism to improve cancer therapeutics. Cell Death Dis. 4, e532 (2013). - PMC - PubMed
    1. Robertson-Tessi M, Gillies RJ, Gatenby RA & Anderson ARA Impact of metabolic heterogeneity on tumor growth, invasion, and treatment outcomes. Cancer Res. 75, 1567–1579 (2015). - PMC - PubMed
    1. Patel AP et al. Single-cell RNA-seq highlights intratumoral heterogeneity in primary glioblastoma. Science. 344, 1396–1401 (2014). - PMC - PubMed

Publication types