. 2018 May;2(5):279-292.
doi: 10.1038/s41551-018-0221-2. Epub 2018 Apr 16.

Efficacy and safety assessment of a TRAF6-targeted nanoimmunotherapy in atherosclerotic mice and non-human primates

Affiliations

Efficacy and safety assessment of a TRAF6-targeted nanoimmunotherapy in atherosclerotic mice and non-human primates

Marnix Lameijer et al. Nat Biomed Eng. 2018 May.

Erratum in

Abstract

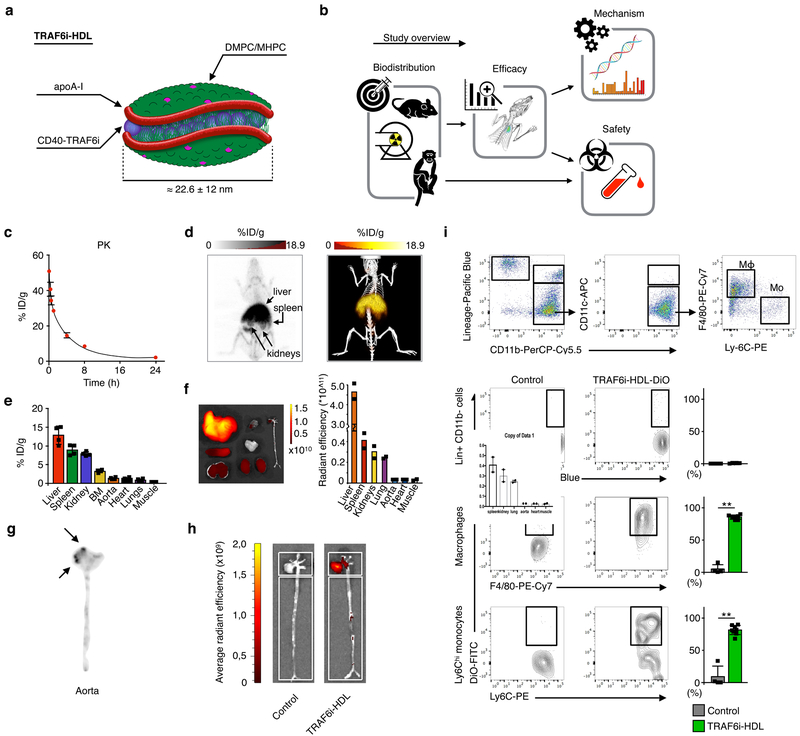
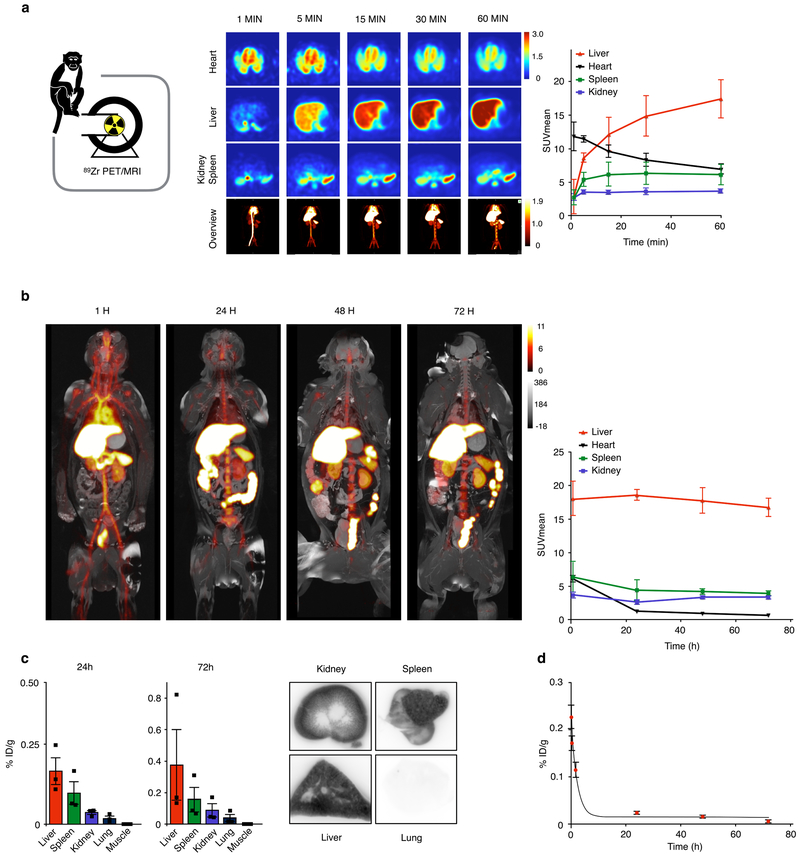
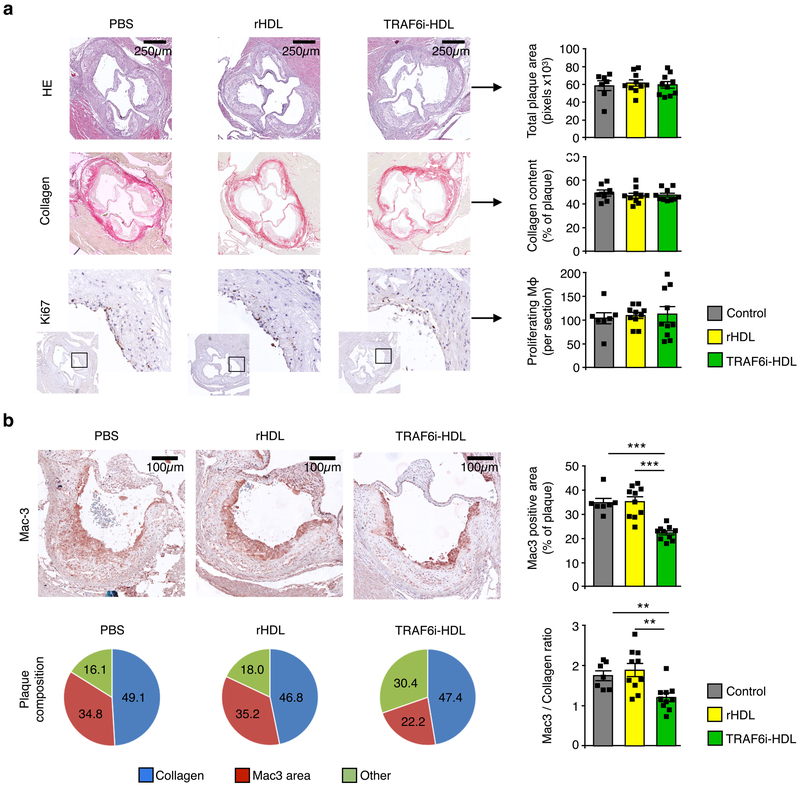
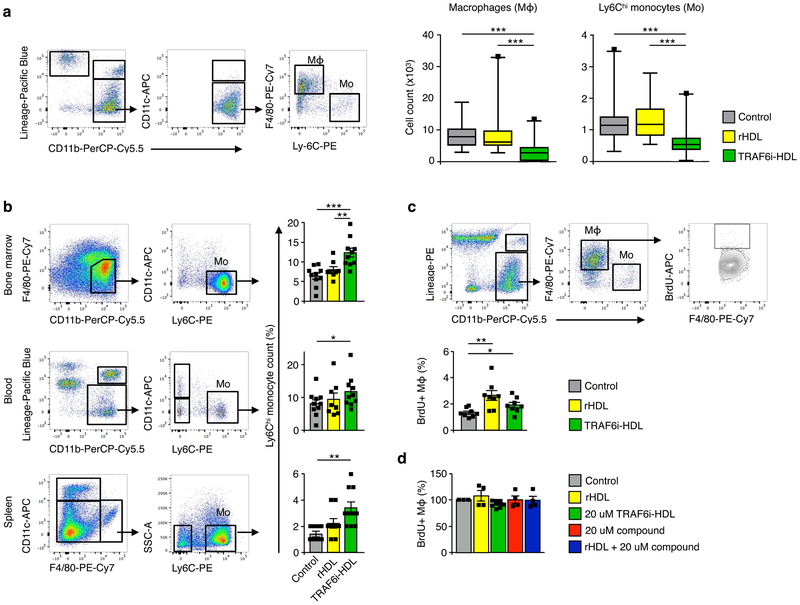
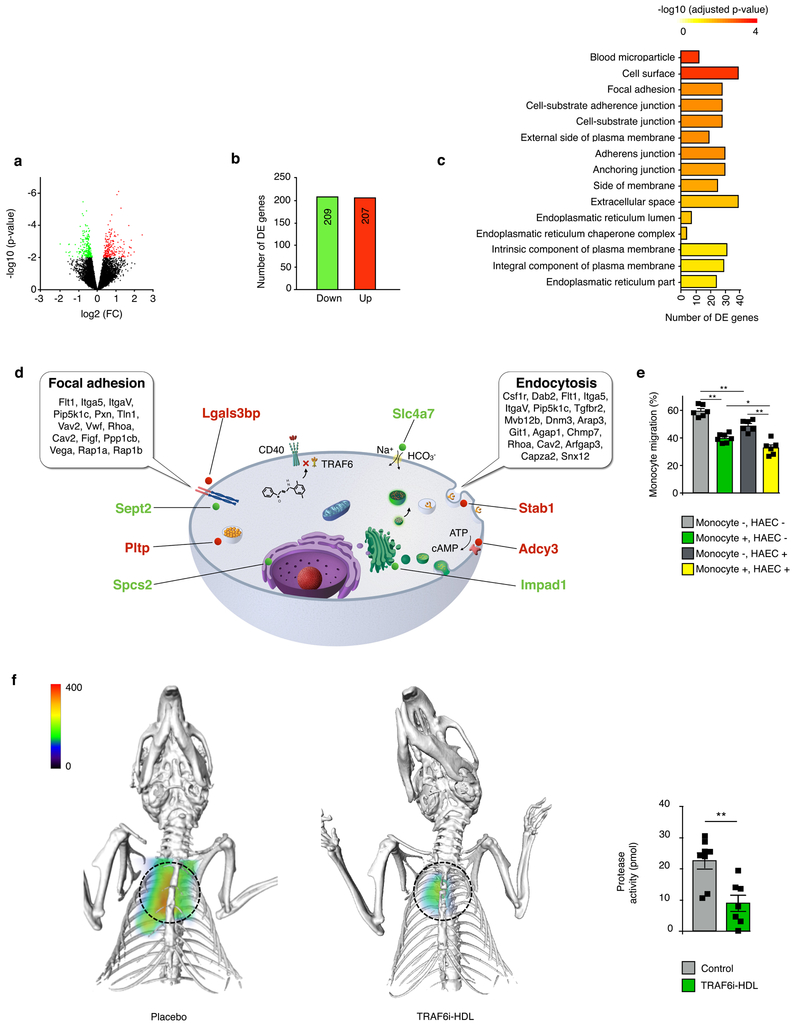
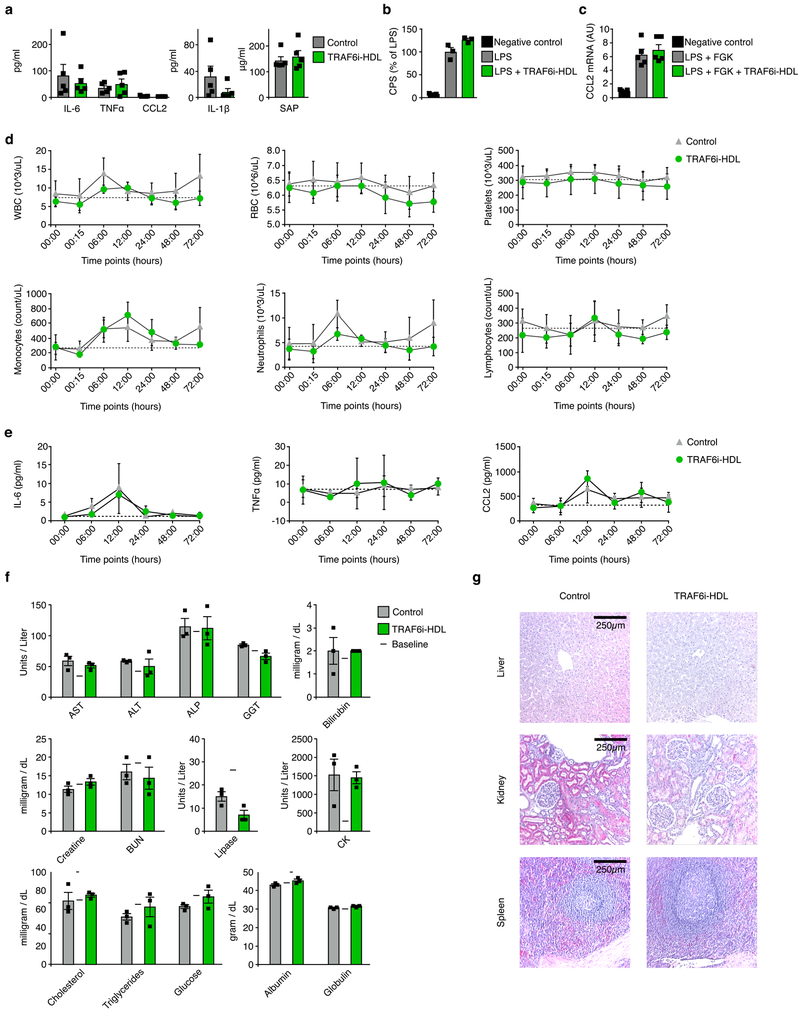
Macrophage accumulation in atherosclerosis is directly linked to the destabilization and rupture of plaque, causing acute atherothrombotic events. Circulating monocytes enter the plaque and differentiate into macrophages, where they are activated by CD4+ T lymphocytes through CD40-CD40 ligand signalling. Here, we report the development and multiparametric evaluation of a nanoimmunotherapy that moderates CD40-CD40 ligand signalling in monocytes and macrophages by blocking the interaction between CD40 and tumour necrosis factor receptor-associated factor 6 (TRAF6). We evaluated the biodistribution characteristics of the nanoimmunotherapy in apolipoprotein E-deficient (Apoe-/-) mice and in non-human primates by in vivo positron-emission tomography imaging. In Apoe-/- mice, a 1-week nanoimmunotherapy treatment regimen achieved significant anti-inflammatory effects, which was due to the impaired migration capacity of monocytes, as established by a transcriptome analysis. The rapid reduction of plaque inflammation by the TRAF6-targeted nanoimmunotherapy and its favourable toxicity profiles in both mice and non-human primates highlights the translational potential of this strategy for the treatment of atherosclerosis.


Figures

Figure 1.
Figure 1.. TRAF6i-HDL biodistribution and uptake.
(a) A schematic representation of TRAF6i-HDL, which was constructed by combining human apoA-I, lipids (DMPC and MHPC) and a small molecule inhibitor of the CD40-TRAF6 interaction. (b) Study overview showing the subsequent steps that were taken to investigate TRAF6i-HDL’s in vivo behavior and therapeutic efficacy. Eight-week old Apoe−/− mice were fed a high-cholesterol diet for 12 weeks and then received an intravenous injection with either 89Zr-, DiR or DiO core labeled TRAF6i-HDL nanoparticles. Twenty-four hours later, mice were used for PET/CT imaging or sacrificed for ex vivo NIRF imaging or flow cytometry analysis. (c) Pharmacokinetics of 89Zr-labeled TRAF6i-HDL in Apoe−\− mice (n=3), showing the blood decay curve. (d) Whole body three-dimensional rendered PET/CT fusion image at 24 hours post administration showing the highest uptake in the liver, spleen and kidneys. (e) Gamma counting of the distribution of 89Zr-labeled TRAF6i-HDL at 24 hours post administration (n=4). Bars represent the mean and standard error of the mean. (f) Biodistribution 24 hours after infusion of DIO core labelled TRAF6i-HDL in Apoe−/− mice (n=2). Ex vivo near infrared fluorescence (NIRF) imaging, showing that the nanoparticles accumulates mostly in the liver, spleen and kidneys. (g) Autoradiography of the aorta shows visible TRAF6i-HDL accumulation in the aortic root (n=3), which is the preferential location of atherosclerosis development in the mouse model. (h) NIRF imaging of DiR core labeled TRAF6i-HDL distribution in mouse aorta (n=2), showing accumulation of TRAF6i-HDL in the aortic root area. (i) Flow cytometry data of whole mouse aortas (n=8) with DiO-labeled TRAF6i-HDL, showing high targeting efficiency of macrophages (p=6.4E−3) and Ly6Chi monocytes (p=6.5E−3), while lineage positive CD11b negative cells did not take up nanoparticles. ** p < 0.01. P-values were calculated with Mann-Whitney U tests (two sided). Bars represent the mean and standard error of the mean.
Figure 2.
Figure 2.. TRAF6i-HDL biodistribution in non-human primates.
Six non-human primates were infused with 89Zr-labeled TRAF6i-HDL (1 mg/kg). Dynamic PET images were acquired within 60 minutes after infusion. Static PET/MRI scans were performed at 24, 48 and 72 hours (See Supplementary movie 1 for three-dimensional rendered MRI data). NHP were sacrificed after 72 hours. Organs were collected for ex vivo analysis. (a) Dynamic PET images at 1, 5, 15, 30 and 60 minutes (n=3). Images are split up to visualize liver and other organs separately. The graph shows the quantified uptake in the represented organs at the different time points (See Supplementary movie 2 for a 3D representation of the distribution at 60 min). (b) Static PET/MR images at 24, 48 and 72 hours show the distribution and accumulation of TRAF6i-HDL. The graph shows the quantified uptake in the represented organs at the different time points (n=3 per timepoint). (c) Gamma counting distribution in NHPs at 24 and 72 hours post administration of 89Zr-TRAF6i-HDL (n=3). Bars represent the mean. (d) Blood time-activity curve for 89Zr-TRAF6i-HDL in non-human primates (n=3 per timepoint). Bars represent the standard error of the mean.
Figure 3.
Figure 3.. TRAF6i-HDL therapy decreases plaque macrophage content as assessed by histology.
Eight-week old Apoe−/− mice were fed a high-cholesterol diet for 12 weeks and subsequently received four intravenous injections of either control (n=10), rHDL (n=10) or TRAF6i-HDL (n=10), over the course of seven days. Twenty-four hours after the last injection, aortic roots were sectioned (4 μM) and stained with (immuno)histochemistry methods. (a) Aortic roots show no difference in plaque size (H&E), collagen content (Sirius Red), or number of proliferating cells (Ki67 staining). (b) Mac3 staining of aortic roots shows a marked decrease in macrophage positive area in the TRAF6i-HDL group compared to control and rHDL (p=6.4E−4 and p=2.1E−4 respectively; Kruskal-Wallis p=1.4E−4; n=10 per group). The macrophage to collagen ratio was also decreased in the TRAF6i-HDL group compared to control and rHDL (p=2.5E−3 and p=5.2E−3 respectively; Kruskal-Wallis p=2.9E−3; n=10 per group). For all figures: Bars represent the mean and standard error of the mean unless otherwise stated. ** p < 0.01, and *** p < 0.001. P-values were calculated with Mann-Whitney U tests (two sided).
Figure 4.
Figure 4.. TRAF6i-HDL decreases plaque inflammation due to impaired Ly6Chi monocyte recruitment.
Eight-week old Apoe−/− mice on a high-cholesterol diet for 12 weeks and were treated with four intravenous injections of either control (PBS), rHDL or TRAF6i-HDL within a single week. (a) Flow cytometry analysis of whole aortas shows a significant reduction in the number of macrophages in the TRAF6i-HDL (n=27) treated group, compared to control (n=27, p=2.0E−6) and rHDL (n=26, p=1.0E−5, Kruskal-Wallis p=6.0E−7). The fact that Ly6Chi monocytes are also markedly reduced in the TRAF6i-HDL group compared to control (n=27, p=8.9E−5) and rHDL (n=26, p=5.6E−5), indicates impairment of Ly6Chi monocyte recruitment (Kruskal-Wallis p=2.4E−5). The box plots indicate the minimum and maximum values (whiskers), the 25th to 75th percentiles (box) and the median (line in the box). (b) Flow cytometry analysis of bone marrow, blood and spleen showed that the decrease in plaque Ly6Chi monocyte content could not be attributed to systemic decreases in Ly6Chi monocytes (n=8 to 10 per group, single experiment). In fact, Ly6Chi monocytes were higher in the bone marrow (p=5.8E−4), blood (p=2.7E−2), and spleen (p=1.5E−3) in the TRAF6i-HDL group compared to the control group. There was no significant difference in Ly6Chi monocytes between TRAF6i-HDL and rHDL in the blood (p=0.31) and spleen (p=0.07), while there was a difference between these groups in the bone marrow (p=5.5E−3). (c) In vivo BrdU incorporation experiment shows no inhibiting effect of TRAF6i-HDL (n=8) on plaque macrophage proliferation. BrdU incorporation was higher in the rHDL and TRAF6i-HDL group as compared to control (p=3.3E−3 and p=2.7E−2). (d) In vitro experiments (n=3) of BrdU incorporation in RAW 264.7 macrophages treated for 24 hours, with either control, rHDL, TRAF6i-HDL, bare CD40-TRAF6 small molecule inhibitor or a combination of rHDL + bare CD40-TRAF6 small molecule inhibitor, showed no effect on macrophage proliferation. For all figures means and standard errors of the mean are shown, unless otherwise stated.* p < 0.05, ** p < 0.01, and *** p < 0.001. P-values were calculated with Mann-Whitney U tests (two sided).
Figure 5.
Figure 5.. TRAF6i-HDL shows effects on monocyte migration, among other affected processes.
(a to d) Eight-week old Apoe−/− mice were fed a high-cholesterol diet for 12 weeks and were then treated with four intravenous injections of either control (n=9) or TRAF6i-HDL (n=9) over seven days. Twenty-four hours after the last injection, mice were sacrificed and frozen sections of aortic roots were used for the isolation of plaque macrophages by laser capture microdissection, followed by RNA isolation and sequencing for whole transcriptome analysis. (a) Volcano plot, showing the distribution of differentially expressed (DE) genes in plaque monocytes and macrophages. Differential expressed genes between TRAF6i-HDL treatment (n=9) and controls (n=9) were identified using the Bioconductor package limma. The differentially expressed (DE) genes were identified by a cutoff of an FDR less than 0.2. (b) The total number of significantly up- and down-regulated genes, according to cut-off values of an FDR threshold of 0.2. The FDR < 0.2 corresponds to a p-value < 0.009. (c) Gene enrichment analysis of the DE gene set within the gene ontology (GO) database, shows 15 GO terms that are significantly enriched with DE genes (Supplementary Table 1). (d) Schematic representation of a macrophage showing two significantly altered pathways (focal adhesion and endocytosis) identified by mapping the 416 DE genes with the Kyoto Encyclopedia of Genes and Genomes (KEGG) pathway tool. Also depicted are the 8 most significant DE genes with FDR < 0.05 and their location inside the cell (red is up-regulated, green is down-regulated, Supplementary Table 2 and 3). (e) In vitro transendothelial migration assay showing that TRAF6i-HDL inhibits migration of human monocytes over an endothelial barrier (HAECs). P-values for control versus TRAF6i-HDL treated monocytes are 6.2E−3 (HAEC-) and 1.5E−2 (HAEC+). In addition to the effect on monocytes, TRAF6i-HDL also has an effect on HAECs, which may contribute to the effect on endothelial transmigration. P-values for control versus TRAF6i-HDL treated endothelial cells are 4.5E−3 (monocytes-) and 3.9E−3 (monocytes+). N=6 per treatment condition. + indicates TRAF6i-HDL treated and - indicates control. P-values were calculated with Mann-Whitney U tests (two sided). No adjustment for multiple comparison was made. Bars represent the mean and standard error of the mean. (f) FMT/CT imaging shows markedly decreased protease activity in the aortic root in the TRAF6i-HDL (n=7) as compared to the control (n=8) treated group (P=3.9E−3). P-values was calculated with Mann-Whitney U tests (two sided). Bars represent the mean and standard error of the mean.
Figure 6.
Figure 6.. TRAF6i-HDL therapy shows no adverse immune effects or toxic effects in mice and non-human primates.
(a) Apoe−/− mice were intravenously injected with TRAF6i-HDL at 5 mg/kg or PBS (n=5 per group). Serum was collected 24 hours after injection. We found no signs of systemic immune activation. Interleukin 6 (IL-6), tissue necrosis factor α (TNFα), chemokine (C-C motif) ligand 2 (CCL2), interleukin 1β (IL-1β), and serum amyloid P-component (SAP) levels were not increased. Bars represent means and standard errors of the mean. (b) In vitro LPS stimulation test in 3x-κBluc plasmid transfected RAW264.7 cells, showing that TRAF6i-HDL did not affect NFκB activation. Bars represent means and standard errors of the mean. (c) In vitro LPS and FGK45 stimulation test in bone marrow derived macrophages showing that TRAF6i-HDL did not affect CCL2 expression. Bars represent means and standard errors of the mean. (d to f) Six non-human primates were infused with either control (n=3) or 1 mg/kg TRAF6i-HDL (n=3). Blood was collected at multiple time points and the animals were sacrificed 72 hours after infusion.(d) Complete blood counts showed no effects of TRAF6i-HDL therapy on lymphocytes, erythrocytes and platelets. Means and standard deviations at each timepjoint are shown. (e) IL-6, TNFα and CCL2 were not affected by TRAF6i-HDL therapy. Means and standard deviations at each timepjoint are shown. (f) Extensive blood chemistry analysis showed no toxic effects of TRAF6i-HDL infusion on hepatic, renal, pancreatic or muscle cell biomarkers. Lipids, glucose, protein (albumin and globulin) and electrolytes were also unaffected. Bars represent means and standard deviations. (g) Specimens from liver, kidneys and spleen were sectioned and stained (H&E) for histological analysis and evaluated by a pathologist (10x magnification is shown). No signs of tissue damage or disturbances in tissue architecture were found in any of the tissues (single experiment). For all figures P-values were calculated with Mann-Whitney U tests (two sided). HCT : Hematocrit, MCV : Mean corpuscular volume, MCH : Mean corpuscular hemoglobin, MCHC : Mean corpuscular hemoglobin concentration, HGB : Hemoglobin, ALB : Albumin, GLOB : Globulin, BUN : Blood urea nitrogen, LDH : Lactate dehydrogenase.

Comment in

References

    1. Swirski FK, Nahrendorf M Leukocyte behavior in atherosclerosis, myocardial infarction, and heart failure. Science. 339, 161–6 (2013). - PMC - PubMed
    1. Schönbeck U, Libby P CD40 signaling and plaque instability. Circ. Res. 89, 1092–103 (2001). - PubMed
    1. Lutgens E et al. Requirement for CD154 in the progression of atherosclerosis. Nat. Med. 5, 1313–6 (1999). - PubMed
    1. Mach F, Schönbeck U, Sukhova GK, Atkinson E, Libby P Reduction of atherosclerosis in mice by inhibition of CD40 signalling. Nature. 394, 200–3 (1998). - PubMed
    1. Schönbeck U, Sukhova GK, Shimizu K, Mach F, Libby P Inhibition of CD40 signaling limits evolution of established atherosclerosis in mice. Proc. Natl. Acad. Sci. U S A. 97, 7458–63 (2000). - PMC - PubMed

Publication types