. 2019 Jul;4(7):1149-1159.
doi: 10.1038/s41564-019-0415-8. Epub 2019 Apr 1.

Localized production of defence chemicals by intracellular symbionts of Haliclona sponges

Affiliations

Localized production of defence chemicals by intracellular symbionts of Haliclona sponges

Ma Diarey Tianero et al. Nat Microbiol. 2019 Jul.

Abstract

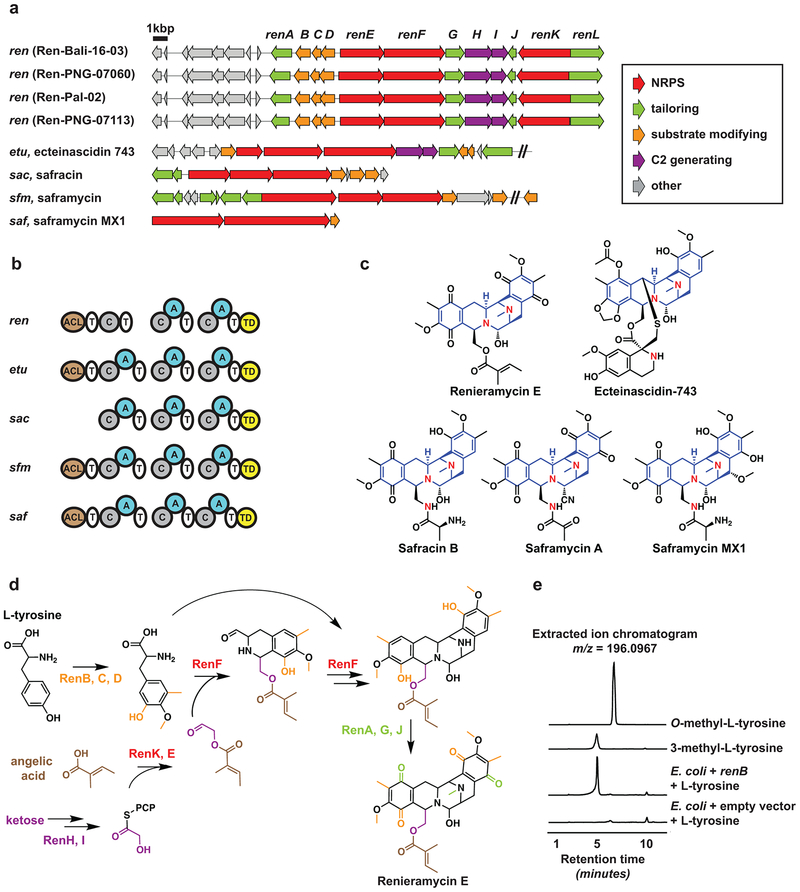
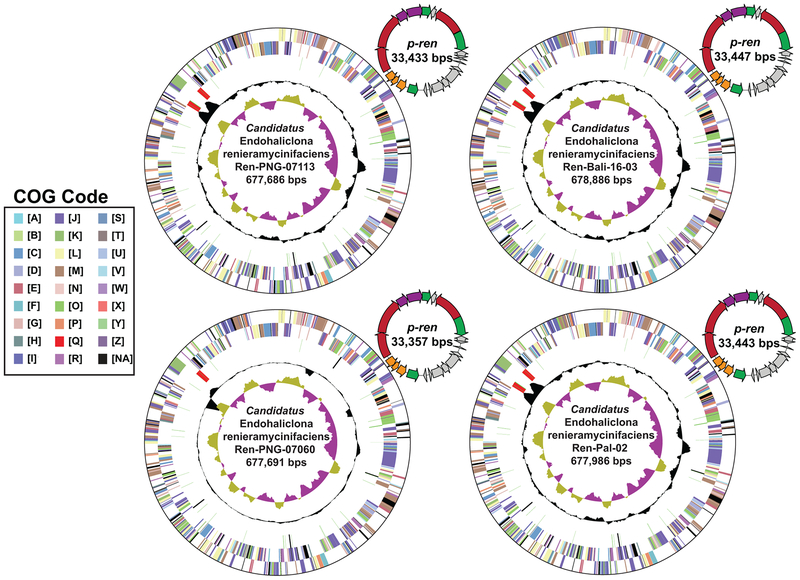
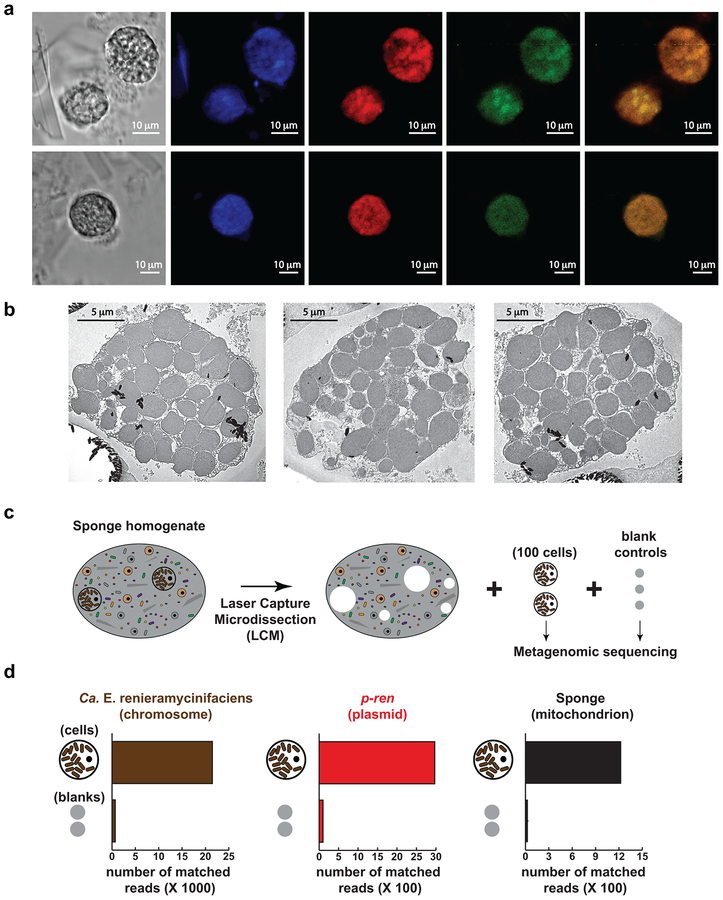
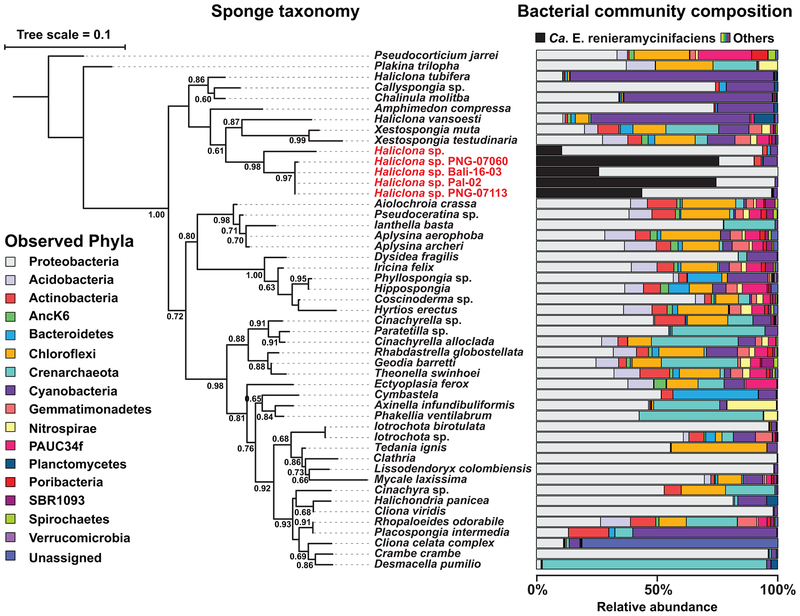
Marine sponges often house small-molecule-producing symbionts extracellularly in their mesohyl, providing the host with a means of chemical defence against predation and microbial infection. Here, we report an intriguing case of chemically mediated symbiosis between the renieramycin-containing sponge Haliclona sp. and its herein discovered renieramycin-producing symbiont Candidatus Endohaliclona renieramycinifaciens. Remarkably, Ca. E. renieramycinifaciens has undergone extreme genome reduction where it has lost almost all necessary elements for free living while maintaining a complex, multi-copy plasmid-encoded biosynthetic gene cluster for renieramycin biosynthesis. In return, the sponge houses Ca. E. renieramycinifaciens in previously uncharacterized cellular reservoirs (chemobacteriocytes), where it can acquire nutrients from the host and avoid bacterial competition. This relationship is highly specific to a single clade of Haliclona sponges. Our study reveals intracellular symbionts as an understudied source for defence chemicals in the oldest-living metazoans and paves the way towards discovering similar systems in other marine sponges.


Conflict of interest statement

Competing financial interests

Mohamed S. Donia is a member of the Scientific Advisory Board for Deepbiome Therapeutics, and a consultant for Flagship Pioneering.

Figures

Figure 1.
Figure 1.. Chemistry of Haliclona sponges.
(a) Blue Haliclona sponges from Papua New Guinea (top) and Bali (bottom): sources of the renieramycins. (b) Chemical structures of renieramycin natural products previously reported from sponges. Renieramycins A-J share the same core structure and vary only in five positions (R1-R5), which are indicated for each molecule below the drawn structure. (c) Extracted ion chromatogram of renieramycin E, m/z 549.2237 (M+H-H2O)+, the major renieramycin derivative from the four Haliclona sponge extracts reported in this study. Chemical analysis of the four sponges was repeated twice, and produced the same results.
Figure 2.
Figure 2.. Renieramycin biosynthesis.
(a) Renieramycin BGCs (ren) discovered from the four Haliclona sponges in this study (top), and previously characterized THQ BGCs from other microorganisms (bottom). (b) Comparison of the nonribosomal peptide synthetase domain architecture between ren and related BGCs: ACL: Acyl-Coenzyme A Ligase, A: Adenylation, C: Condensation, T: Thiolation, TD: Terminal reductase. (c) Chemical structures of the products encoded by the BGCs in b, showing the common pentacyclic core of the molecules in blue. Note that renieramycin E is one amino acid shorter than the typical molecules in this class: safracins and saframycins (Nitrogen atoms of individual amino acids are shown in red), which agrees with ren missing the first A domain. (d) Proposed biosynthesis of renieramycin E based on characterized homologs from this study and previous ones. (e) Extracted ion chromatograms (HPLC-HR-MS) monitored at m/z = 196.0967 for the following samples (from top to bottom): an authentic standard of O-methyl-L-tyrosine, an authentic standard of 3-methyl-L-tyrosine, an organic extract generated from the supernatant of E. coli cells expressing renB and supplemented with L-tyrosine, an organic extract generated from the supernatant of E. coli cells harboring an empty vector and supplemented with L-tyrosine. This experiment was repeated three independent times, each in a triplicated setup, and produced the same results.
Figure 3.
Figure 3.. Candidatus Endohaliclona renieramycinifaciens genomes and plasmids.
Assembled circular chromosomes of Ca. E. renieramycinifaciens from the four sponge metagenomes and the corresponding renieramycin gene cluster containing plasmids, p-ren. Concentric rings (from outside to inside) indicate genes on the forward frame, genes on the reverse frame, RNAs, GC content and GC skew. Genes are classified according to general Cluster of Orthologous Groups (COG) categories in IMG (A: RNA processing and modification, B: Chromatin structure and dynamics, C: Energy production and conversion, D: Cell cycle control, cell division, chromosome partitioning, E: Amino acid transport and metabolism, F: Nucleotide transport and metabolism, G: Carbohydrate transport and metabolism, H: Coenzyme transport and metabolism, I: Lipid transport and metabolism, J: Translation, ribosomal structure and biogenesis, K: Transcription, L: Replication, recombination and repair, M: Cell wall/membrane/envelope biogenesis, N: Cell motility, O: Posttranslational modification, protein turnover, chaperones, P: Inorganic ion transport and metabolism, Q: Secondary metabolites biosynthesis, transport and catabolism, R: General function prediction only, S: Function unknown, T: Signal transduction mechanisms, U: Intracellular trafficking, secretion, and vesicular transport, V: Defense mechanisms, W: Extracellular structures, X: Mobilome, prophages, transposons, Y: Nuclear structure, Z: Cytoskeleton, NA: Not Assigned). The color code of genes in p-ren follows the same key in Fig. 2.
Figure 4.
Figure 4.. p-ren and Ca. E. renieramycinifaciens co-localize with the largest sponge particles.
(a) A schematic representation of the flow cytometry experiment and subsequent analyses performed on Ren-Bali-16–03. (b) Relative abundance of Ca. E. renieramycinifaciens 16S rRNA gene sequence in all 8 flow partitions. Note that the relative abundance of Ca. E. renieramycinifaciens increases in later partitions containing larger particles (P9, P10). (c) Coverage (measured in RPKM: number of mapped Reads Per Kbps per Million of sequenced reads) of the Ca. E. renieramycinifaciens chromosome and p-ren in the five partitions analyzed by metagenomic sequencing. Note that the coverage of both genetic elements also increases in later partitions containing larger particles (P9, P10).
Figure 5.
Figure 5.. Localization of Ca. E. renieramycinifaciens in sponge chemobacteriocytes.
(a) Fluorescence In Situ Hybridization (FISH) of chemobacteriocytes in Ren-Bali-16–03. From left to right: bright field image, DAPI staining showing chemobacteriocytes packed with smaller cells, hybridization with the universal eubacterial probes, EU338 I, II, and III (red), showing that chemobacteriocytes harbor bacterial cells, hybridization with the Ca. E. renieramycinifaciens specific probe, CE75 (green), localizing Ca. E. renieramycinifaciens to chemobacteriocytes, composite of the green and red signals, showing their predominant co-localization. Scale bars indicate 10 μm. FISH experiments were performed six independent times, and produced the same results. (b) Transmission electron microscopy images of single Ren-Bali-16–03 chemobacteriocytes. Circular cuts on the resin result from hard spicules during thin slicing. Scale bars indicate 5 μm. Imaging experiments using transmission electron microscopy were performed two independent times, and produced the same results. (c) Schematic representation of the isolation of sponge chemobacteriocytes or blank controls by laser capture microdissection. (d) Quantification of reads that mapped to Ca. E. renieramycinifaciens chromosome (left), p-ren (middle), and sponge mitochondrion (right), showing a clear enrichment of target DNA in chemobacteriocytes (out of 850K paired-end reads in total) compared to the membrane background (out of 1M paired-end reads in total).
Figure 6.
Figure 6.. Host specificity of Ca. E. renieramycinifaciens.
18S rRNA gene-based phylogenetic tree of representative sponges (left) and the 16S rRNA gene-based bacterial composition of their corresponding microbiomes (samples are from this study and the GSM). The phylogenetic tree was constructed using Fasttree-ML (Jukes-Cantor model), and local support values as fractions of 1000 resamples are shown. When sponge species from the GSM are represented by multiple individuals, their average composition is shown (see Methods and Supplementary Table 5). Ca. E. renieramycinifaciens (indicated in black) is specific to a single clade of Haliclona sponges (names shown in red), where it constitutes a major component of their bacterial microbiome. The bacterial composition of the rest of the microbiome is shown at the phylum level, following the color code on the left.

References

    1. Thomas T et al. Diversity, structure and convergent evolution of the global sponge microbiome. Nat. Commun 7, 11870 (2016). - PMC - PubMed
    1. Hentschel U, Piel J, Degnan SM & Taylor MW Genomic insights into the marine sponge microbiome. Nat. Rev. Microbiol 10, 641 (2012). - PubMed
    1. Nguyen MT, Liu M & Thomas T Ankyrin-repeat proteins from sponge symbionts modulate amoebal phagocytosis. Mol. Ecol 23, 1635–1645, doi: 10.1111/mec.12384 (2014). - DOI - PubMed
    1. Burgsdorf I et al. Lifestyle evolution in cyanobacterial symbionts of sponges. MBio 6, e00391–00315, doi: 10.1128/mBio.00391-15 (2015). - DOI - PMC - PubMed
    1. Taylor MW, Radax R, Steger D & Wagner M Sponge-associated microorganisms: evolution, ecology, and biotechnological potential. Microbiol. Mol. Biol. Rev 71, 295–347 (2007). - PMC - PubMed

Publication types

MeSH terms

Substances