. 2019 Jun;20(6):724-735.
doi: 10.1038/s41590-019-0346-9. Epub 2019 Apr 1.

Adaptive plasticity of IL-10+ and IL-35+ Treg cells cooperatively promotes tumor T cell exhaustion

Affiliations

Adaptive plasticity of IL-10+ and IL-35+ Treg cells cooperatively promotes tumor T cell exhaustion

Deepali V Sawant et al. Nat Immunol. 2019 Jun.

Abstract

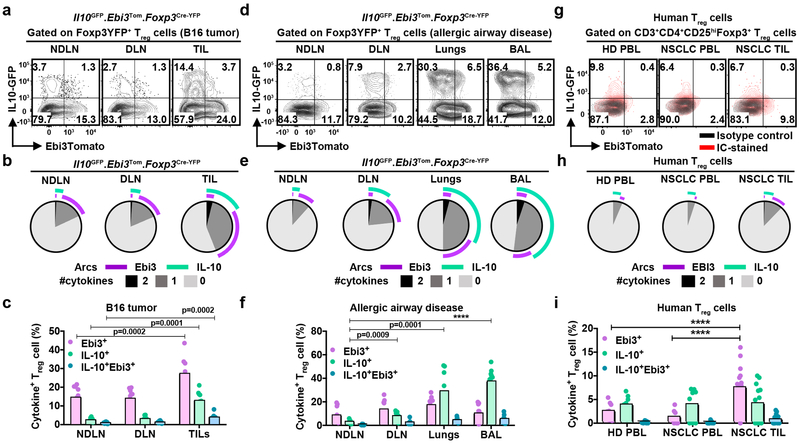
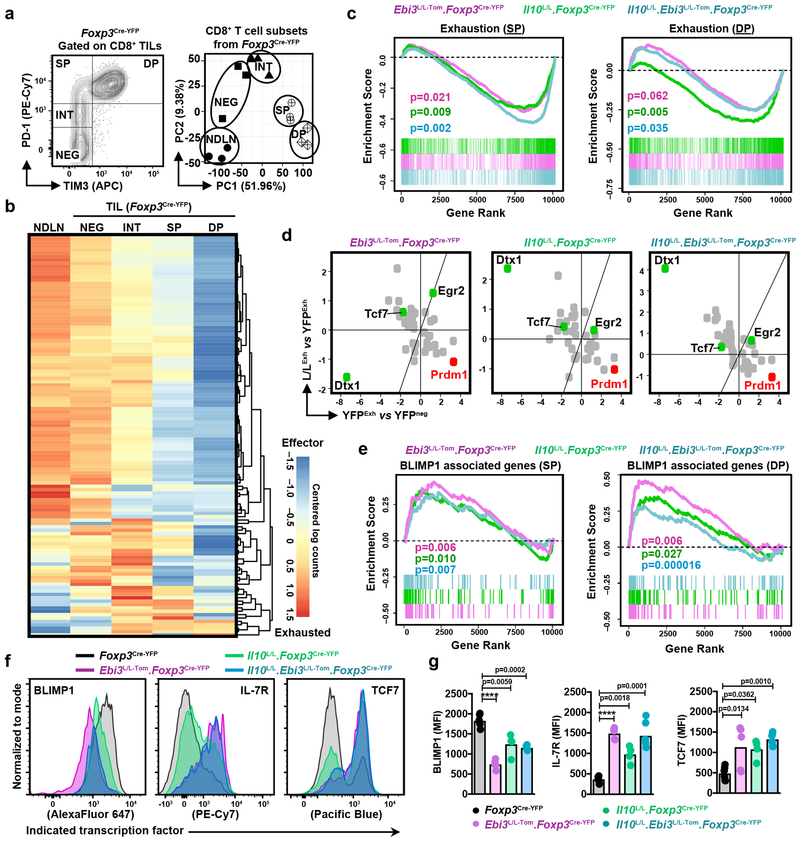
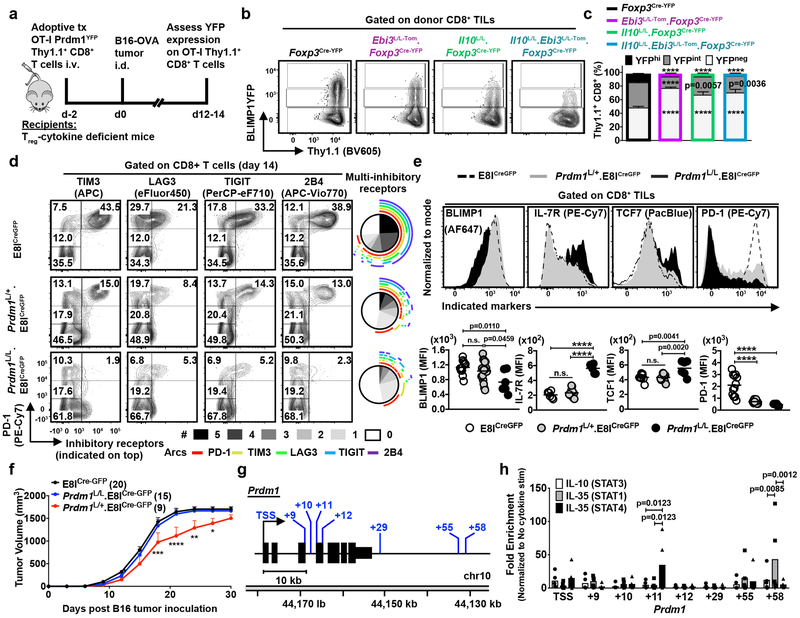
Regulatory T cells (Treg cells) maintain host self-tolerance but are a major barrier to effective cancer immunotherapy. Treg cells subvert beneficial anti-tumor immunity by modulating inhibitory receptor expression on tumor-infiltrating lymphocytes (TILs); however, the underlying mediators and mechanisms have remained elusive. Here, we found that the cytokines IL-10 and IL-35 (Ebi3-IL-12α heterodimer) were divergently expressed by Treg cell subpopulations in the tumor microenvironment (TME) and cooperatively promoted intratumoral T cell exhaustion by modulating several inhibitory receptor expression and exhaustion-associated transcriptomic signature of CD8+ TILs. While expression of BLIMP1 (encoded by Prdm1) was a common target, IL-10 and IL-35 differentially affected effector T cell versus memory T cell fates, respectively, highlighting their differential, partially overlapping but non-redundant regulation of anti-tumor immunity. Our results reveal previously unappreciated cooperative roles for Treg cell-derived IL-10 and IL-35 in promoting BLIMP1-dependent exhaustion of CD8+ TILs that limits effective anti-tumor immunity.


Figures

Figure 1:
Figure 1:. Reciprocal expression of IL-10 and IL-35 on both mouse and human Treg cells
a, Representative flow plots depicting the expression and distribution of IL-10+ and Ebi3+ cells within Foxp3YFP+ Treg cells, isolated from B16-tumor bearing Il10GFP.Ebi3Tom.Foxp3Cre-YFP mice 14 days post tumor inoculation. The expression of IL-10 (GFP+) and IL-35 (Ebi3-Tomato+) assessed in the non-draining axillary and brachial lymph nodes (NDLN), draining inguinal lymph nodes (DLN) and B16 tumor-infiltrating lymphocytes (TIL). b, SPICE plots depicting co-expression pattern of IL-10 and Ebi3 on TIL Treg cells as in (a). c, Scatter-bar plot depicting percent distribution of cytokine single- and double-positive Treg cells as in (a) (n=11 mice). Bars represent mean values. Statistical significance was determined by Two-way ANOVA with Holm-Sidak multiple comparisons (p-values as indicated). d, Representative flow plots depicting expression and distribution of IL-10+ and Ebi3+ cells within Foxp3-YFP+ Treg cells, isolated from day 14 allergic inflammation induced Il10GFP.Ebi3Tom.Foxp3Cre-YFP mice. NDLN, DLN, Lungs, and Bronchoalveolar lavage fluid (BAL). e, SPICE plots depicting co-expression pattern of IL-10 and Ebi3 on Treg cells as described in (d). f, Scatter-bar plot depicting percentage of cytokine single- and double-positive Treg cells as described in (d) (n=12 mice). Bars represent mean values. Statistical significance was determined by Two-way ANOVA with Holm-Sidak multiple comparisons (****p<0.0001 and other p-values as indicated). g, Representative flow plots depicting the expression and distribution of IL-10 and IL-35 in human Treg cells (CD4+CD25HIFoxp3+) obtained from healthy donor (HD) PBMC (PBL), NSCLC PBL, or NSCLC TILs. Cells were stimulated overnight with plate-bound anti-CD3 and anti-CD28 in the presence of hIL2, followed by four hours of stimulation with PMA-ionomycin prior to surface and intracellular (IC)-staining for IL-10 and IL-35 (EBI3) expression analysis. Isotype control (black) and IC-stained (red) are overlaid. Data representative of three independent experiments. h, SPICE plots depicting co-expression pattern of IL-10 and EBI3 on Treg cells as described in (g). i, Scatter-bar graph depicting percent distribution of inhibitory cytokines as in (g). Bars represent mean values HD PBL (n=9), NSCLC PBL (n=9), and NSCLC TIL (n=16). Statistical significance was determined by Two-way ANOVA with Holm-Sidak multiple comparisons (****p<0.0001).
Figure 2:
Figure 2:. Adaptive plasticity of IL-10+ and IL-35+ Treg cells
a, scRNAseq tSNE plots of bulk Treg cells from naive LNs or 14 days post inoculation B16 tumors (TIL Treg cells) from Foxp3Cre-YFP mice. b, scRNAseq tSNE plot depicting the expression of Il10 and Ebi3 in individual Treg cells overlaid on the same tSNE plot as in (a). c, Heat maps contrasting the top 30 genes selected based on the differential expression analysis of Treg cells utilizing the two-sided Negative Binomial Exact test, demonstrating the lack of distinct transcriptional signatures. p-values were adjusted to control the false discovery rate (FDR) set at 0.05. Treg cells were first stratified into IL-10Ebi3, IL-10+Ebi3, IL-10Ebi3+, and IL-10+Ebi3+ as described in (b). (Naive LN): IL-10Ebi3 (n=717 cells), IL-10+Ebi3 (n=3 cells), IL-10Ebi3+ (n=83 cells), and IL-10+Ebi3+ (n=3 cells). (TIL): IL-10Ebi3 (n=491 cells), IL-10+Ebi3 (n=88 cells), IL-10Ebi3+ (n=491 cells), and IL-10+Ebi3+ (n=111 cells). d, Bar graphs with overlaid scatter-dots depicting the TCR Vβ gene usage, comparing the Treg cells subpopulations and effector T cells. Three independent B16 tumor-bearing Il10GFP.Ebi3Tom.Foxp3Cre-YFP mice were used to harvest Treg cell subpopulations for sequencing without pooling. Bars represent mean values. e, In vitro tracing of adaptive plasticity in cytokine expression by TCR-stimulation. (top): Naive Treg cells from LN and spleens were double-sort purified and stimulated with anti-CD3/CD28-coated beads in the presence of hIL2 and CD11c+ cells for 72 hours, followed by FACS analysis. (bottom): Stacked bar graph summarizing four independent experiments. Statistical significance was determined by Two-way ANOVA with Holm-Sidak multiple comparisons (#p=0.0073, *p=0.0016, **=P=0.0017, ***p=0.0002, ****p<0.0001). f, Diffusion pseudo-time analysis depicting the stochastic oscillation of IL-10 and IL-35 (Ebi3) expression based on the transcriptomic features of sequenced Treg cells from the scRNAseq experiment. g, Stacked-bar graph demonstrating the distribution of indicated Treg subpopulations along the Pseudotime projection as analyzed in (f). The Pseudotime projection was evenly divided into 10 fractions and the percent distribution of each Treg cell subpopulation was calculated.
Figure 3:
Figure 3:. Cooperative, redundant regulation of CD8+ TILs by Treg cell-derived IL-10 and IL-35
(a-c): Tumor growth curve of Foxp3Cre-YFP, Il10L/L.Foxp3Cre-YFP, Ebi3L/L-Tom.Foxp3Cre-YFP, and Il10L/L.Ebi3L/L-Tom.Foxp3Cre-YFP mice inoculated with 1.25×10⁵ tumor cells intradermally. (a) B16 (**p=0.0019, ***p=0.0004, ****p<0.0001), (b) BrafPten clone 24 (*p=0.0263, ****p<0.0001), (c) EL4 (#p=0.0054, *P=0.0047, **p=0.0043, ***p=0.0003, ****p<0.0001). Data averaged from 3 independent experiments with an indicated total number of mice per genotype. Each measurement time point represents mean value with s.e.m. error bar. Statistical significance was determined by Two-way ANOVA with Holm-Sidak multiple comparisons. d, Representative flow plots depicting the expression of inhibitory receptors (PD-1 versus other inhibitory receptors: TIM3, LAG3, TIGIT, and 2B4) on CD8+ T cells infiltrating d14 B16 tumor-bearing Foxp3Cre-YFP (n=13), Il10L/L.Foxp3Cre-YFP (n=9), Ebi3L/L-Tom.Foxp3Cre-YFP (n=11), and Il10L/L.Ebi3L/L-Tom.Foxp3Cre-YFP (n=10) mice. SPICE plots depict the co-expression of multiple inhibitory receptors. e, Scatter-bar graphs tabulating the percent distribution of inhibitory receptor-negative (0 & 1 inhibitory receptor-expressing effector-like) and multi-inhibitory receptor+ (3-5 inhibitory receptor-expressing exhausted) CD8+ TILs as in (d). Bars represent mean values. Statistical significance was determined by One-way ANOVA with Holm-Sidak multiple comparisons (****p<0.0001 and other p-values indicated). f, Representative flow plots depicting expression of inhibitory receptors (PD-1 versus the other inhibitory receptors – TIM3, LAG3, TIGIT and 2B4) on CD4+Foxp3 T cells harvested from d14 B16 tumor-bearing Foxp3Cre-YFP (n=13), Il10L/L.Foxp3Cre-YFP (n=9), Ebi3L/L-Tom.Foxp3Cre-YFP (n=11), and Il10L/L.Ebi3L/L-Tom.Foxp3Cre-YFP (n=10) mice. SPICE plots depicting expression and co-expression of multiple inhibitory receptors on CD4+Foxp3 TILs. g, Bar graphs representing the percent distribution of inhibitory receptor-negative (0 & 1 inhibitory receptor-expressing effector-like) and multi-inhibitory receptor+ (4 & 5 inhibitory receptor-expressing exhausted) CD4+Foxp3 T cells as in (f). Bars represent mean values. Statistical significance was determined by One-way ANOVA with Holm-Sidak multiple comparisons (****p<0.0001 and other p-values indicated). (d-g) Data averaged from 3 independent experiments.
Figure 4:
Figure 4:. Non-redundant regulation of anti-tumor immunity by IL-10+ and IL-35+ Treg cells
a, Representative flow plots depicting the expression of IFN-γ and TNF-α. Scatter-bar plots representing the percent distribution of CD8+ TILs expressing IFN-γ and/or TNF-α infiltrating d20 B16 tumor-bearing Foxp3Cre-YFP (n=10), Il10L/L.Foxp3Cre-YFP (n=12), Ebi3L/L-Tom.Foxp3Cre-YFP (n=12), and Il10L/L.Ebi3L/L-Tom.Foxp3Cre-YFP (n=9) mice. b, Representative flow plots depicting the expression of IFN-γ and TNF-α. Scatter-bar plots representing the percent distribution of CD4+Foxp3 TILs expressing of IFN-γ and/or TNF-α as in (a). Foxp3Cre-YFP (n=10), Il10L/L.Foxp3Cre-YFP (n=12), Ebi3L/L-Tom.Foxp3Cre-YFP (n=12), and Il10L/L.Ebi3L/L-Tom.Foxp3Cre-YFP (n=9). c, Representative flow plots depicting gating strategy to identify CD8+ TCM TILs (CD44+KLRG1CD127+CD62L+TCF1+) (left). The percent distribution of CD8+ TCM was tabulated in scatter-bar graphs (right), analyzed 14 days (Foxp3Cre-YFP (n=8), Il10L/L.Foxp3Cre-YFP (n=9), Ebi3L/L-Tom.Foxp3Cre-YFP (n=10), and Il10L/L.Ebi3L/L-Tom.Foxp3Cre-YFP (n=12) mice) and 18 days (Foxp3Cre-YFP (n=12), Il10L/L.Foxp3Cre-YFP (n=13), Ebi3L/L-Tom.Foxp3Cre-YFP (n=16), and Il10L/L.Ebi3L/L-Tom.Foxp3Cre-YFP (n=10) mice) post-B16 tumor inoculation. (a-c) Data averaged from 3 independent experiments. Bars represent mean values. Statistical significance was determined by One-way ANOVA with Holm-Sidak multiple comparisons (****p<0.0001 and other p-values indicated).
Figure 5:
Figure 5:. Direct impact of IL-10 and IL-35 signaling on CD8+ TILs
a, Experimental schematic of adoptive transfer system to generate an environment in which only CD8+ T cells lack IL-10R or IL-35R. b, Tumor growth curve of Rag1−/− mice that were sequentially reconstituted with CD8-depleted splenocytes and CD8+ T cells from wild-type (WT) (n=11), IL-10R−/− (Il10rb−/−) (n=8), or IL-35R−/−(CD4Cre.Il6stL/L.Il12rb2 KO) (n=7) mice followed by B16 intradermal inoculation. Each measurement time point represents mean value with s.e.m. error bar. Statistical significance was determined by Two-way ANOVA with Holm-Sidak multiple comparisons (****p<0.0001). c, Representative flow plots depicting the expression of PD-1 against the other 4 inhibitory receptors (TIM3, LAG3, TIGIT, 2B4) and SPICE plots showing the multi-inhibitory receptor expression on the donor CD8+ T cells infiltrating B16 tumor-bearing reconstituted Rag1−/− mice 18 days post-tumor inoculation as described in (a). d, Scatter-bar graphs representing the percent distribution of donor CD8+ TILs based on the number of inhibitory receptors expressed. (WT: n=10, IL-10R−/−: n=6, IL-35R−/−: n=7). Bars represent mean values. Statistical significance was determined by One-way ANOVA with Holm-Sidak multiple comparisons (****p<0.0001 and other p-values indicated). (a-d) Data averaged from 2 independent experiments.
Figure 6:
Figure 6:. Treg cell-derived IL-10 and IL-35 regulate CD8+ TILs through BLIMP1–inhibitory receptor axis
(a-e) Data averaged from 5 independent RNASeq experiments: Foxp3Cre-YFP (n=3), Il10L/L.Foxp3Cre-YFP (n=2), Ebi3L/L-Tom.Foxp3Cre-YFP (n=3), and Il10 L/L.Ebi3L/L-Tom.Foxp3Cre-YFP CD8s (n=4). a, The gating strategy for double-sorted CD8+ subsets for RNAseq. (PD-1negTIM3, NEG; PD-1intTIM3, INT; PD-1hiTIM3, SP; and PD-1hiTIM3+, DP). PCA plot depicting the NDLN and CD8+ TILs subsets from Foxp3Cre-YFP. Each symbol represents an independently sequenced replicate. b, Heat map of tumor-exhaustion gene signature mapped to the chronic LCMV exhaustion program, representing the NDLN and CD8+ TIL subsets from B16-tumor-bearing Foxp3Cre-YFP mice. c, GSEA of tumor-exhaustion gene signature derived from SP (left) and DP (right) subsets of Foxp3Cre-YFP mice; p-values as indicated. d, XY plots representing differentially expressed transcription factors (TFs) in SP subsets. X axis represents differentially expressed genes in the PD-1hi (SP and DP) subsets relative to NEG subsets from control Foxp3Cre-YFP mice; Y axis represents differentially expressed genes in the Treg cell cytokine deficient environments relative to control Foxp3Cre-YFP counterparts. Only significantly changed TFs are listed. We only considered TFs that were differentially expressed in exhausted cells (PD1hi, DP and SP) with a minimum log2 fold-change of 1.5, which was further filtered for ones that were differentially expressed across genotypes in the SP subset with the same cutoffs. e, GSEA of BLIMP1 associated gene signature in SP (left) and DP (right) subsets of Foxp3Cre-YFP mice; p-values as indicated. (c, e) Statistical significance was determined by Rank Sum Test With Correlation test in the limma R package with correction for loss in degrees of freedom due to correlation among genes. All p-values are two sided. No correction for multiple hypothesis was performed. f, Representative histograms for validation of BLIMP1 and its associated gene (TCF7 and IL-7R) at the protein level in the CD8+ TILs from B16 tumor-bearing Foxp3Cre-YFP (n=6), Il10L/L.Foxp3Cre-YFP (n=4), Ebi3L/L-Tom.Foxp3Cre-YFP (n=5), and Il10L/L.Ebi3L/L-Tom.Foxp3Cre-YFP (n=6) mice from two independent experiments. g, Scatter-bar plots tabulating the expression levels of BLIMP1, IL-7R, and TCF7 as in (f). Statistical significance was determined by One-way ANOVA with Holm-Sidak multiple comparisons (****p<0.0001 and other p-values as indicated).
Figure 7:
Figure 7:. Direct and cooperative regulation of BLIMP1–inhibitory receptor axis in CD8+ TILs by IL-10 and IL-35
a, Experimental design schematic of BLIMP1YFP (Prdm1YFP)xOT1 adoptive transfer model. b, Representative flow plots depicting expression of BLIMP1YFP on Prdm1YFP.OT-I Thy1.1+ CD8+ T cells adoptively transferred into Foxp3Cre-YFP (n=11), Il10L/L.Foxp3Cre-YFP (n=10), Ebi3L/L-Tom.Foxp3Cre-YFP (n=10), and Il10L/L.Ebi3L/L-Tom.Foxp3Cre-YFP (n=6) mice B16-OVA tumors. c, Stacked bar graph depicting BLIMP1 expression in the donor CD8+ T cells as in (b). Statistical significance was determined by Two-way ANOVA with Holm-Sidak multiple comparisons (****p<0.0001 and other p-values as indicated). d, Representative flow and SPICE plots depicting the expression of inhibitory receptors (PD-1, TIM3, LAG3, TIGIT, and 2B4) on CD8+ TILs from B16-tumor-bearing E8ICre-GFP (n=9), Prdm1L/+.E8ICre-GFP (n=12), and Prdm1L/L.E8ICre-GFP (n=10)mice. e, Representative histograms depicting expression levels of BLIMP1, IL-7R and TCF7 on CD8+ TILs from B16 tumor-bearing E8ICre-GFP (n=8), Prdm1L/+.E8ICre-GFP (n=12), and Prdm1L/L.E8ICre-GFP (n=6) mice (top). For PD1, E8ICre-GFP (n=12), Prdm1L/+.E8ICre-GFP (n=12), and Prdm1L/L.E8ICre-GFP (n=6) mice. Scatter plots tabulating the percent distributions (bottom). Statistical significance was determined by One-way ANOVA with Holm-Sidak multiple comparisons (****p<0.0001 and other p-values as indicated). f, Tumor growth curve of E8ICre-GFP (n=20), Prdm1L/+.E8ICre-GFP (n=15), and Prdm1L/L.E8ICre-GFP (n=9) mice inoculated with 1.25×10⁵ cells of B16 tumors intradermally. Data averaged from 2 independent experiments. Statistical significance was determined by Two-way ANOVA with Holm-Sidak multiple comparisons (*p=0.0165, **p=0.0008, ***p=0.0002, ****p<0.0001). g, Depiction of locus surrounding mouse Prdm1. The annotated STAT-binding sites were investigated here. h ChIP analysis of IL-10-mediated STAT3 binding and IL-35-mediated STAT1/STAT4 binding to Prdm1 locus of CD8+ T cells activated for 48 hrs with anti-CD3, anti-CD28, and IL-2, followed by 4 days expansion with IL-2, resting in serum-free media for 2 hrs, then stimulation with IL-10 or IL-35 for 30 mins at 37°C. Chromatin was immunoprecipitated with anti-STAT1, anti-STAT3, anti-STAT4, or monoclonal rabbit IgG isotype control for real-time RT-PCR. Fold enrichment was calculated based on the isotype controls, which was then normalized to the no-cytokine stimulation (No-Stim) controls. Data averaged from 5 independent experiments. Bars represent mean values. Statistical significance was determined by Two-way ANOVA with Holm-Sidak multiple comparisons (p-values as indicated).

Comment in

References

    1. Vignali DA, Collison LW & Workman CJ How regulatory T cells work. Nature reviews. Immunology 8, 523–532 (2008). - PMC - PubMed
    1. Sawant DV & Vignali DA Once a Treg, always a Treg? Immunological reviews 259, 173–191 (2014). - PMC - PubMed
    1. Tanaka A & Sakaguchi S Regulatory T cells in cancer immunotherapy. Cell research 27, 109–118 (2017). - PMC - PubMed
    1. Liu C, Workman CJ & Vignali DA Targeting regulatory T cells in tumors. The FEBS journal 283, 2731–2748 (2016). - PubMed
    1. Curiel TJ, Coukos G, Zou L et al. Specific recruitment of regulatory T cells in ovarian carcinoma fosters immune privilege and predicts reduced survival. Nature medicine 10, 942–949 (2004). - PubMed

Publication types