. 2019 Apr;25(4):667-678.
doi: 10.1038/s41591-019-0405-7. Epub 2019 Apr 1.

Metagenomic analysis of colorectal cancer datasets identifies cross-cohort microbial diagnostic signatures and a link with choline degradation

Affiliations

Metagenomic analysis of colorectal cancer datasets identifies cross-cohort microbial diagnostic signatures and a link with choline degradation

Andrew Maltez Thomas et al. Nat Med. 2019 Apr.

Erratum in

Abstract

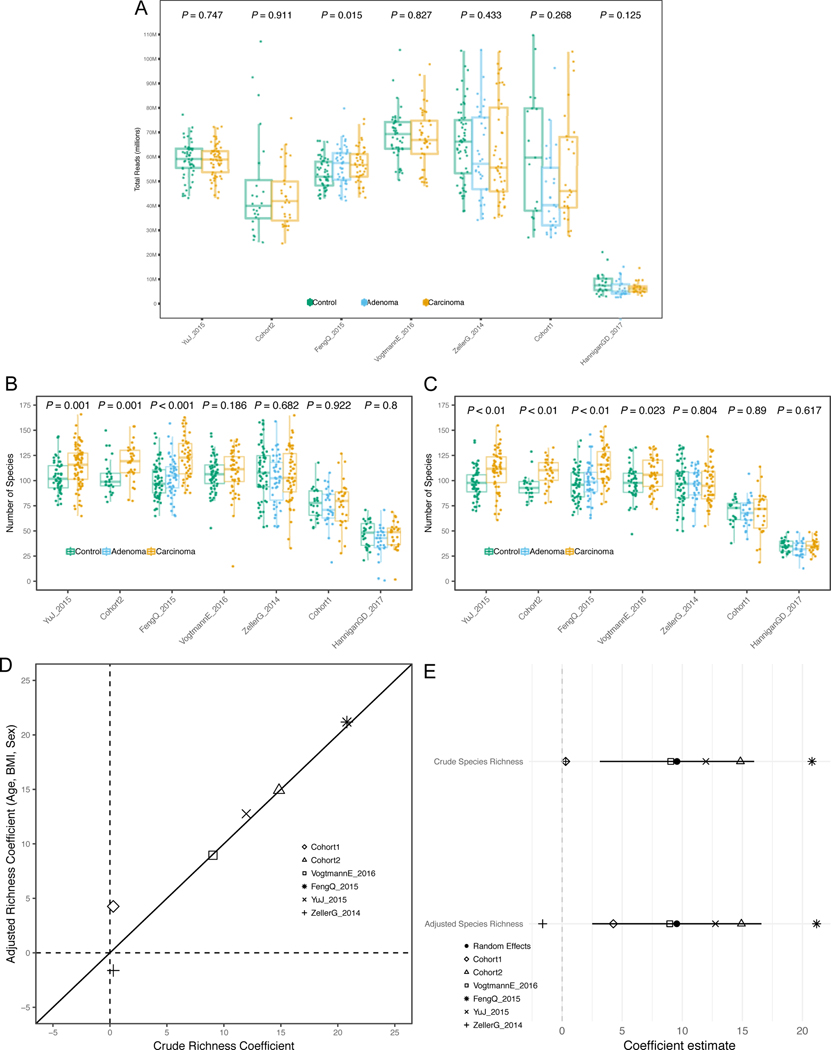
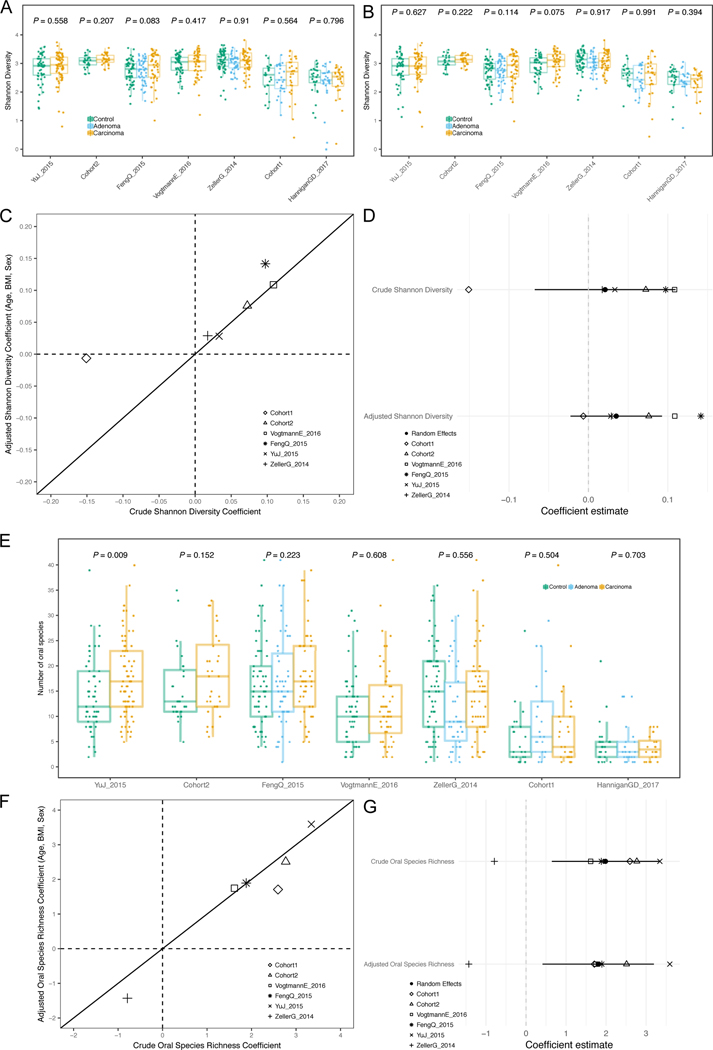
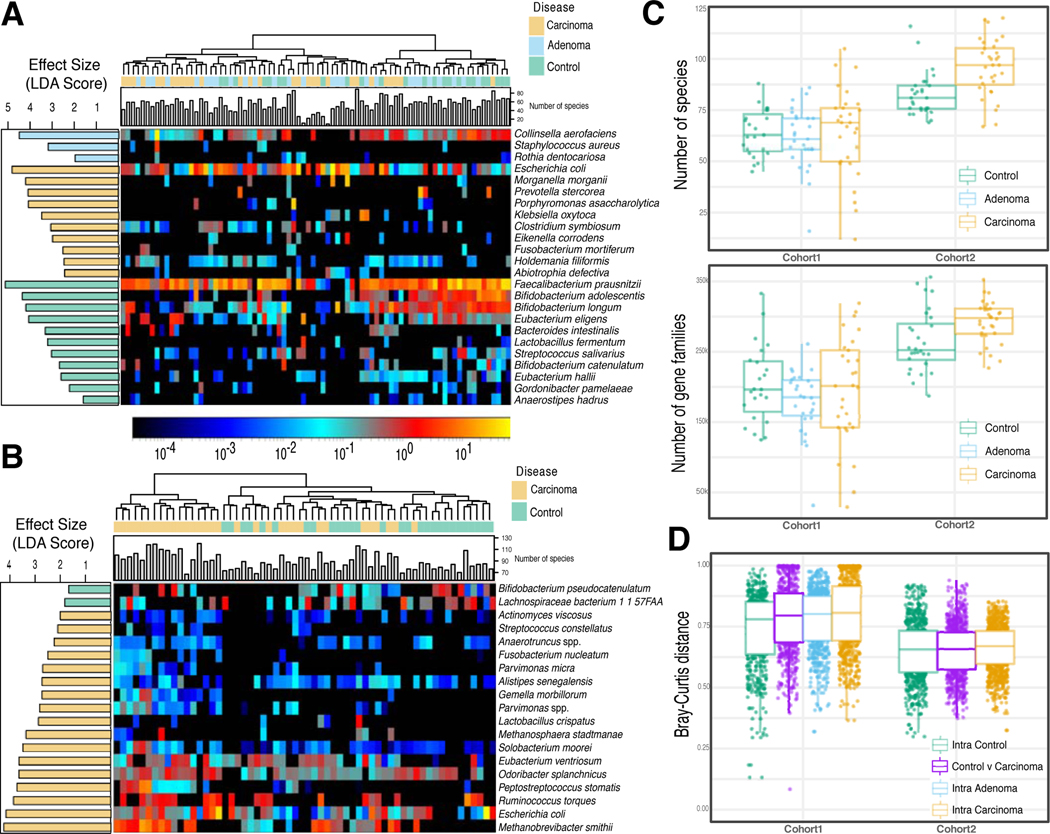
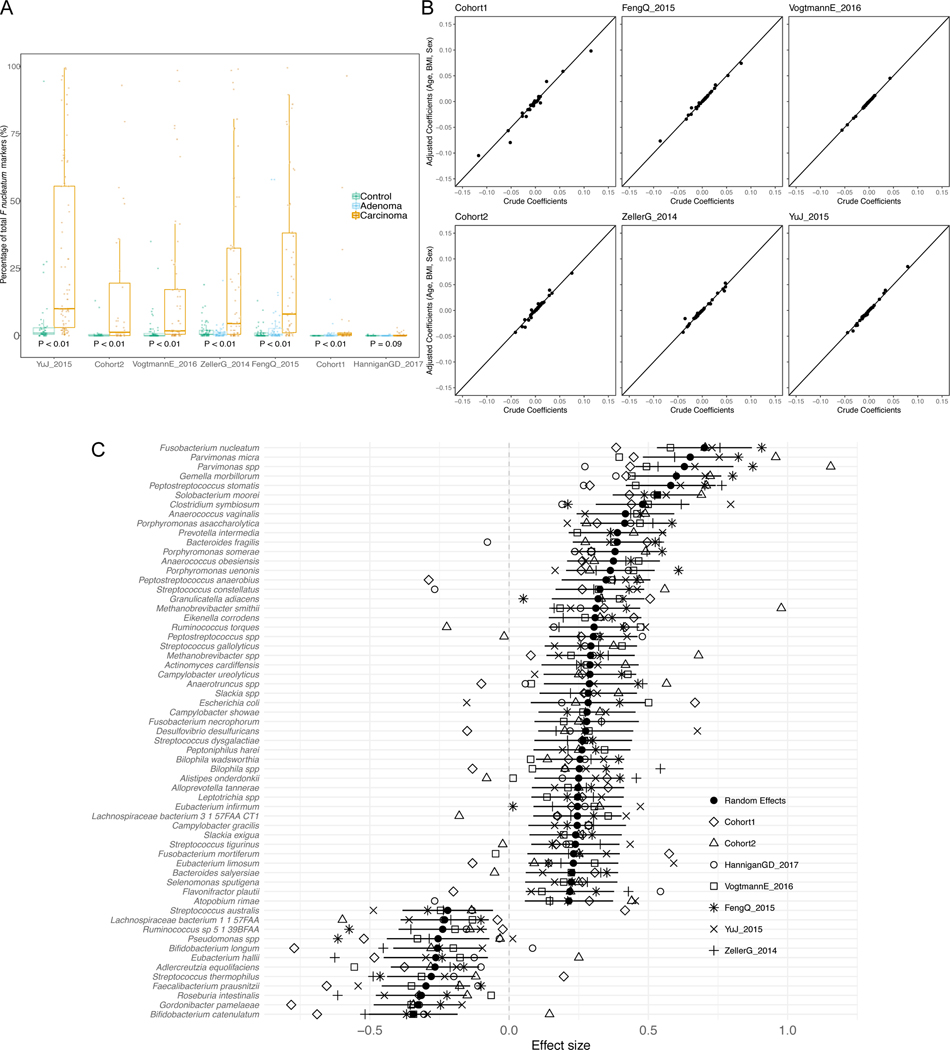
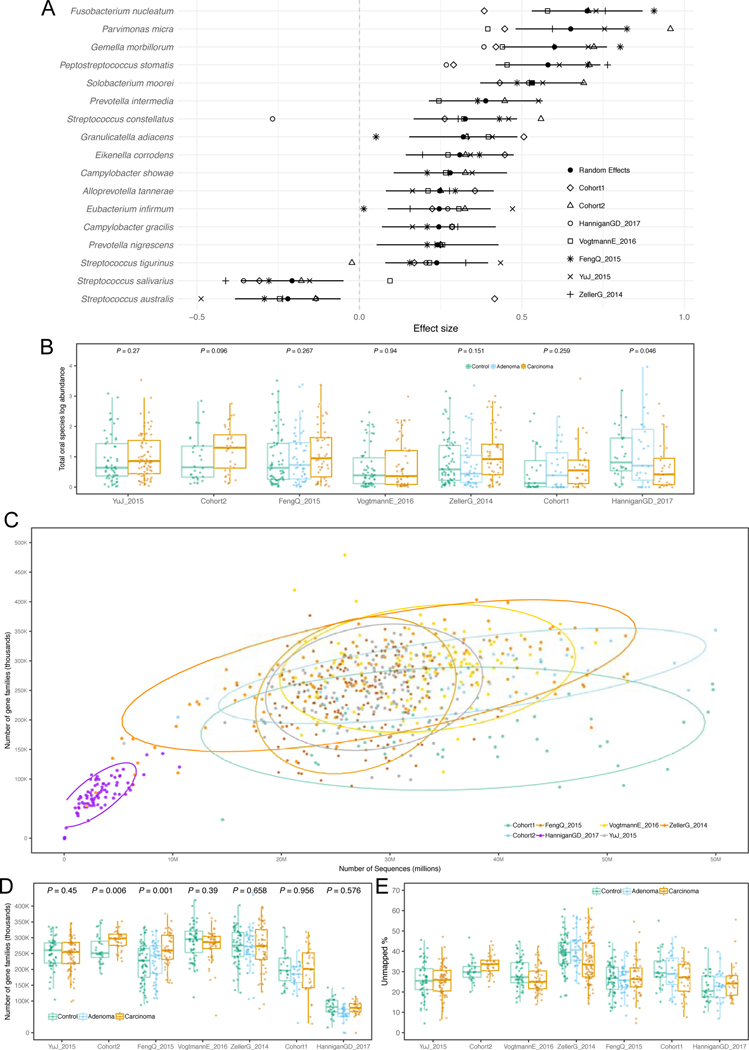
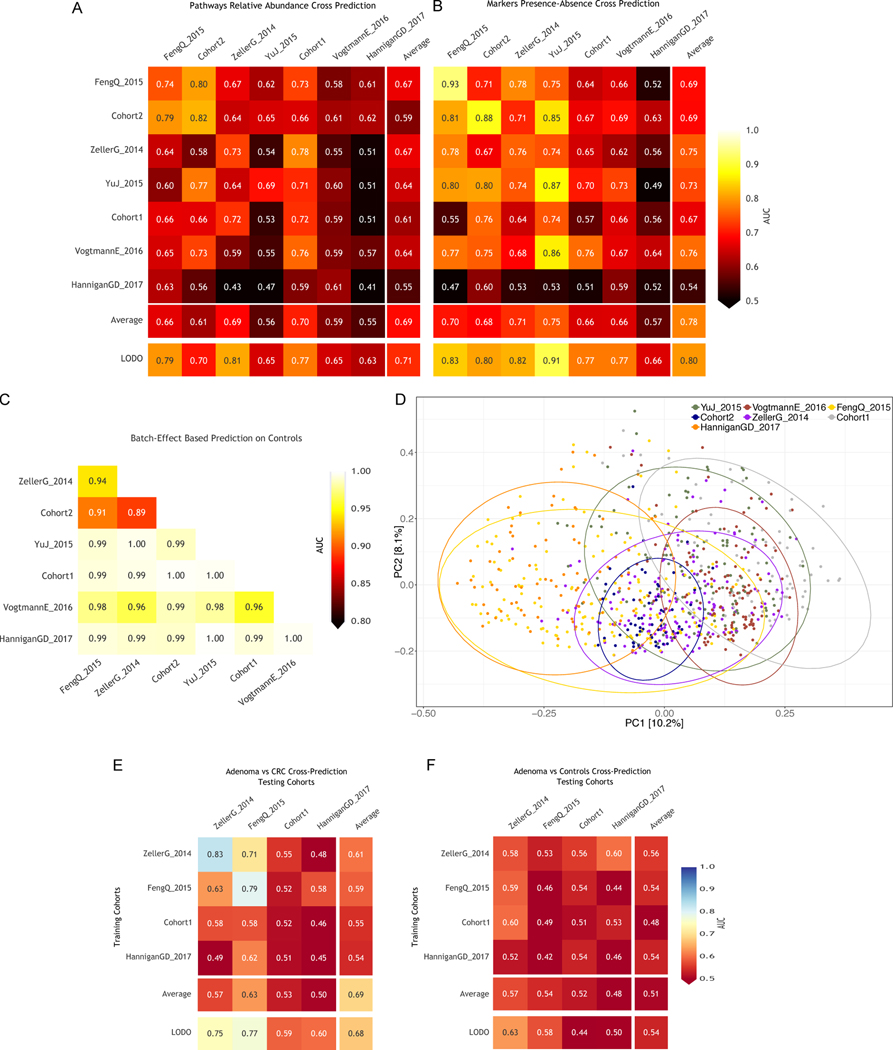
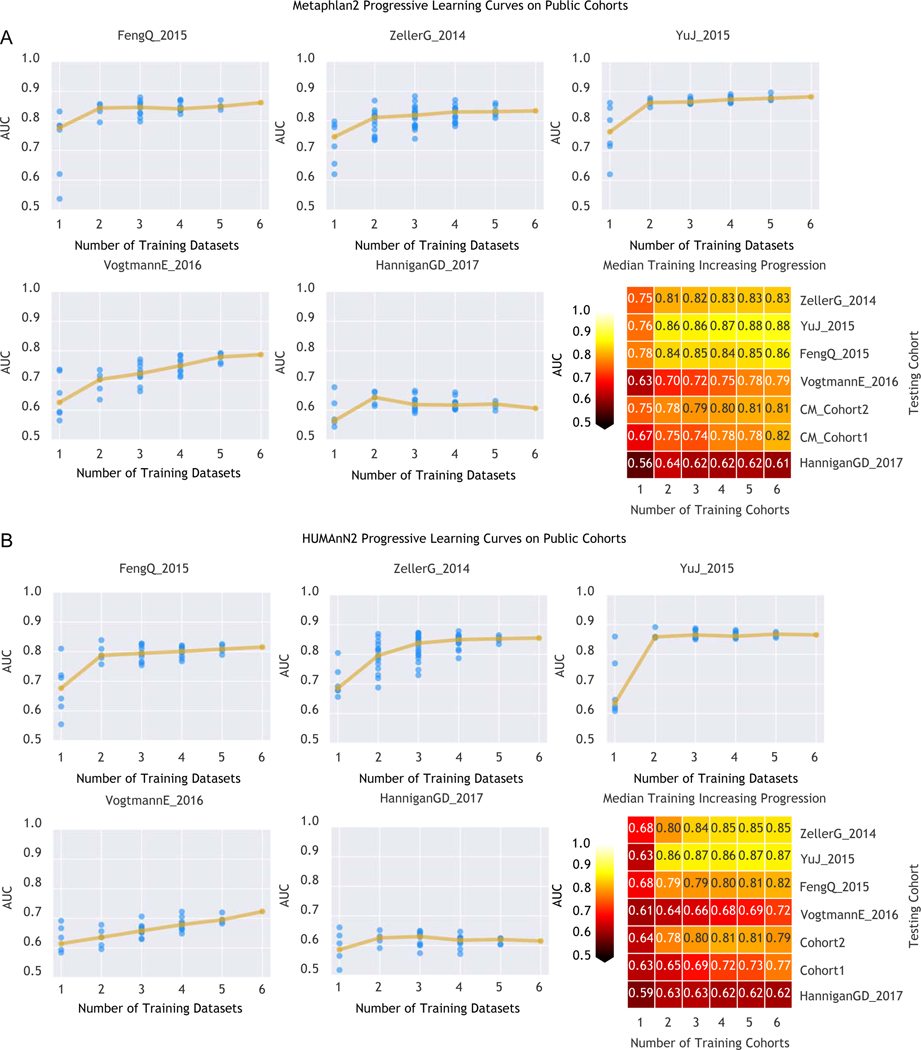
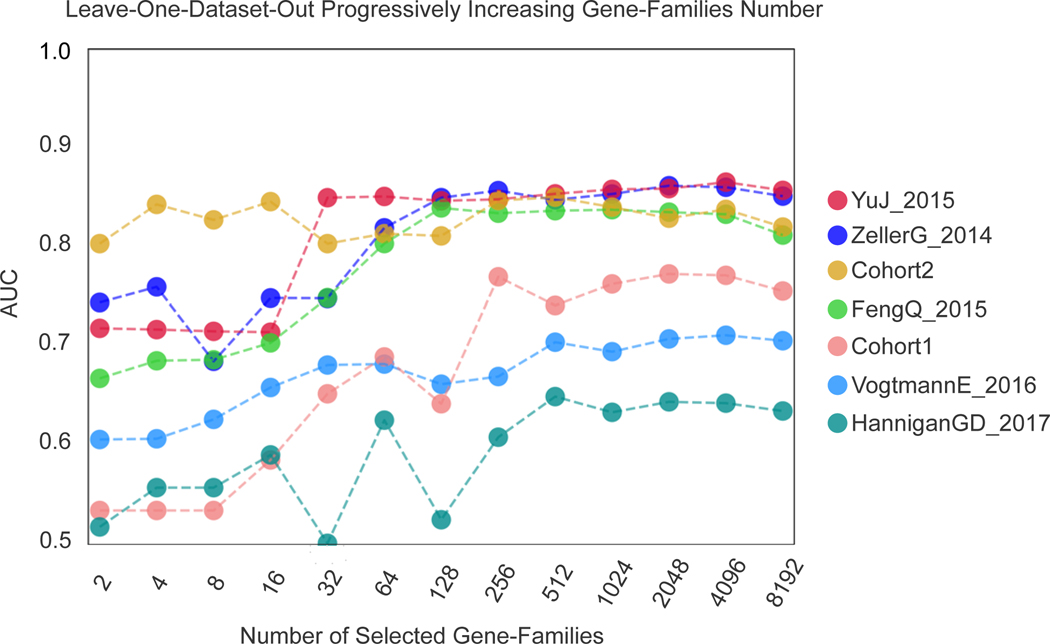
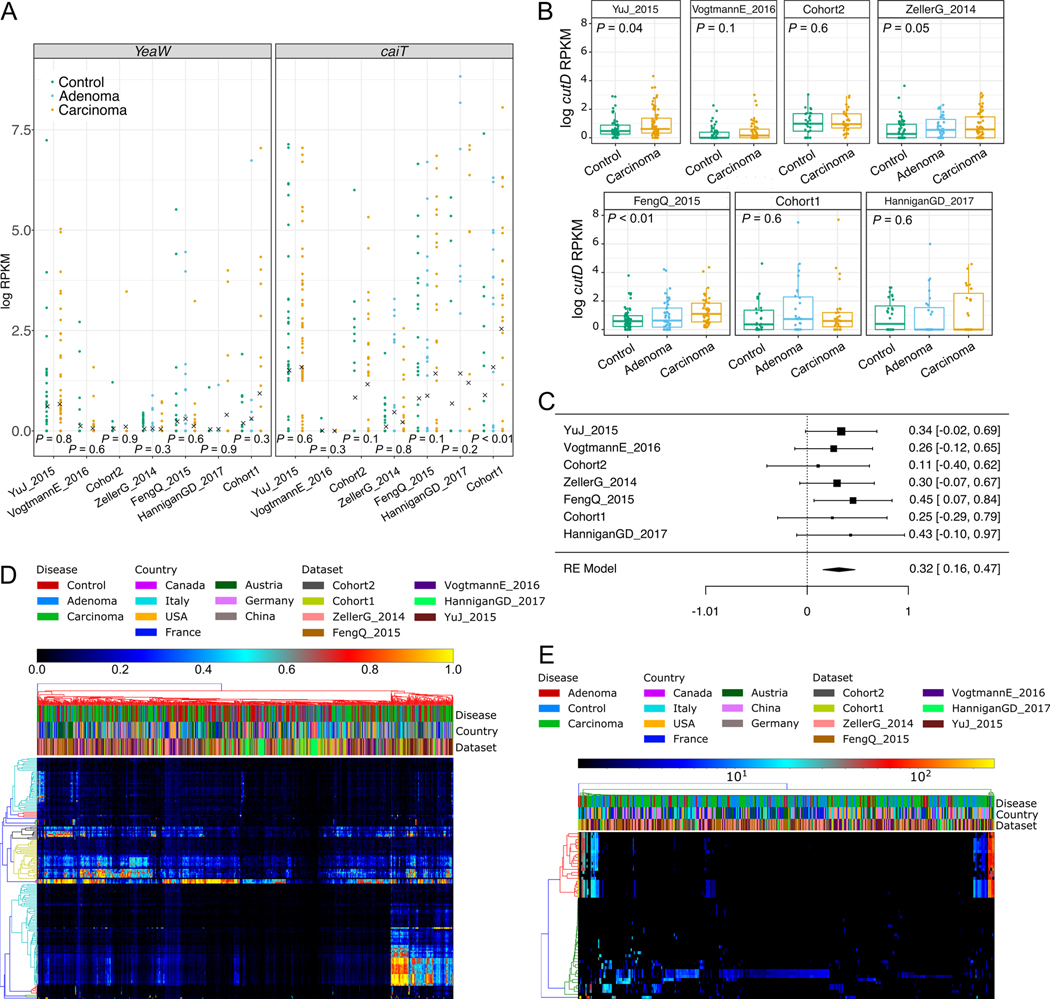
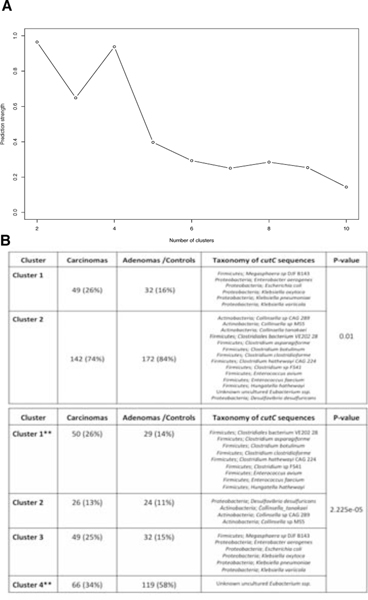
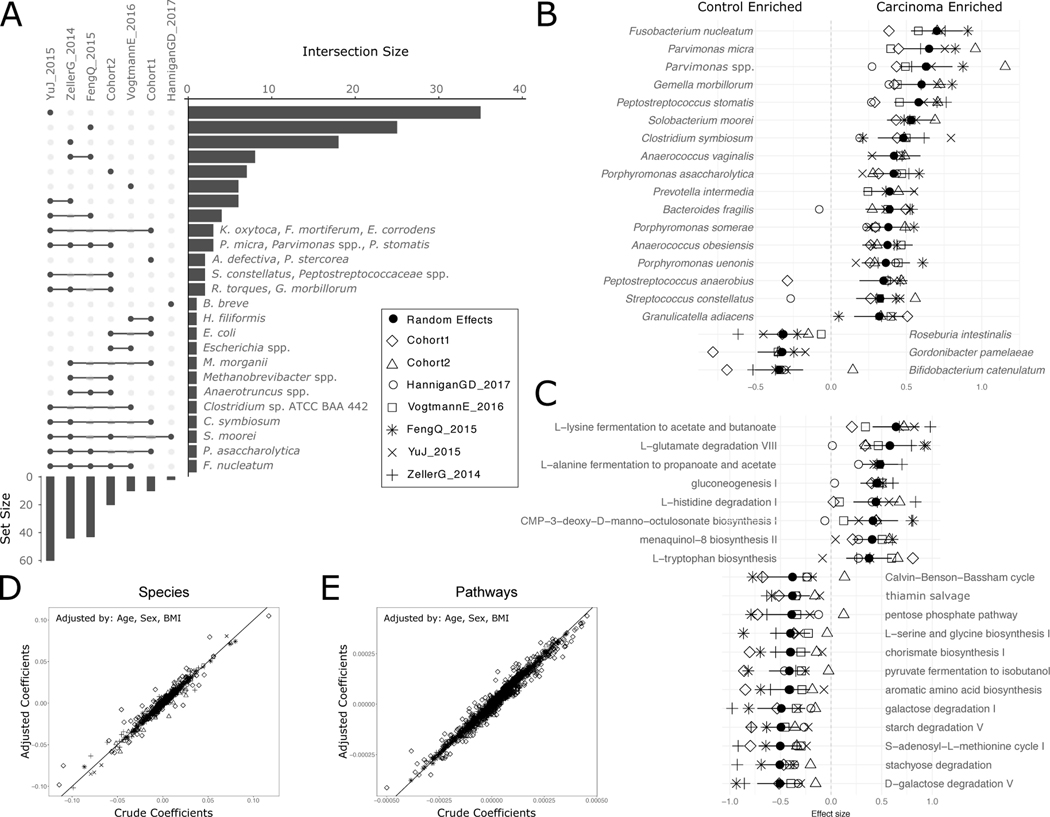
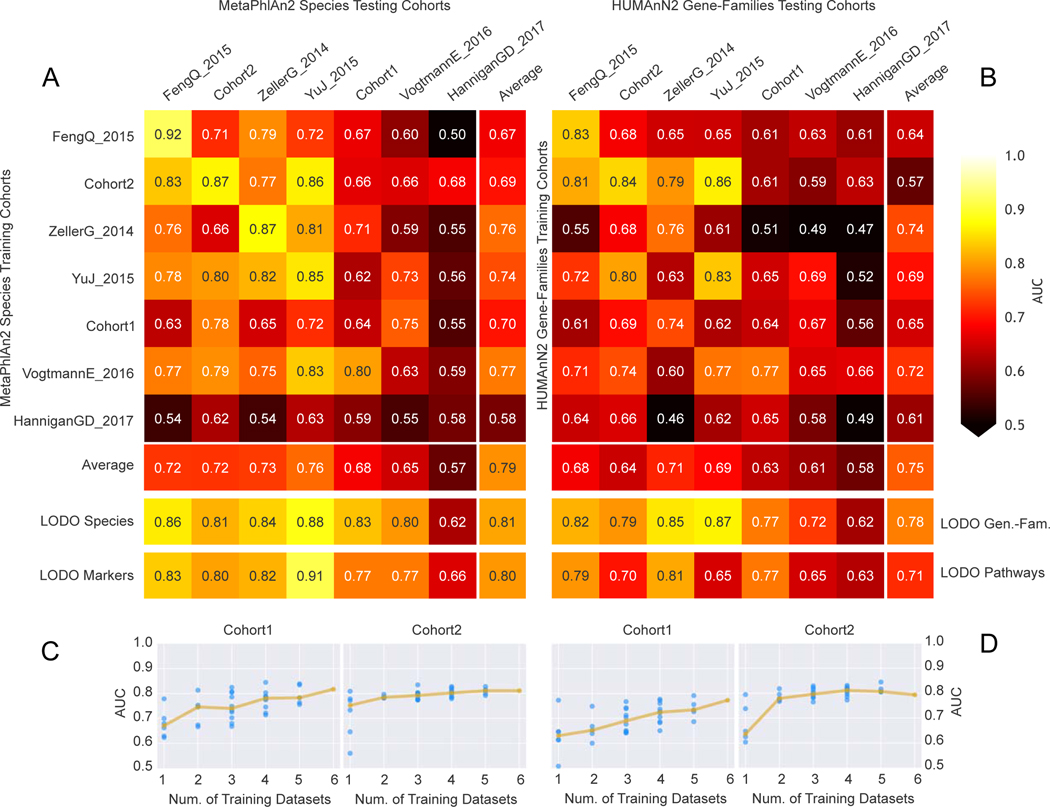
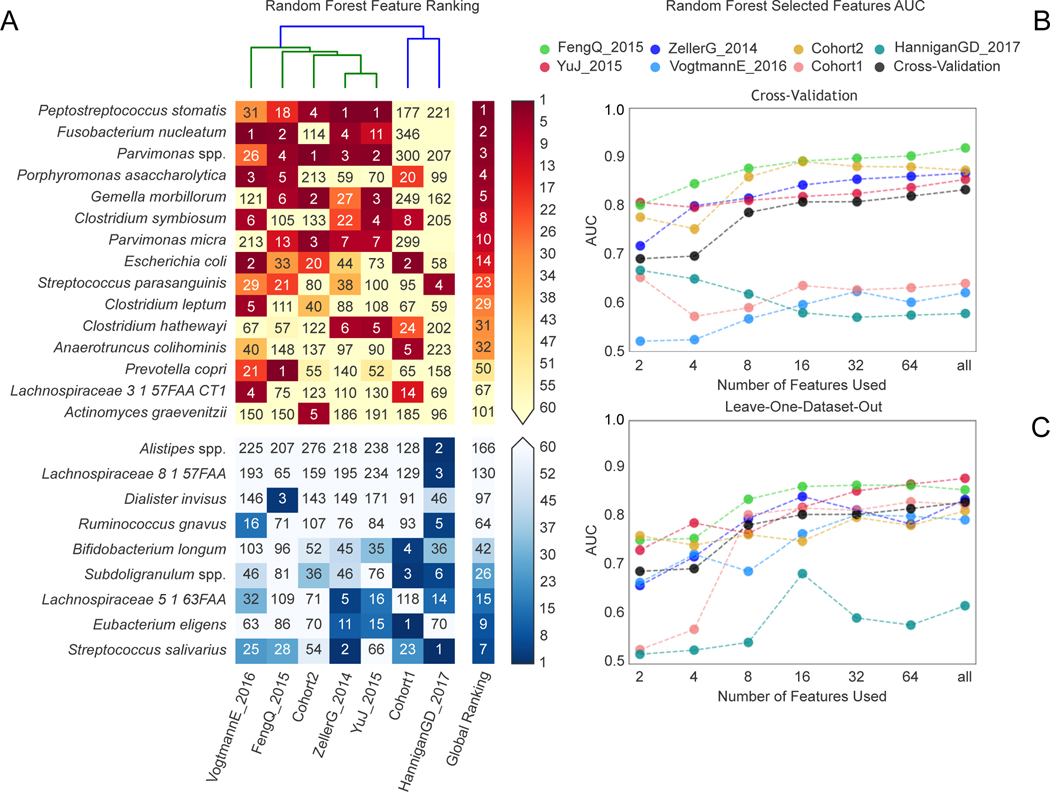
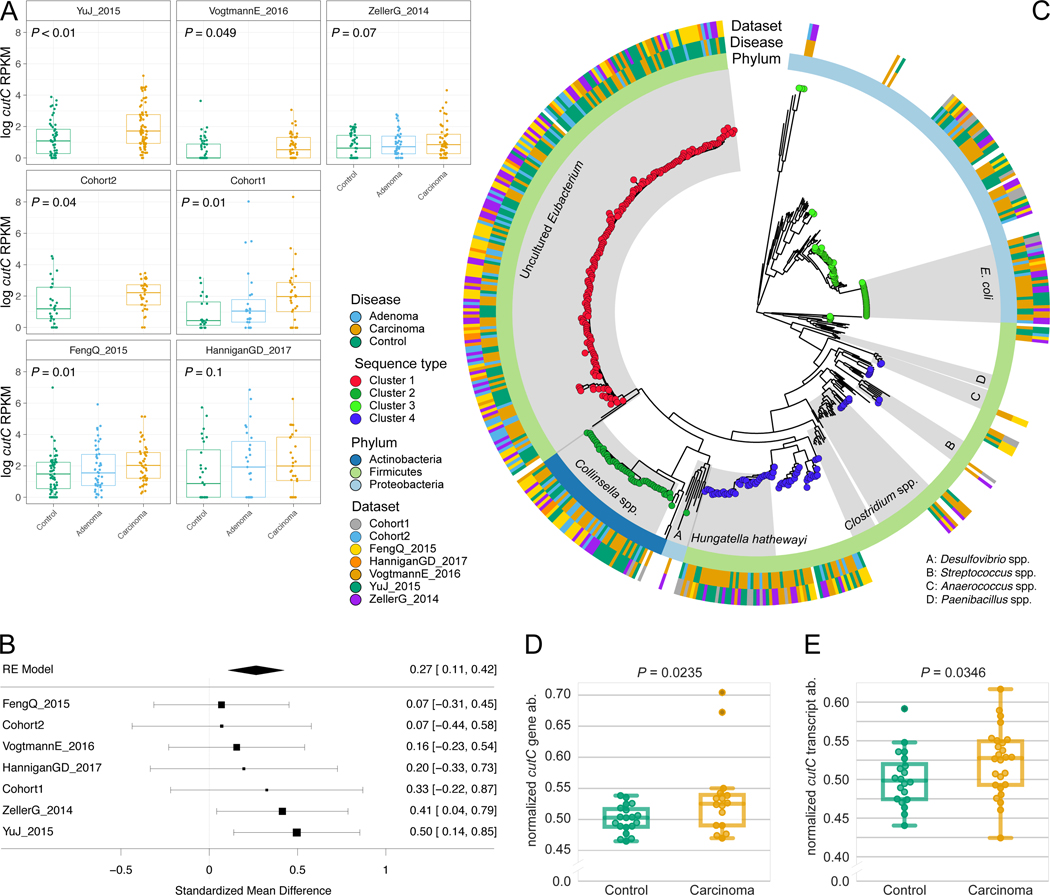
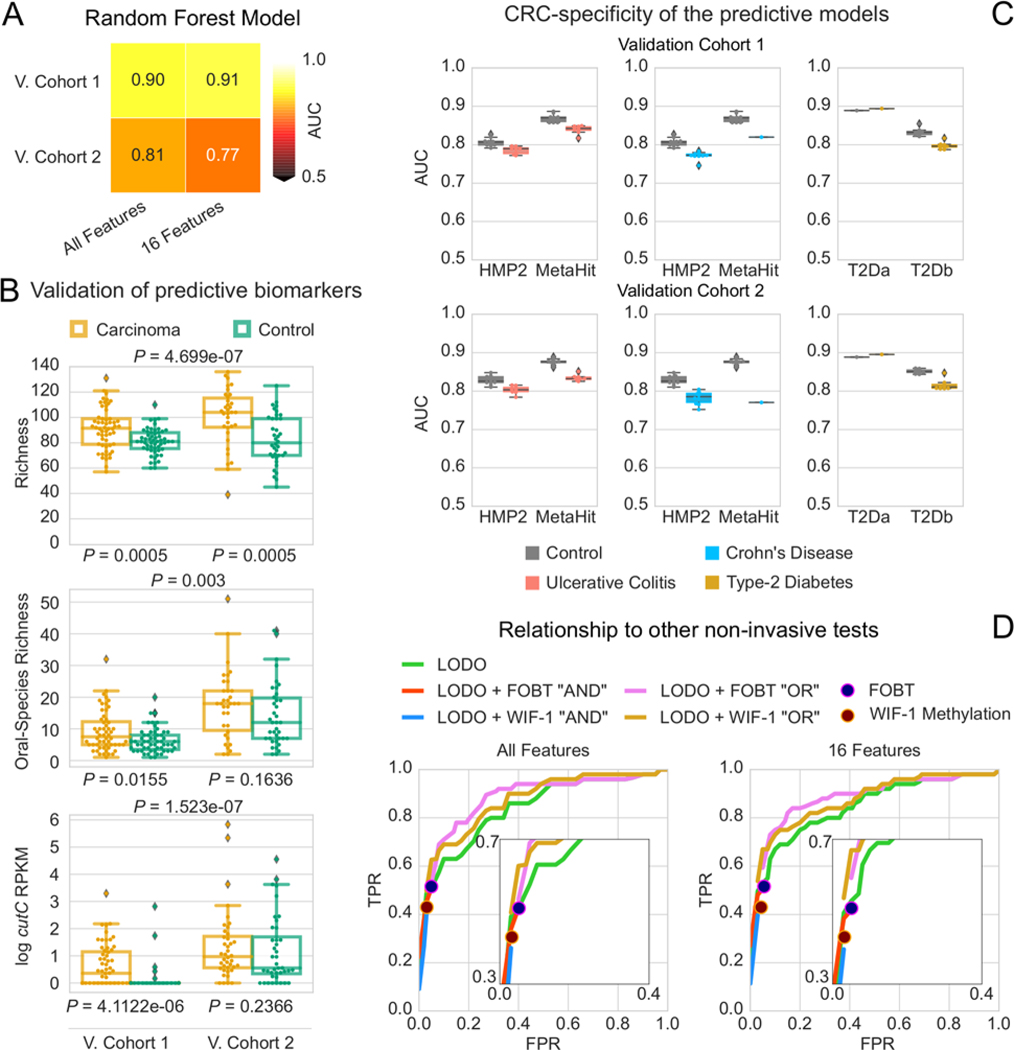
Several studies have investigated links between the gut microbiome and colorectal cancer (CRC), but questions remain about the replicability of biomarkers across cohorts and populations. We performed a meta-analysis of five publicly available datasets and two new cohorts and validated the findings on two additional cohorts, considering in total 969 fecal metagenomes. Unlike microbiome shifts associated with gastrointestinal syndromes, the gut microbiome in CRC showed reproducibly higher richness than controls (P < 0.01), partially due to expansions of species typically derived from the oral cavity. Meta-analysis of the microbiome functional potential identified gluconeogenesis and the putrefaction and fermentation pathways as being associated with CRC, whereas the stachyose and starch degradation pathways were associated with controls. Predictive microbiome signatures for CRC trained on multiple datasets showed consistently high accuracy in datasets not considered for model training and independent validation cohorts (average area under the curve, 0.84). Pooled analysis of raw metagenomes showed that the choline trimethylamine-lyase gene was overabundant in CRC (P = 0.001), identifying a relationship between microbiome choline metabolism and CRC. The combined analysis of heterogeneous CRC cohorts thus identified reproducible microbiome biomarkers and accurate disease-predictive models that can form the basis for clinical prognostic tests and hypothesis-driven mechanistic studies.


Figures

Fig. 1
Fig. 1. Sequencing depths and species richness across CRC datasets
(A) Boxplots reporting the total number of reads in each dataset. P-values between the carcinoma and control groups were calculated by two-tailed Wilcoxon rank-sum tests. (B) Boxplots showing the total number of microbial species per dataset. P-values were calculated by two-tailed Wilcoxon rank-sum tests. (C) Boxplots showing the total number of microbial species per dataset calculated on metagenomes subsampled in each dataset to the number of reads of the 10th percentile. P-values were calculated by two-tailed Wilcoxon rank-sum tests. (D) Multivariate analysis of species richness using crude and age, sex and BMI-adjusted coefficients obtained from linear models. (E) Meta-analysis of crude and adjusted multivariate richness coefficients using a random effects model. Bold lines represent the 95% confidence interval for the random effects model estimate.
Fig. 2
Fig. 2. Meta-analysis of species diversity andoral species richness in CRC datasets
A) Boxplots reporting the Shannon species diversity in each dataset. P-values between the carcinoma and control groups were calculated by two-tailed Wilcoxon rank-sum tests. (B) Boxplots reporting the Shannon species diversity calculated on metagenomes subsampled in each dataset to the number of reads of the 10th percentile. P-values were calculated by two-tailed Wilcoxon rank-sum tests. (C) Multivariate analysis of species diversity using crude and age, sex and BMI-adjusted coefficients obtained from linear models. (D) Meta-analysis of crude and adjusted multivariate Shannon diversity coefficients using a random effects model. Bold lines represent the 95% confidence interval for the random effects model estimate. (E) Boxplots reporting the total number of oral microbial species per dataset. P-values were calculated by two-tailed Wilcoxon rank-sum tests comparing values between controls and carcinomas for each dataset. (F) Multivariate analysis of putative oral species richness using crude and age, sex and BMI-adjusted coefficients obtained from linear models. (G) Meta-analysis of crude and adjusted multivariate putative oral species richness coefficients using a random effects model. Bold lines represent the 95% confidence interval for the random effects model estimate.
Fig. 3
Fig. 3. Two novel metagenomic cohorts identify clear but only partially overlapping microbiome signatures associated with CRC
(A) Relative abundances (log scale) and effect sizes (estimated using the LDA score in LEfSe) for the significantly different microbial species in CRC samples compared to control samples for Cohort1 (significance assessed by the non-parametric test in LEfSe) and (B) for Cohort2. (C) Alpha diversities measured as the total number of species and the total number of UniProt90 gene families in each sample for the two cohorts. (D) Beta-diversities estimated with the Bray-Curtis dissimilarity metric for intra- and inter-condition comparisons in the two cohorts.
Fig. 4
Fig. 4. Analysis of F. nucleatum markers, and taxonomic meta-analysis of CRC datasets.
(A) Percentages of F. nucleatum clade-specific markers (200 in total) in each per dataset. P-values were obtained by two-tailed Wilcoxon rank-sum tests comparing values between controls and carcinomas for each dataset. (B) Meta-analysis of CRC datasets using species-level MetaPhlAn2 profiles. Bold lines represent the 95% confidence interval for the random effects model estimate. (C) Multivariate analysis of meta-analysis species-level abundance biomarkers. Crude and age, sex and BMI adjusted coefficients for species associated with disease status in the meta-analysis of standardized mean differences.
Fig. 5
Fig. 5. Analysis of putative oral species’ abundances in CRC datasets and gene families richness across CRC datasets.
(A) Effect sizes of the abundances of significant putative oral species identified using a meta-analysis of standardized mean differences and a random effects model. Bold lines represent the 95% confidence interval for the random effects model estimate. (B) Total abundance of putative oral species in each gut metagenomic dataset. P-values were obtained by two-tailed Wilcoxon rank-sum tests comparing values between controls and carcinomas for each dataset. (C) The total number of reads in each sample of each dataset correlates with the total number of gene families identified using HUMANn2. Ellipses represent the 95% confidence level assuming a multivariate t-distribution. (D) Distribution of the total number of gene families identified in the samples of each dataset. P-values were obtained by two-tailed Wilcoxon rank-sum tests comparing values between controls and carcinomas for each dataset. (E) Distribution of the percentages of unmapped reads across datasets for UniProt90 gene families.
Fig. 6
Fig. 6. Cross-validation, cross-cohort, and LODO predictions using pathway abundances, species abundances, and species-specific markers.
(A) Prediction matrix reporting prediction performances as AUC values obtained using a Random Forest (RF) model on pathway relative abundances. Values on the diagonal refer to 20 times repeated 10-fold stratified cross validations. Off-diagonal values refer to the AUC values obtained by training the classifier on the dataset of the corresponding row and applying it on the dataset of the corresponding column. The Leave-One-Dataset-Out (LODO) row refers to the performances obtained by training the model on pathway abundances using all but the dataset of the corresponding column and applying it on the dataset of the corresponding column. (B) Prediction matrix as in (A) but using MetaPhlAn2 marker presence and absence information. (C) Prediction of samples-to-cohort assignments using species-level relative abundances. Only control samples from each dataset are considered. (D) Principal coordinate analysis of Bray-Curtis distances computed on MetaPhlAn2 species-level abundances across datasets. Ellipses represent the 95% confidence level assuming a multivariate t-distribution. (E) Cross prediction matrix for the performances of RF models in predicting adenomas versus CRC conditions. (F) Cross prediction matrix as described in (E) but on the distinction of adenomas versus controls.
Fig. 7
Fig. 7. Prediction performances at increasing numbers of external datasets considered in the training model
(A) Prediction performances computed based on MetaPhlAn2 species abundances. The dark yellow line interpolates the median AUC at each number of training datasets considered. (B) Prediction performances computed based on HUMANn2 gene-family abundances.
Fig. 8
Fig. 8. Identification of a minimal number of microbial gene-families for CRC-detection.
Prediction performances in the LODO-settings at increasing number of gene-families. Each ranking is obtained excluding the testing dataset to avoid overfitting.
Fig. 9
Fig. 9. Metagenomic analysis of genes involved in the TMA-synthesis pathway
(A) ShortBRED analysis of yeaW and caiT gene abundances. Points represent the log of reads per kilobase per million mapped reads (RPKM) for each sample and crosses represent mean values per group/dataset. (B) ShortBRED analysis of cutD gene abundances. Boxplots reports the RKPM abundances obtained using ShortBRED for the gene of the activating TMA-lyase enzyme cutD. P-values were calculated by two-tailed Wilcoxon rank-sum tests comparing values between controls and carcinomas for each dataset. (C) Forest plot showing effect sizes calculated using a meta-analysis of standardized mean differences and a random effects model on cutD RPKM abundances between carcinomas and controls. (D) Breadth of coverage of cutC gene sequence clusters across CRC datasets. (E) Depth of coverage of cutC gene sequence clusters across CRC datasets..
Fig. 10
Fig. 10. Cluster analysis of samples’ representative cutC sequence variants.
(A) Prediction strengths at differing number of clusters showing optimum numbers at 2 and 4 clusters. (B) Tables showing the number of samples for carcinomas, adenomas and controls with breadth of coverage >80% at two different cluster thresholds. P-values were calculated using a Fisher T-test and taxonomy was assigned by BLASTn and the cutC sequence database (criteria of 80% coverage, >97% identity and minimum 2000nt alignment length).
Figure 1.
Figure 1.. Reproducible taxonomic and functional microbial biomarkers across datasets when contrasting carcinoma against healthy controls (no adenoma samples considered).
(A) UpSet plot showing the number of taxonomic biomarkers identified using LEfSE on MetaPhlAn2 species profiles shared by combinations of datasets (see Suppl. Table 3 for all single significant associations). (B) Pooled effect sizes for the 20 significant features with the largest effect size calculated using a meta-analysis of standardized mean differences and a random effects model on MetaPhlAn2 species abundances and on (C) HUMANn2 pathway abundances. Bold lines represent the 95% confidence interval for the random effects model coefficient estimate. (D) Scatter plot of crude and age-, sex-, and BMI-adjusted coefficients obtained from linear models using MetaPhlAn2 species abundances. (E) Scatter plot of crude and age-, sex-, and BMI-adjusted coefficients obtained from linear models using HUMANn2 pathway abundances.
Figure 2.
Figure 2.. Assessment of prediction performances of the gut microbiome for CRC detection within and across cohorts.
(A) Cross prediction matrix reporting prediction performances as AUC values obtained using a Random Forest (RF) model on species-level relative abundances (see Methods). Values on the diagonal refer to 20 times repeated 10-fold stratified cross validations. Off-diagonal values refer to the AUC values obtained by training the classifier on the dataset of the corresponding row and applying it on the dataset of the corresponding column. The Leave-One-Dataset-Out (LODO) row refers to the performances obtained by training the model on the species-level abundances and MetaPhlAn2 markers using all but the dataset of the corresponding column and applying it on the dataset of the corresponding column. See Extended Data 6 for the marker cross-study validation matrix. (B) Cross prediction matrix of AUC values obtained using HUMANn2 UniRef90 gene-family abundances and HUMANn2 pathway relative abundances. See Extended Data 6 for the pathway cross-study validation matrix. (C) Prediction performances for the two Italian cohorts at increasing numbers of external datasets considered for training the model. The dark yellow line interpolates the median AUC at each number of training datasets considered. See Extended Data 7 for the plots referred to the other testing datasets. (D) Prediction performances at increasing number of datasets in the training, using HUMANn2 UniProt90 gene-family abundances. See Extended Data 7 for the plots referred to the other testing datasets.
Figure 3.
Figure 3.. Ranking relevance of each species in the predictive models for each dataset and identification of a minimal microbial signature for CRC detection.
(A) The importance of each species for the cross-validation prediction performance in each dataset estimated using the internal RF scores. Only species appearing in the five top ranking features in at least one dataset are reported. Prediction performances at increasing number of microbial species obtained by re-training the RF classifier on the N top ranked features identified with a first RF model training in a cross-validation (B) and LODO-setting (C). The rankings are obtained excluding the testing dataset to avoid overfitting.
Figure 4.
Figure 4.. Choline TMA-lyase gene cutC and its genetic variants are strong biomarkers for CRC-associated stool samples.
(A) Distribution of reads per kilobase million (RKPM) abundances obtained using ShortBRED for the choline TMA-lyase enzyme gene cutC. P-values were computed by two-tailed Wilcoxon Signed-Rank tests comparing values between controls and carcinomas for each dataset. (B) Forest plot reporting effect sizes calculated using a meta-analysis of standardized mean differences and a random effects model on cutC RPKM abundances between carcinomas and controls. (C) Phylogenetic tree of sample-specific cutC sequence variants identified four main sequence variants. Tips with no circles represent cutC sequence variants from genomes absent from the datasets. Taxonomy was assigned based on mapping against existing cutC sequences (criteria of 80% coverage, >97% identity and minimum 2,000nt alignment length). (D) qPCR validation of cutC gene abundance and (E) cutC transcript abundance (normalized by total 16S rRNA gene/transcript abundance) on a subset of DNA samples from Cohort1. qPCR validation P-values are obtained by 1-tail Wilcoxon Signed-Rank test.
Figure 5 -
Figure 5 -. Clinical potential and validation of the predictive biomarkers.
(A) Prediction performance of the taxonomic models trained on the 7 datasets of Table 1 and applied on the new validation cohorts confirmed the strong reproducibility of metagenomic models for CRC across cohorts when sufficiently large training cohorts are available. Feature ranking of the 16-species model are obtained the testing cohort to avoid overfitting. (B) Species richness, rarefied oral species richness, and cutC gene abundance (RPKM) are confirmed to be strong biomarkers of CRC in the validation datasets . P-values underlying the panels refer to one-tailed Wilcoxon Signed Rank test; P-values overlying the panels refer to the one-sided permutation-based Wilcoxon-Mann-Whitney tests, blocked for cohort. (C) Prediction performances as AUC values on the validation cohorts when adding external set of case and controls samples from metagenomic cohorts of diseases other than CRC (Crohn’s disease, ulcerative colitis, type-2 diabetes). (D) Assessment of the potential of microbiome-based prediction models in comparison and in combination with current non-invasive clinical screening tests. Models integrating our LODO machine learning approach with the FOBT or the Wif-1 Methylation tests are termed OR and AND, depending on whether only one or both need to be positive for the combined test to be positive.

Comment in

References

    1. Ferlay J. et al. Cancer incidence and mortality worldwide: sources, methods and major patterns in GLOBOCAN 2012. Int. J. Cancer 136, E359–86 (2015). - PubMed
    1. Siegel R, Desantis C. & Jemal A. Colorectal cancer statistics, 2014. CA Cancer J. Clin 64, 104–117 (2014). - PubMed
    1. Frank C, Sundquist J, Yu H, Hemminki A. & Hemminki K. Concordant and discordant familial cancer: Familial risks, proportions and population impact. Int. J. Cancer 140, 1510–1516 (2017). - PubMed
    1. Foulkes WD Inherited susceptibility to common cancers. N. Engl. J. Med 359, 2143–2153 (2008). - PubMed
    1. Johnson CM et al. Meta-analyses of colorectal cancer risk factors. Cancer Causes Control 24, 1207–1222 (2013). - PMC - PubMed

Methods-only References

    1. Langmead B. & Salzberg SL Fast gapped-read alignment with Bowtie 2. Nat. Methods 9, 357 (2012). - PMC - PubMed
    1. Truong DT et al. MetaPhlAn2 for enhanced metagenomic taxonomic profiling. Nat. Methods 12, 902–903 (2015). - PubMed
    1. Abubucker S. et al. Metabolic reconstruction for metagenomic data and its application to the human microbiome. PLoS Comput. Biol 8, e1002358 (2012). - PMC - PubMed
    1. Breiman L. Random Forests. Mach. Learn 45, 5–32 (2001).
    1. Pedregosa F. et al. Scikit-learn: Machine Learning in Python. J. Mach. Learn. Res 12, 2825–2830 (2011).

Publication types